


fig7
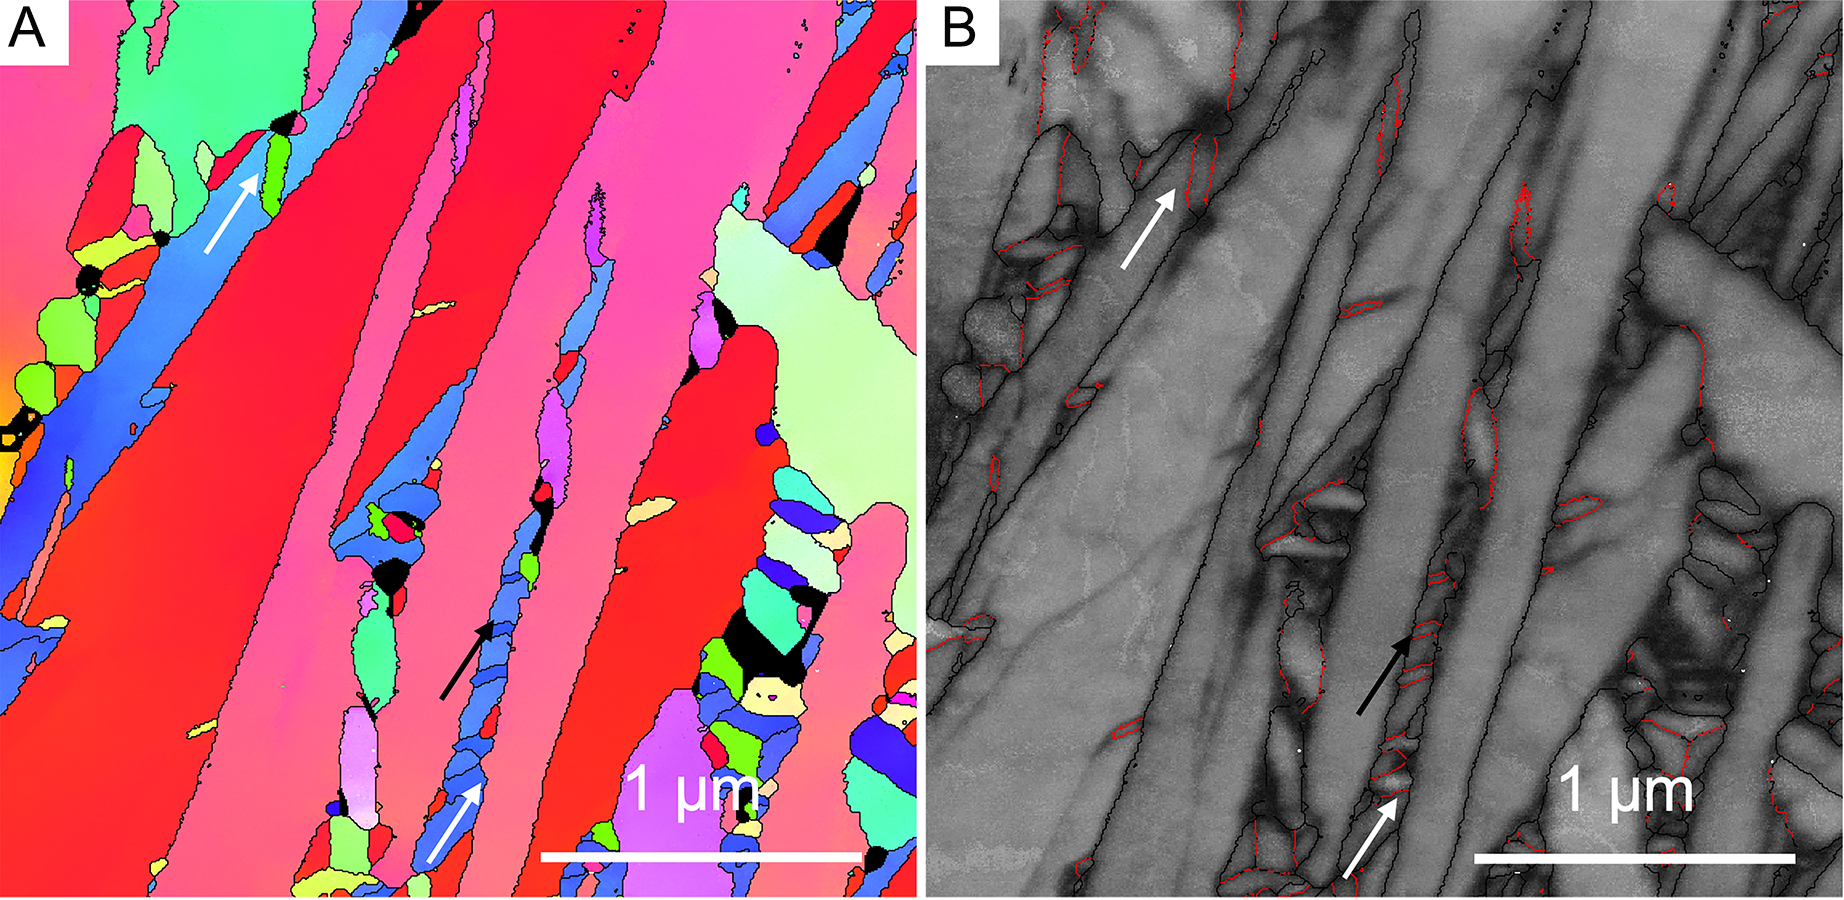
Figure 7. A typical microstructure in a bottom layer of the L-DED Ti-6Al-4V sample. (A) TKD IPF map showing a hierarchical martensitic structure. (B) GB map showing the distribution of GB types. The colour codes for marking different types of GBs are the same as in


