


fig8
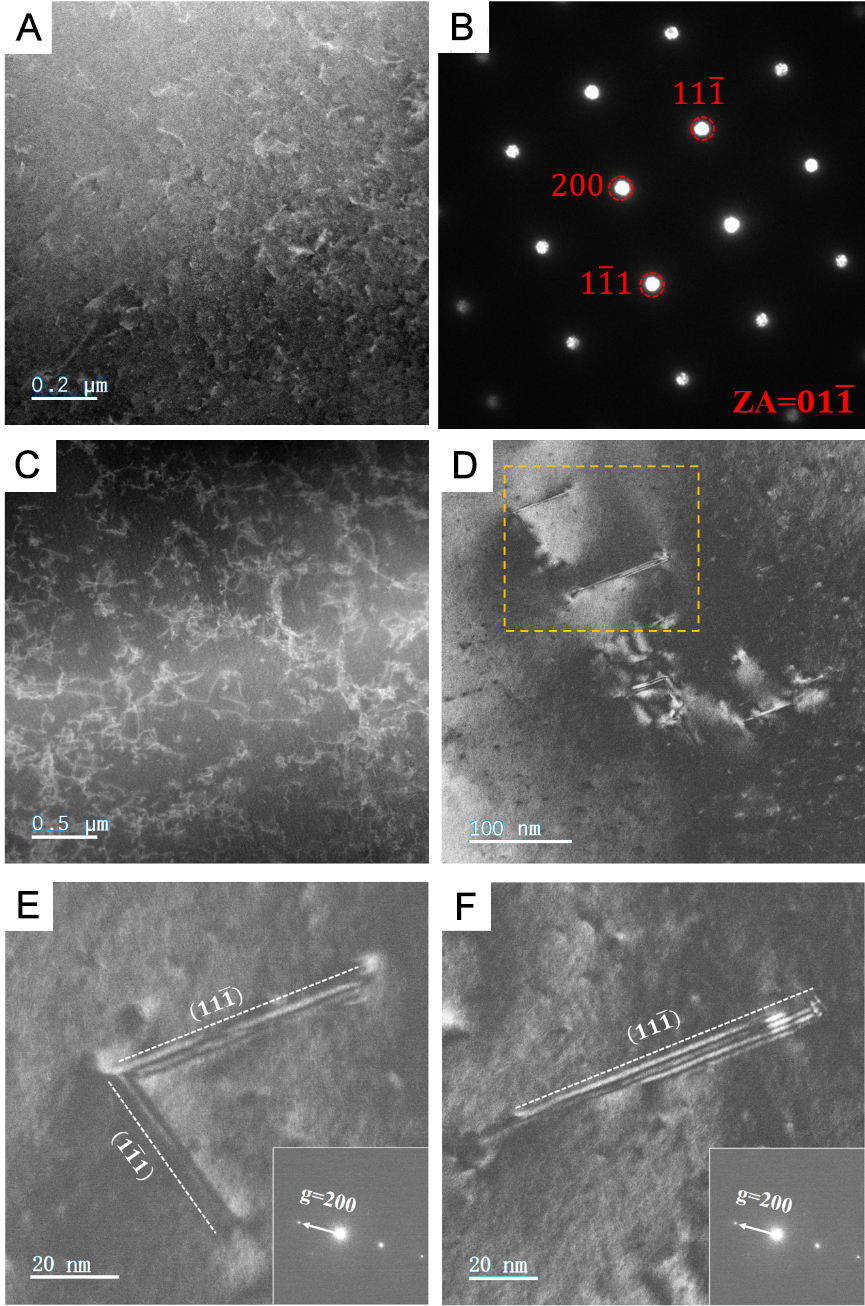
Figure 8. TEM images of the FZ before and after cyclic loading at 4.2 K: (A) the STEM image of the FZ before fatigue, showing the dislocations, (B) the SAED pattern obtained from (A), (C) the STEM image of the FZ after fatigue, showing the dislocation multiplication, (D) The weak-beam dark-field images of dislocations in the FZ after fatigue, (E) the image of a Lomer-Cottrell lock that formed by the reaction of two partial dislocations in the FZ after fatigue, (F) the images of dissociated dislocations in the FZ after fatigue. TEM: Transmission electron microscopy; FZ: fusion zone; STEM: scanning transmission electron microscopy; SAED: selected area electron diffraction.


