


fig7
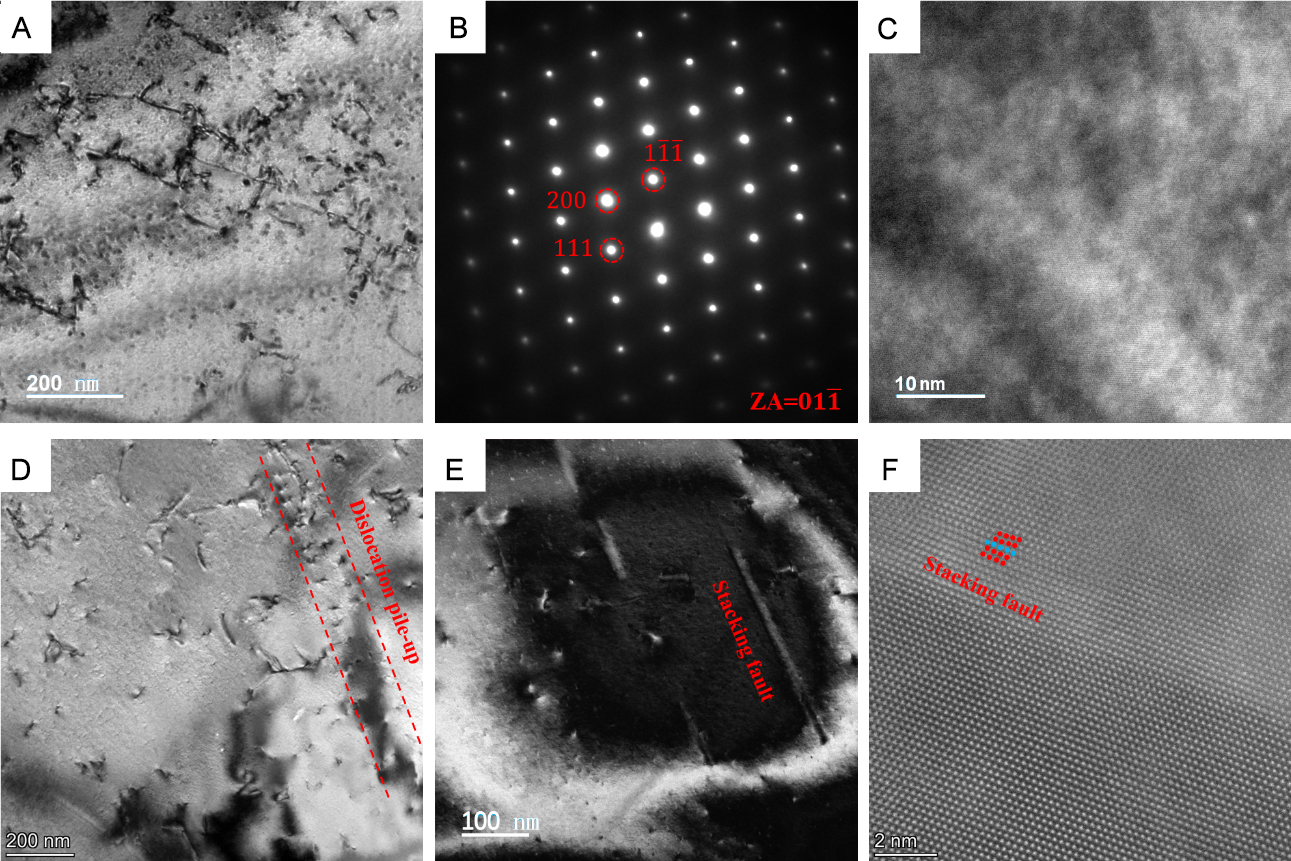
Figure 7. TEM images of the HAZ before and after cyclic loading at 4.2 K: (A) the bright-field image before fatigue, (B) the SAED pattern obtained from (A), (C) the HRTEM image obtained from (A), (D) the bright-field image after fatigue, (E) the image of HAZ after fatigue showing the formation of stacking faults, (F) HAADF STEM imaging of HAZ after fatigue, showing the stacking faults. TEM: Transmission electron microscopy; HAZ: heat-affected zone; SAED: selected area electron diffraction; HRTEM: high-resolution TEM; STEM: scanning TEM; HAADF: high-angle annular dark-field.


