


fig1
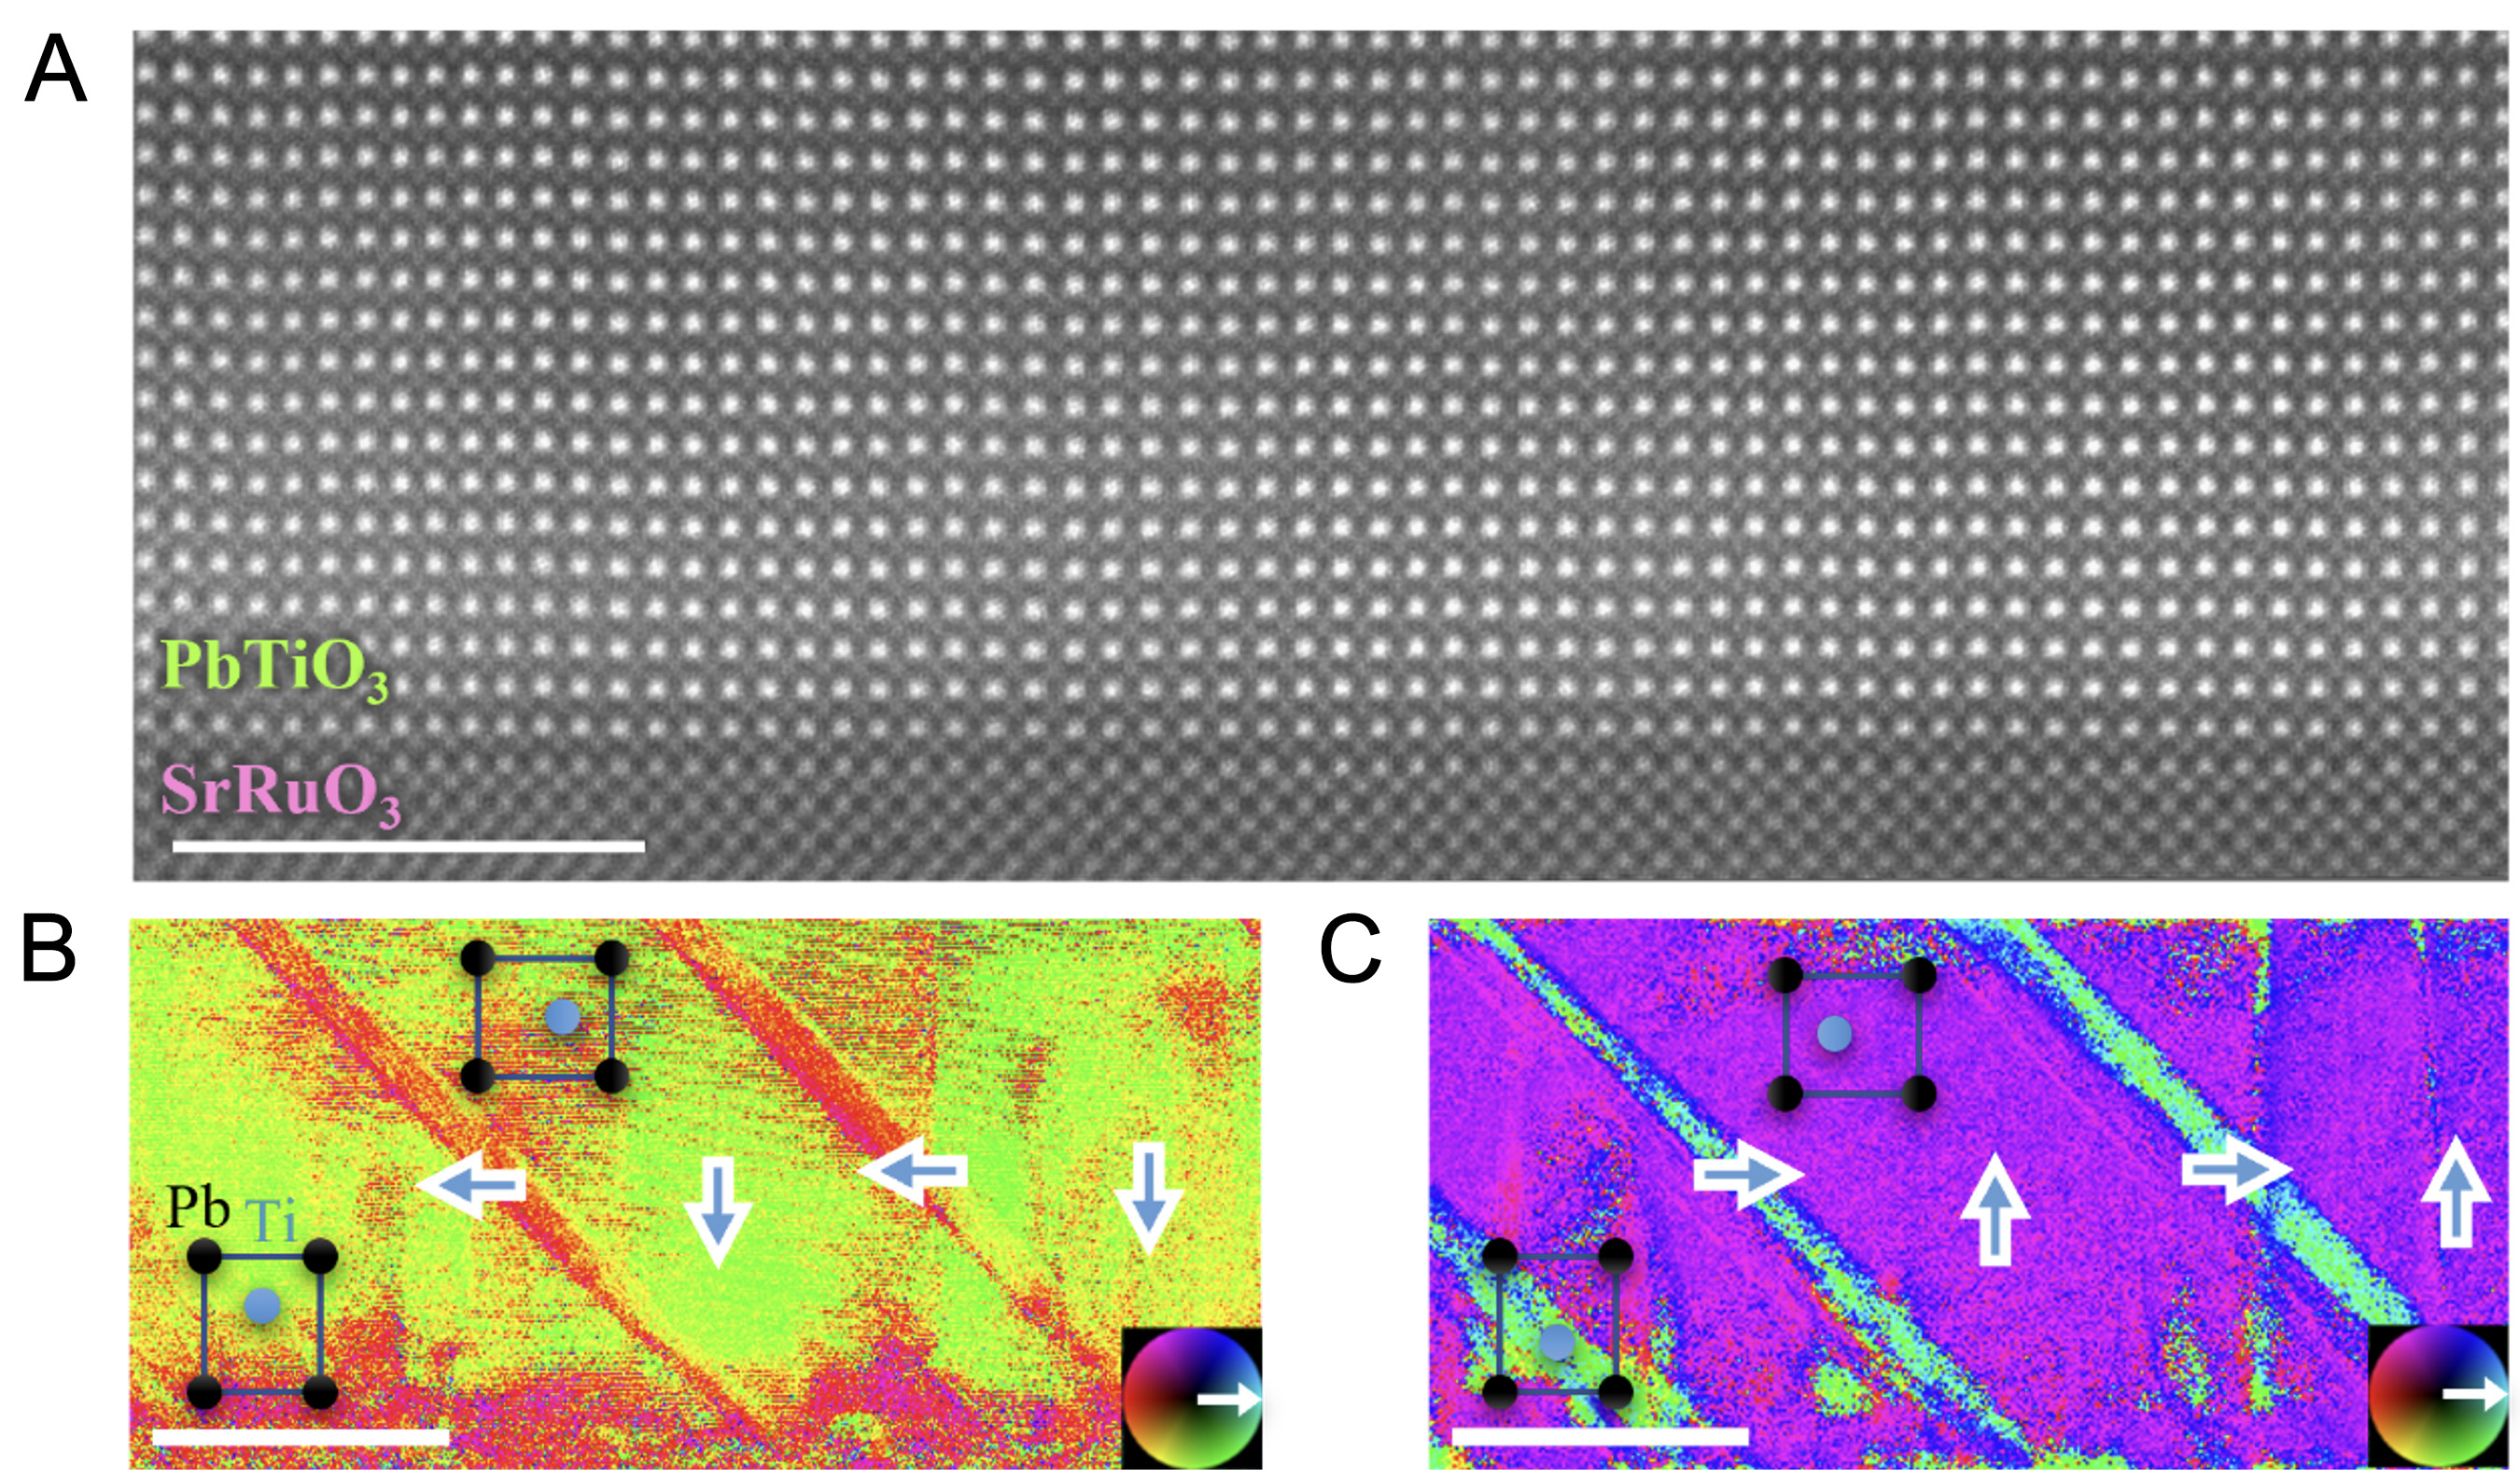
Figure 1. (A) HAADF-STEM image of the as-grown PTO/SRO films along the [100] zone axis. Reconstructed polarization vector maps in the 200 nm thick PTO films derived from DPC electric-field images acquired (B) before and (C) after poling. DPC analysis is restricted to PTO layer. Blue arrows indicate the polarization orientations of each domain corresponding to the schematic atomic structure. The white scale bar represents 5 nm in (A) and 100 nm in (B) and (C). HAADF: High-angle annular dark-field; PTO: PbTiO3; SRO: SrRuO3; DPC: differential phase contrast; STEM: scanning transmission electron microscopy.


