


fig1
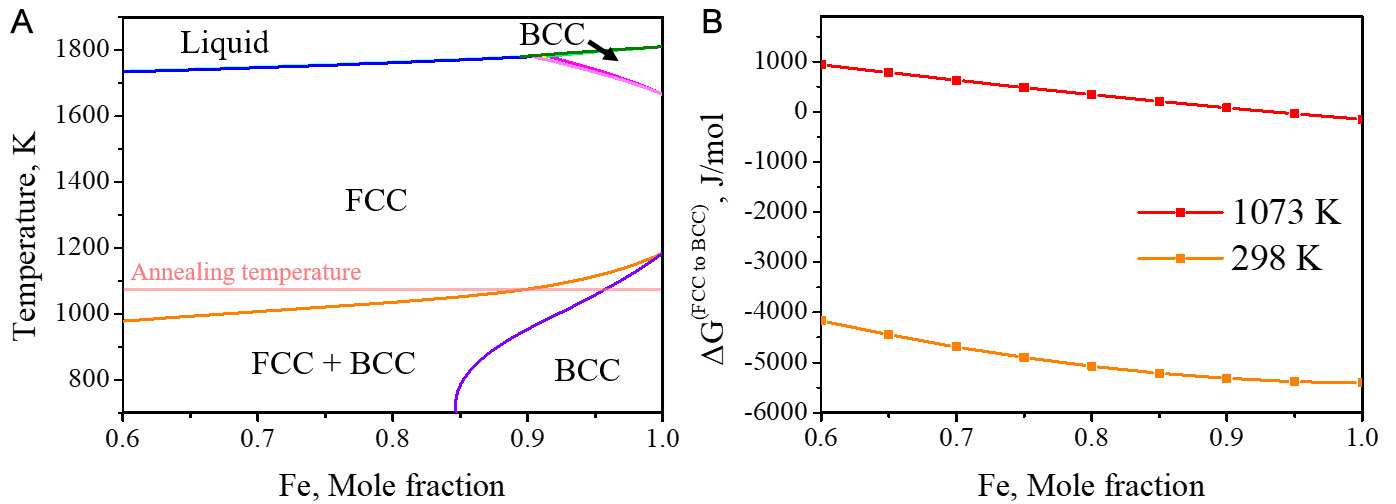
Figure 1. Thermodynamic calculation of ferrous MEA-pure Fe multi-material. (A) Equilibrium phase diagram in a FeCoCrNi alloy system according to the Fe fraction from 0.6 to 1.0. The horizontal line in equilibrium phase diagram indicates the annealing temperature of


