


Forensic insights and genetic diversity: unveiling the Yunnan Yi and Qinghai Tibetan groups in China using a Multi-InDel panel
 0
0 Abstract
Aim: Multi-InDel markers, which exhibit greater genetic diversity than single InDel loci, hold significant potential for forensic applications. To enhance the detection rate in degraded DNA samples, our laboratory developed a novel Multi-InDel panel comprising 41 Multi-InDel markers. This study aims to verify the forensic efficacy of this Multi-InDel panel in two Chinese minority groups.
Methods: In this study, we assessed the forensic performance of this Multi-InDel panel by genotyping 92 Yunnan Yi (YNY) and 173 Qinghai Tibetan (QHT) individuals, both belonging to Chinese ethnic minorities. We also explored the genetic relationships between these two groups and 28 global reference populations.
Results: The results showed that 40 of the Multi-InDel markers (excluding MI38) exhibited high polymorphism in the YNY and QHT groups, with cumulative probabilities of matching of 2.28 × 10⁻²⁶ (YNY) and 5.64 × 10⁻²⁶ (QHT), and cumulative probabilities of exclusion of 0.9999995429 (YNY) and 0.9999984549 (QHT), respectively. Full sibling identification accuracies in the YNY and QHT groups, along with seven East Asian reference populations, averaged 98.89%, 96.48%, 90.47%, 78.82%, and 61.83% at likelihood ratio (LR) thresholds of 1, 10, 100, 1,000, and 10,000, respectively. Genetic analyses revealed close affinities between the studied groups and other East Asian populations. Additionally, the Multi-InDel panel effectively distinguished African, East Asian, and European populations.
Conclusion: The Multi-InDel panel demonstrated strong performance in various forensic applications, including individual identification, paternity testing, and full sibling identification in the YNY and QHT groups. Moreover, these two groups exhibited closer genetic relationships with East Asian populations than with other global populations.

Keywords
INTRODUCTION
For many years, short tandem repeat (STR) markers have been regarded as the gold standard for forensic DNA analysis, playing a crucial role in individual identification and paternity testing[1,2]. However, STR markers are less effective in analyzing degraded and mixed samples due to their long amplicons and the presence of stutter peaks. Alternative genetic markers, such as single nucleotide polymorphisms (SNPs) and insertion/deletion (InDel) polymorphisms, have been proposed because of their low mutation rates, short amplicons, and capacity to provide ancestry information[3-5]. Among these, microhaplotypes (MHs), which consist of closely linked SNPs within 300 bp, provide more genetic information than a single SNP locus[6,7]. Similarly, Multi-InDel markers, which contain two or more linked InDels within a short amplicon, combine the advantages of STR and SNP markers. These markers overcome the limitation of low genetic polymorphism associated with single InDel locus and can be genotyped using capillary electrophoresis (CE)[8]. The forensic potential of Multi-InDel markers has been confirmed by previous studies[9-12]. For example, Fan et al. developed a panel of ten Multi-InDels on the X chromosome that successfully distinguished ancestry among three major continental populations, demonstrating comparable efficiency to a prior panel containing 21 AIM-InDels[13]. Qu et al. developed a multiplex panel compatible with CE, comprising 18 Multi-InDel markers, which proved effective in addressing forensic challenges[14].
According to China’s seventh national population census (https://www.stats.gov.cn/zt_18555/zdtjgz/zgrkpc/dqcrkpc/), the Yi group is the seventh largest ethnic minority, with a population exceeding 9.8 million, primarily residing in Yunnan, Sichuan, and Guizhou provinces[15]. The Tibetan group ranks as the ninth largest minority, mainly living in the Tibet Autonomous Region as well as Qinghai and Gansu provinces[16]. Notably, Tibetans represent the largest minority in Qinghai, with a population of about one million.
In this study, we assessed the forensic efficacy of our Multi-InDel panel in the Yunnan Yi (YNY) and Qinghai Tibetan (QHT) groups. Additionally, we included 28 reference populations from five continents to explore the genetic relationships among the two studied groups and these global populations.
METHODS
Sample collection
A total of 265 peripheral blood samples were collected from unrelated healthy volunteers, including 92 YNY individuals and 173 QHT individuals. All volunteers claimed that they had no family history of migration or more than three generations of blood relatives. Written informed consent was obtained from each volunteer prior to sample collection. Blood samples were spotted onto FTA cards to create blood stains for easier preservation. The study was reviewed and approved by the Ethics Committees of Southern Medical University and Xi’an Jiaotong University (No. 2019-1039).
DNA extraction and quantification
Each sample was prepared using a 1 mm2 bloodstain obtained with a hole punch for direct amplification; alternatively, its genomic DNA was extracted using the conventional Chelex-100 method. A NanoDrop 2000 spectrophotometer was used to measure the purity and concentration of the genomic DNA, ensuring that the OD260/OD280 ratio was within the optimal range of 1.7 to 1.9. Finally, the DNA was diluted with sterile deionized water for subsequent analyses or preservation.
PCR amplification and CE detection
The Multi-InDel panel was amplified using the GeneAmp® PCR System 9700 Thermal Cycler (Applied Biosystem, Foster City, CA, USA), following the protocol described in previous study[20]. CE detection was performed on the 3500xL Genetic Analyzer (Applied Biosystem, Foster City, CA, USA). Genotype data were analyzed using GeneMapper™ ID-X version 1.5 software (Applied Biosystem, Foster City, CA, USA). We carefully examined the genotyping profiles and extracted genotype data for subsequent analyses.
The alleles were distinguished based on the lengths of different amplicon fragments, and were labeled as 1, 2, 3, and 4 in the genotyping profiles. Allele 1, the shortest amplicon, contained two deletion alleles. Allele 4, the longest amplicon, comprised two insertion alleles. Alleles 2 and 3 each included one deletion and one insertion allele; they were differentiated by fragment length, with the shorter fragment designated as allele 2 and the longer fragment as allele 3.
Reference population data
The simulation data and intra-laboratory data were used to establish the reference population dataset. To generate the simulation data, genotype information for 82 InDel loci was first obtained from 26 reference populations included in the 1,000 Genomes Project phase 3 database, available on the Ensembl website
Data analysis
Allele frequencies, pairwise linkage disequilibrium (LD) tests, and Hardy-Weinberg equilibrium (HWE) analyses for the panel in the YNY and QHT groups were calculated using the online tool STRAF version 2.1.5[23]. The P values from the LD and HWE analyses were adjusted using Bonferroni correction. Forensic parameters, such as polymorphism information content (PIC), observed heterozygosity (Hobs), discrimination power (DP), match probability (MP), and probability of exclusion (PE), were also calculated for both groups using STRAF. The cumulative probability of matching (CPM) and cumulative probability of exclusion (CPE) for the panel in the YNY and QHT groups were computed according to established formulas[17]. To evaluate the panel's forensic efficacy for full sibling testing within the YNY and QHT groups and seven EAS reference populations, Familias 3 software[24] was used to simulate 10,000 full sibling pairs and 10,000 unrelated pairs based on allele frequencies in these populations. Five different likelihood ratio (LR) thresholds (1, 10, 100, 1,000, and 10,000) were set as criteria for kinship determination. Additionally, informativeness for assignment (In) and the effective number of alleles (Ae) were calculated following previously proposed methods[7,25].
Pairwise fixation index (FST)[26] and Nei’s DA distance[27] among the 30 populations were calculated using Arlequin version 3.5 and the DISPAN program, respectively. To comprehensively explore differences among 3,069 individuals from these 30 populations, principal component analysis (PCA) was conducted at both the individual and population levels using R software based on raw genotype data and allele frequencies, respectively. Multidimensional scaling (MDS) analysis was performed using IBM SPSS Statistics version 26.0 software[28] to further investigate genetic relationships among the populations. To visualize genetic distances, Neighbor-Joining (NJ) and Unweighted Pair Group Method with Arithmetic mean (UPGMA) trees were constructed using MEGA version 7 software[29] based on DA distances and visualized with ITOL (https://itol.embl.de/). Unsupervised ancestral component inference for the 3,069 individuals from 30 populations was performed using STRUCTURE version 2.3.4 software[30]. Each parameter set was analyzed with 20 replicates for K values ranging from 2 to 6, with each run including a burn-in period of 10,000 and 10,000 MCMC repetitions after burn-in. The optimal K value was determined using Structure Harvester (http://taylor0.biology.ucla.edu/structureHarvester/). To assess result stability, the average permuted population and individual Q-matrices from 20 replicates at each K value were evaluated using CLUMPP version 1.1.2 software[31]. The final results were then plotted using DISTRUCT version 1.1 software[32], and visualizations were generated using Chiplot (https://www.chiplot.online/) and R software.
RESULTS
Genetic polymorphism analyses of the Multi-InDel panel in the YNY and QHT groups
After applying Bonferroni correction, all markers except MI38 conformed to HWE, consistent with previous studies[21,33]. Consequently, the MI38 marker was excluded from subsequent analyses. Upon re-evaluating HWE and LD tests, the remaining 40 Multi-InDel markers all conformed to HWE (P > 0.05/40 = 1.25 × 10⁻³) and were in linkage equilibrium (P > (0.05 × 2)/(40 × 39) = 6.41 × 10⁻⁵)
Forensic parameters for the 40 Multi-InDel markers in the YNY and QHT groups are listed in Supplementary Table 4. Violin plots illustrating the parameter distributions in both groups are shown in Figure 1, with yellow and blue representing the YNY and QHT groups, respectively. In the YNY group, PIC values ranged from 0.3313 to 0.5923 (mean: 0.5343), while in the QHT group, they ranged from 0.3206 to 0.5907 (mean: 0.5243). Hobs values ranged from 0.3804 (MI26) to 0.6739 (MI5 and MI12) in the YNY group, and from 0.4046 (MI26) to 0.7110 (2MI54) in the QHT group. The CPM values were 2.28 × 10⁻²⁶ (YNY) and 5.64 × 10⁻²⁶ (QHT), with corresponding CPE values of 0.9999995429 and 0.9999984549, respectively.

Figure 1. Violin plots of forensic parameters for 40 Multi-InDel markers in the YNY and QHT groups. Blue represents the QHT group and yellow represents the YNY group. PIC: polymorphism information content; Hobs: observed heterozygosity; DP: discrimination power; MP: match probability; PE: probability of exclusion.
We further analyzed allele frequency distributions for the 40 Multi-InDel markers in both groups and visualized the results using heatmaps [Figure 2 and Supplementary Table 5]. The heatmaps showed that, except for the MI26 and 2MI6 markers, which had two alleles each, the remaining markers possessed three or four alleles, with three alleles being most common in both groups. Overall, the allele frequency distributions were similar between the YNY and QHT groups.
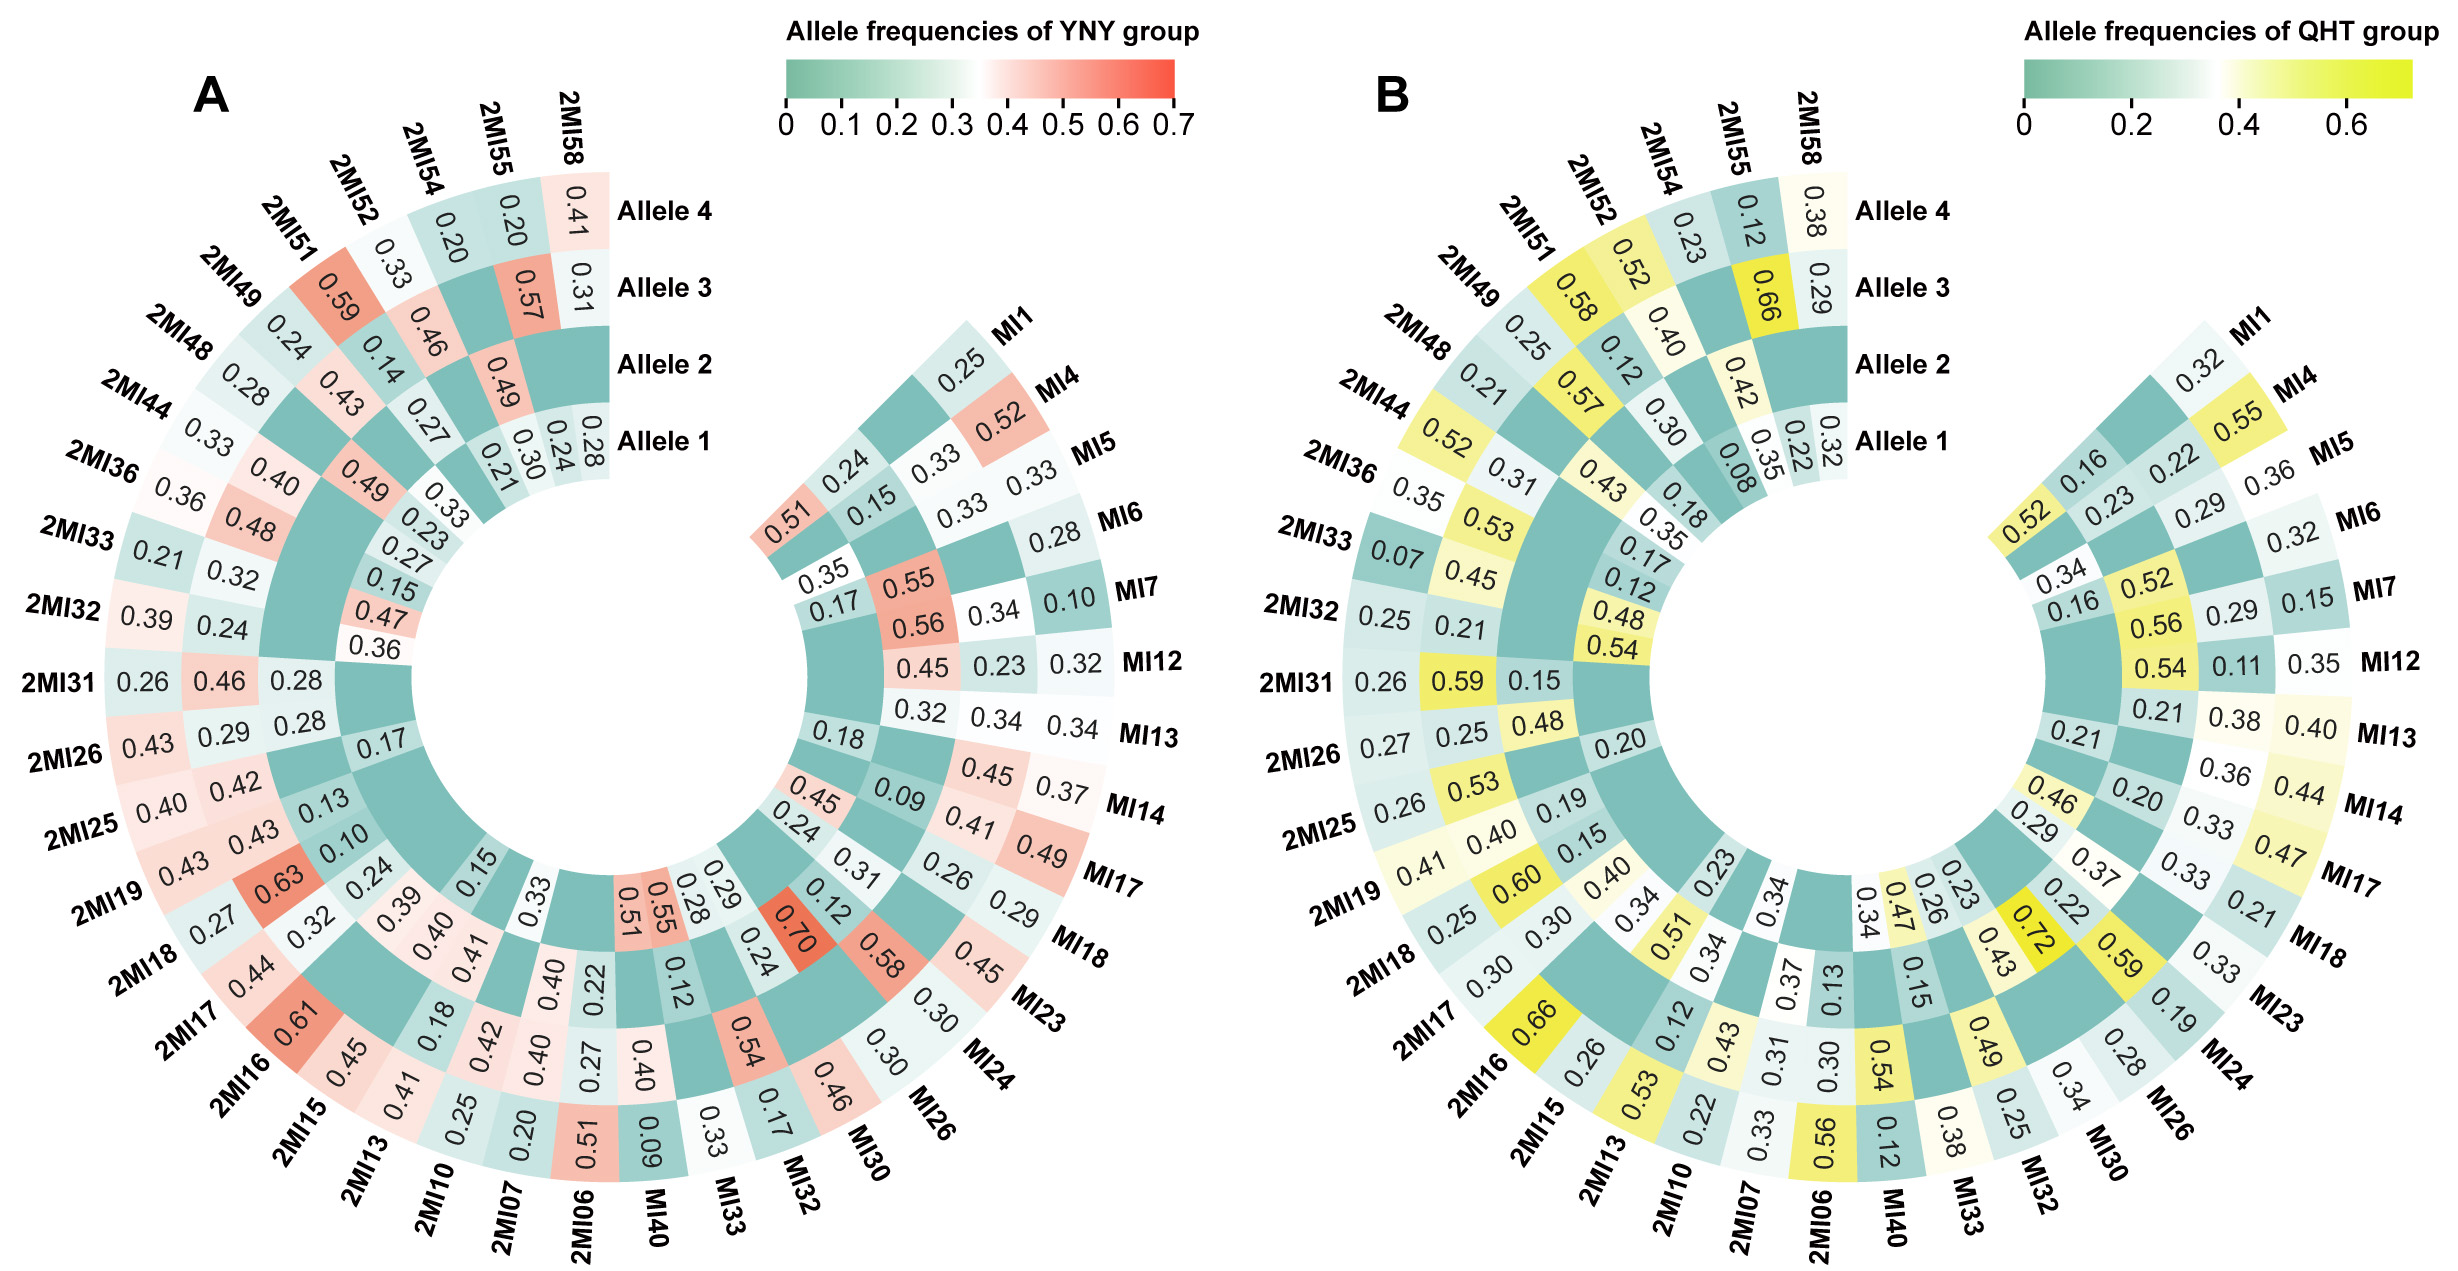
Figure 2. Heatmaps of allele frequencies for the 40 Multi-InDel markers in the YNY and QHT groups. (A) Heatmap of allele frequencies in the YNY group, with a color gradient ranging from green to red indicating low to high values; (B) Heatmap of allele frequencies in the QHT group, with a color gradient ranging from green to yellow indicating low to high values.
Forensic efficacy of the Multi-InDel panel for full sibling identification
The LR method was used to evaluate the forensic efficacy of the Multi-InDel panel for full sibling identification in the YNY and QHT groups, as well as in seven EAS reference populations. Figure 3 shows probability density curves for simulated full sibling pairs and unrelated pairs in the YNY and QHT groups, demonstrating a clear separation between full siblings and unrelated individuals. Table 1 presents the accuracy distributions at different LR thresholds (1, 10, 100, 1,000, and 10,000) for the nine EAS populations. In the YNY group, setting LR thresholds at these values enabled the correct distinction of 98.85%, 96.56%, 90.02%, 77.67%, and 60.77% of full sibling pairs from unrelated pairs, with corresponding false-positive rates of 1.09%, 0.24%, 0.05%, 0%, and 0%, respectively. In the QHT group, the panel achieved comparable accuracies (98.74%, 96.15%, 90.02%, 77.76%, and 60.16%) with similarly low false-positive rates (1.11%, 0.28%, 0.02%, 0.01%, and 0%) at the same thresholds. Overall, in the nine EAS populations, the Multi-InDel panel consistently demonstrated reliable and accurate performance for full sibling identification.
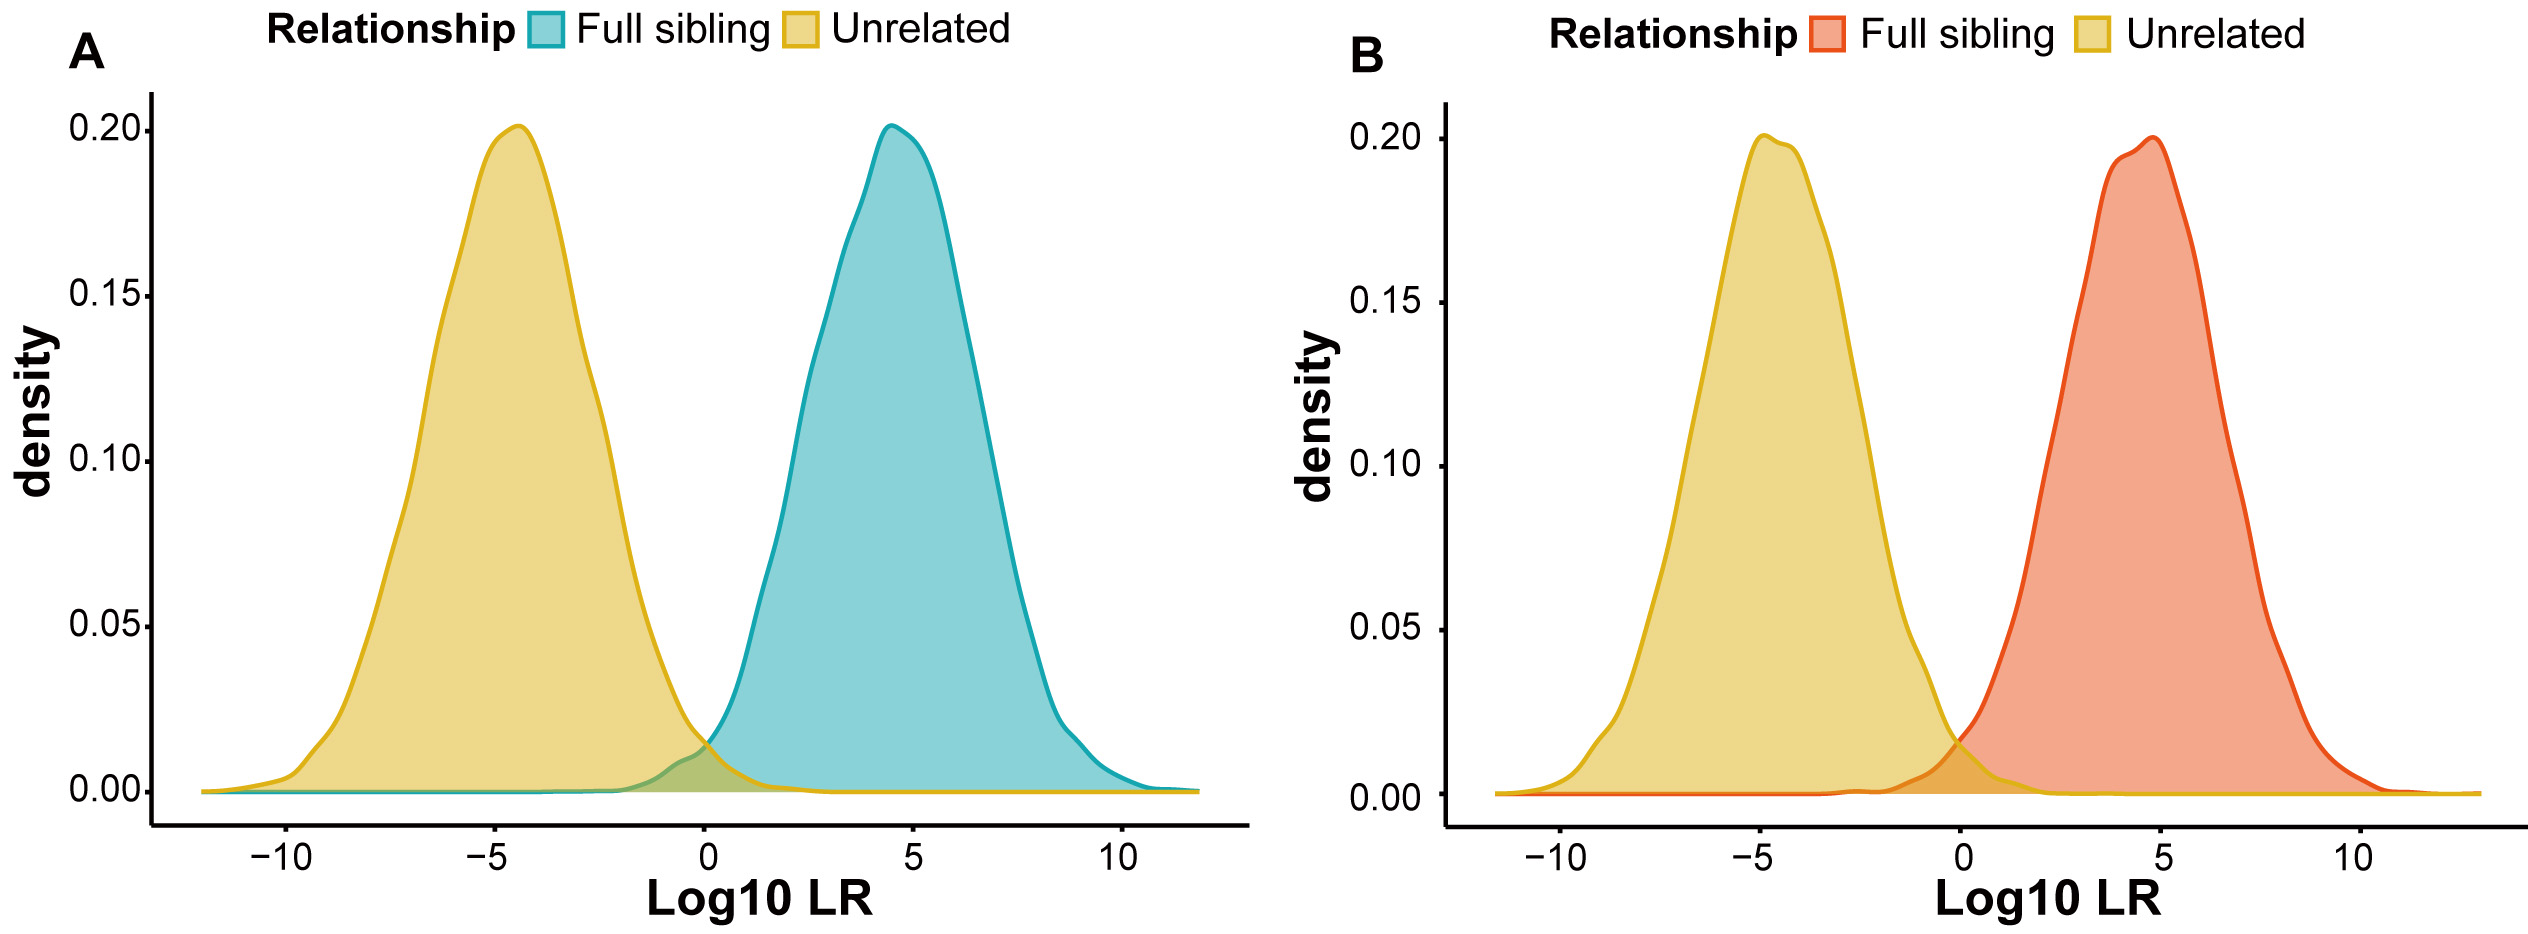
Figure 3. Log10 LR density distribution curves. (A) Simulated full sibling and unrelated pairs in the YNY group; (B) Simulated full sibling and unrelated pairs in the QHT group. Yellow indicates 10,000 simulated unrelated pairs, blue indicates 10,000 simulated full sibling pairs in the YNY group, and orange indicates 10,000 simulated full sibling pairs in the QHT group.
Accuracy rates and false-positive rates for full sibling identification using 40 Multi-InDel markers at different LR thresholds in nine EAS populations
| Population | LR = 1 | LR= 10 | LR = 100 | LR = 1,000 | LR = 10,000 | |||||
| AR (%) | FPR (%) | AR (%) | FPR (%) | AR (%) | FPR (%) | AR (%) | FPR (%) | AR (%) | FPR (%) | |
| CDX | 99.00 | 0.78 | 96.79 | 0.20 | 90.94 | 0.01 | 79.37 | 0.01 | 63.15 | 0.00 |
| CHB | 98.95 | 0.92 | 96.84 | 0.23 | 91.11 | 0.06 | 80.12 | 0.01 | 63.17 | 0.00 |
| CHS | 98.97 | 0.94 | 96.47 | 0.11 | 91.01 | 0.01 | 80.33 | 0.01 | 63.45 | 0.00 |
| JPT | 98.89 | 0.91 | 96.57 | 0.22 | 90.37 | 0.04 | 78.70 | 0.00 | 62.45 | 0.00 |
| KHV | 98.94 | 0.87 | 96.73 | 0.18 | 91.08 | 0.04 | 80.03 | 0.01 | 63.70 | 0.00 |
| Manchu | 98.89 | 1.00 | 96.32 | 0.20 | 90.24 | 0.05 | 78.24 | 0.01 | 60.31 | 0.00 |
| Mongolian | 98.75 | 1.22 | 95.92 | 0.27 | 89.43 | 0.03 | 77.18 | 0.00 | 59.32 | 0.00 |
| YNY | 98.85 | 1.09 | 96.56 | 0.24 | 90.02 | 0.05 | 77.67 | 0.00 | 60.77 | 0.00 |
| QHT | 98.74 | 1.11 | 96.15 | 0.28 | 90.02 | 0.02 | 77.76 | 0.01 | 60.16 | 0.00 |
Ae and In values of the 41 Multi-InDel markers in the YNY and QHT groups
In this study, we calculated Ae values for 40 Multi-InDel markers in the YNY and QHT groups based on allele frequencies to evaluate their ability to resolve DNA mixtures; the results are shown in
FST values and DA distances among 30 populations
We assessed the population genetics of the YNY and QHT groups, along with 28 reference populations, by calculating FST values and DA distances. Results are shown in Figure 4 and Supplementary Tables 7 and 8. In the YNY group, the largest DA distances and FST values were observed with AFR populations (DA: 0.0204-0.0909; FST: 0.0823-0.1225), while the smallest were with EAS populations (DA: 0.0069-0.0422; FST: 0.0099-0.0261). Similarly, for the QHT group, the largest DA distances and FST values were observed with AFR populations (DA: 0.0203-0.0774; FST: 0.0917-0.1335), and the lowest values were with EAS populations (DA: 0.0030-0.0408; FST: 0.0056-0.0302).
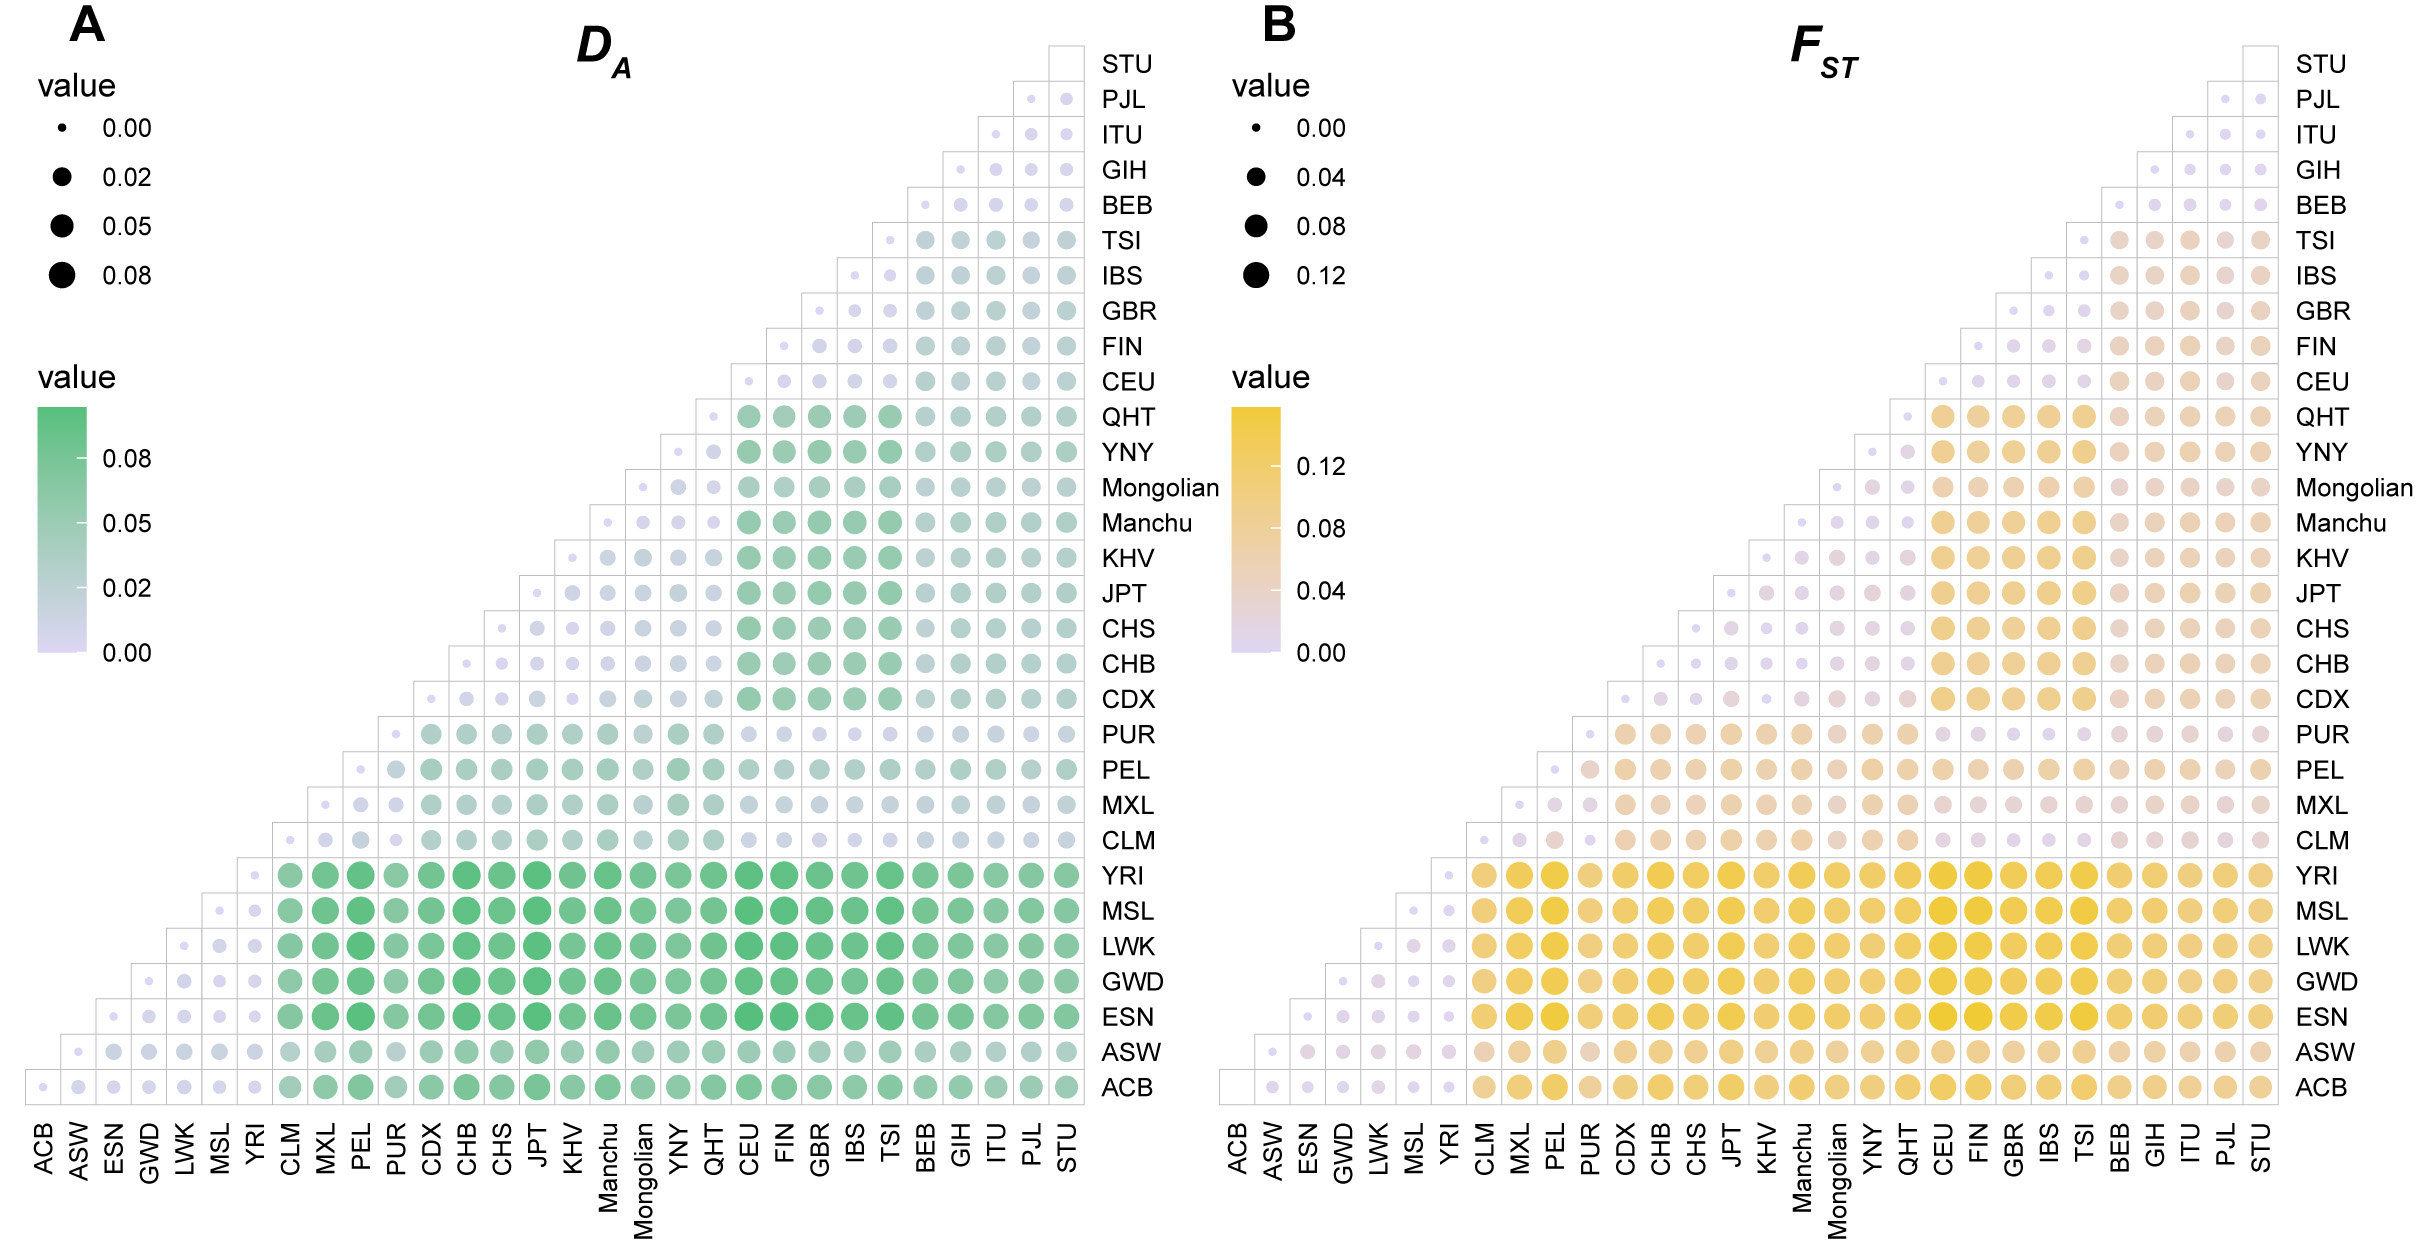
Figure 4. DA distances and FST values among 30 populations. (A) Pairwise DA distances. The color gradient ranges from grey to green, indicating increasing distances. (B) Pairwise FST values. The color gradient ranges from grey to yellow, indicating increasing differentiation. ACB: African Caribbean in Barbados; ASW: African Ancestry in Southwest US; ESN: Esan in Nigeria; GWD: Gambian in Western Division: The Gambia; LWK: Luhya in Webuye: Kenya; MSL: Mende in Sierra Leone; YRI: Yoruba in Ibadan: Nigeria; CLM: Colombian in Medellin: Colombia; MXL: Mexican Ancestry in Los Angeles: California; PEL: Peruvian in Lima: Peru; PUR: Puerto Ricans from Puerto Rico; CDX: Chinese Dai in Xishuangbanna: China; CHB: Han Chinese in Beijing: China; CHS: Southern Han Chinese: China; JPT: Japanese in Tokyo: Japan; KHV: Kinh in Ho Chi Minh City: Vietnam; Manchu: Manchu in Inner Mongolia: China; Mongolian: Mongolian in Inner Mongolia: China; YNY: Yunnan Yi: China; QHT: Qinghai Tibetan: China; CEU: Utah residents with Northern and Western European ancestry; FIN: Finnish in Finland; GBR: British in England and Scotland; IBS: Iberian populations in Spain; TSI: Toscani in Italy; BEB: Bengali in Bangladesh; GIH: Gujarati Indian in Houston: TX; ITU: Indian Telugu in the UK; PJL: Punjabi from Lahore: Pakistan; STU: Sri Lankan Tamil in the UK.
PCA and MDS analyses among 30 populations
PCA, a widely used statistical method for reducing data dimensionality, is commonly applied in population genetics to visualize genetic distances and affinities among different populations. To investigate the genetic relationships among the YNY, QHT groups and 28 reference populations, a population-level PCA was conducted. As shown in Figure 5A and B, in the population-level PCA, each point represents a population. The first and second principal components (PC1 and PC2) accounted for 47.4% and 27.3% of the total genetic variation, respectively. The results revealed a clear separation of the 30 populations into four clusters: AFR (orange), EUR (dark green), SAS (blue), and EAS (pink) populations. These four continental groups were distinct from each other, broadly corresponding to their geographic origins. In contrast, AMR populations (light green) were distributed between the EUR and SAS clusters. The plot of PC1 vs. PC3 further distinguished the AFR and SAS populations from the other populations. The two studied groups, YNY (purple) and QHT (yellow), clustered together with the EAS populations. To further explore genetic relationships among individuals from the 30 populations, an individual-level PCA was performed using genotype data. The results, shown in Figure 5C and D, represent each individual as a point. This analysis clearly differentiated individuals from AFR, EUR and EAS populations, indicating that the panel can effectively distinguish among these three continental populations. Individuals from the YNY and QHT groups overlapped with the EAS cluster, suggesting their closer genetic relationships to EAS populations than to other reference populations. The clustering patterns observed in the MDS analysis were consistent with those from the PCA [Figure 5E].

Figure 5. Population-level and individual-level PCAs. (A) Population-level PCA of YNY, QHT groups, and 28 reference populations based on PC1 and PC2; (B) Population-level PCA based on PC1 and PC3; (C) Individual-level PCA of 2,233 individuals from African, East Asian, and European populations, plus YNY and QHT groups, based on PC1 and PC2; (D) Individual-level PCA of 3,069 individuals from African, East Asian, European, American, and South Asian populations, plus YNY and QHT groups, based on PC1 and PC2; (E) MDS analysis of YNY, QHT groups, and 28 reference populations based on pairwise FST values. ACB: African Caribbean in Barbados; ASW: African Ancestry in Southwest US; ESN: Esan in Nigeria; GWD: Gambian in Western Division, The Gambia; LWK: Luhya in Webuye: Kenya; MSL: Mende in Sierra Leone; YRI: Yoruba in Ibadan: Nigeria; CLM: Colombian in Medellin: Colombia; MXL: Mexican Ancestry in Los Angeles: California; PEL: Peruvian in Lima: Peru; PUR: Puerto Ricans from Puerto Rico; CDX: Chinese Dai in Xishuangbanna: China; CHB: Han Chinese in Beijing: China; CHS: Southern Han Chinese: China; JPT: Japanese in Tokyo: Japan; KHV: Kinh in Ho Chi Minh City: Vietnam; Manchu: Manchu in Inner Mongolia: China; Mongolian: Mongolian in Inner Mongolia: China; YNY: Yunnan Yi: China; QHT: Qinghai Tibetan: China; CEU: Utah residents with Northern and Western European ancestry; FIN: Finnish in Finland; GBR: British in England and Scotland; IBS: Iberian populations in Spain; TSI: Toscani in Italy; BEB: Bengali in Bangladesh; GIH: Gujarati Indian in Houston: TX; ITU: Indian Telugu in the UK; PJL: Punjabi from Lahore: Pakistan; STU: Sri Lankan Tamil in the UK.
Phylogenetic tree construction and genetic structure analyses
Phylogenetic trees are useful for visualizing genetic distances among different populations. In this study, we constructed a rooted NJ tree and an unrooted UPGMA tree to illustrate the genetic relationships among 30 populations based on DA distances. The NJ tree [Figure 6A] separated the populations into two main clusters: one consisting of AFR populations, and the other comprising EAS, SAS, EUR, and AMR populations. Notably, the YNY and Manchu groups clustered together first, and then together with the QHT group, suggesting these groups may share a more recent common ancestor than other populations. The unrooted UPGMA tree [Figure 6B] complemented the NJ tree by further illustrating the relationships among the nodes. However, in contrast to the NJ tree, the UPGMA tree showed the YNY group in the first subbranch, followed by the Mongolian group, then the Manchu and QHT groups. Additionally, the PEL population was located between the EAS and SAS populations, rather than clustering within the AMR groups as observed in the NJ tree.
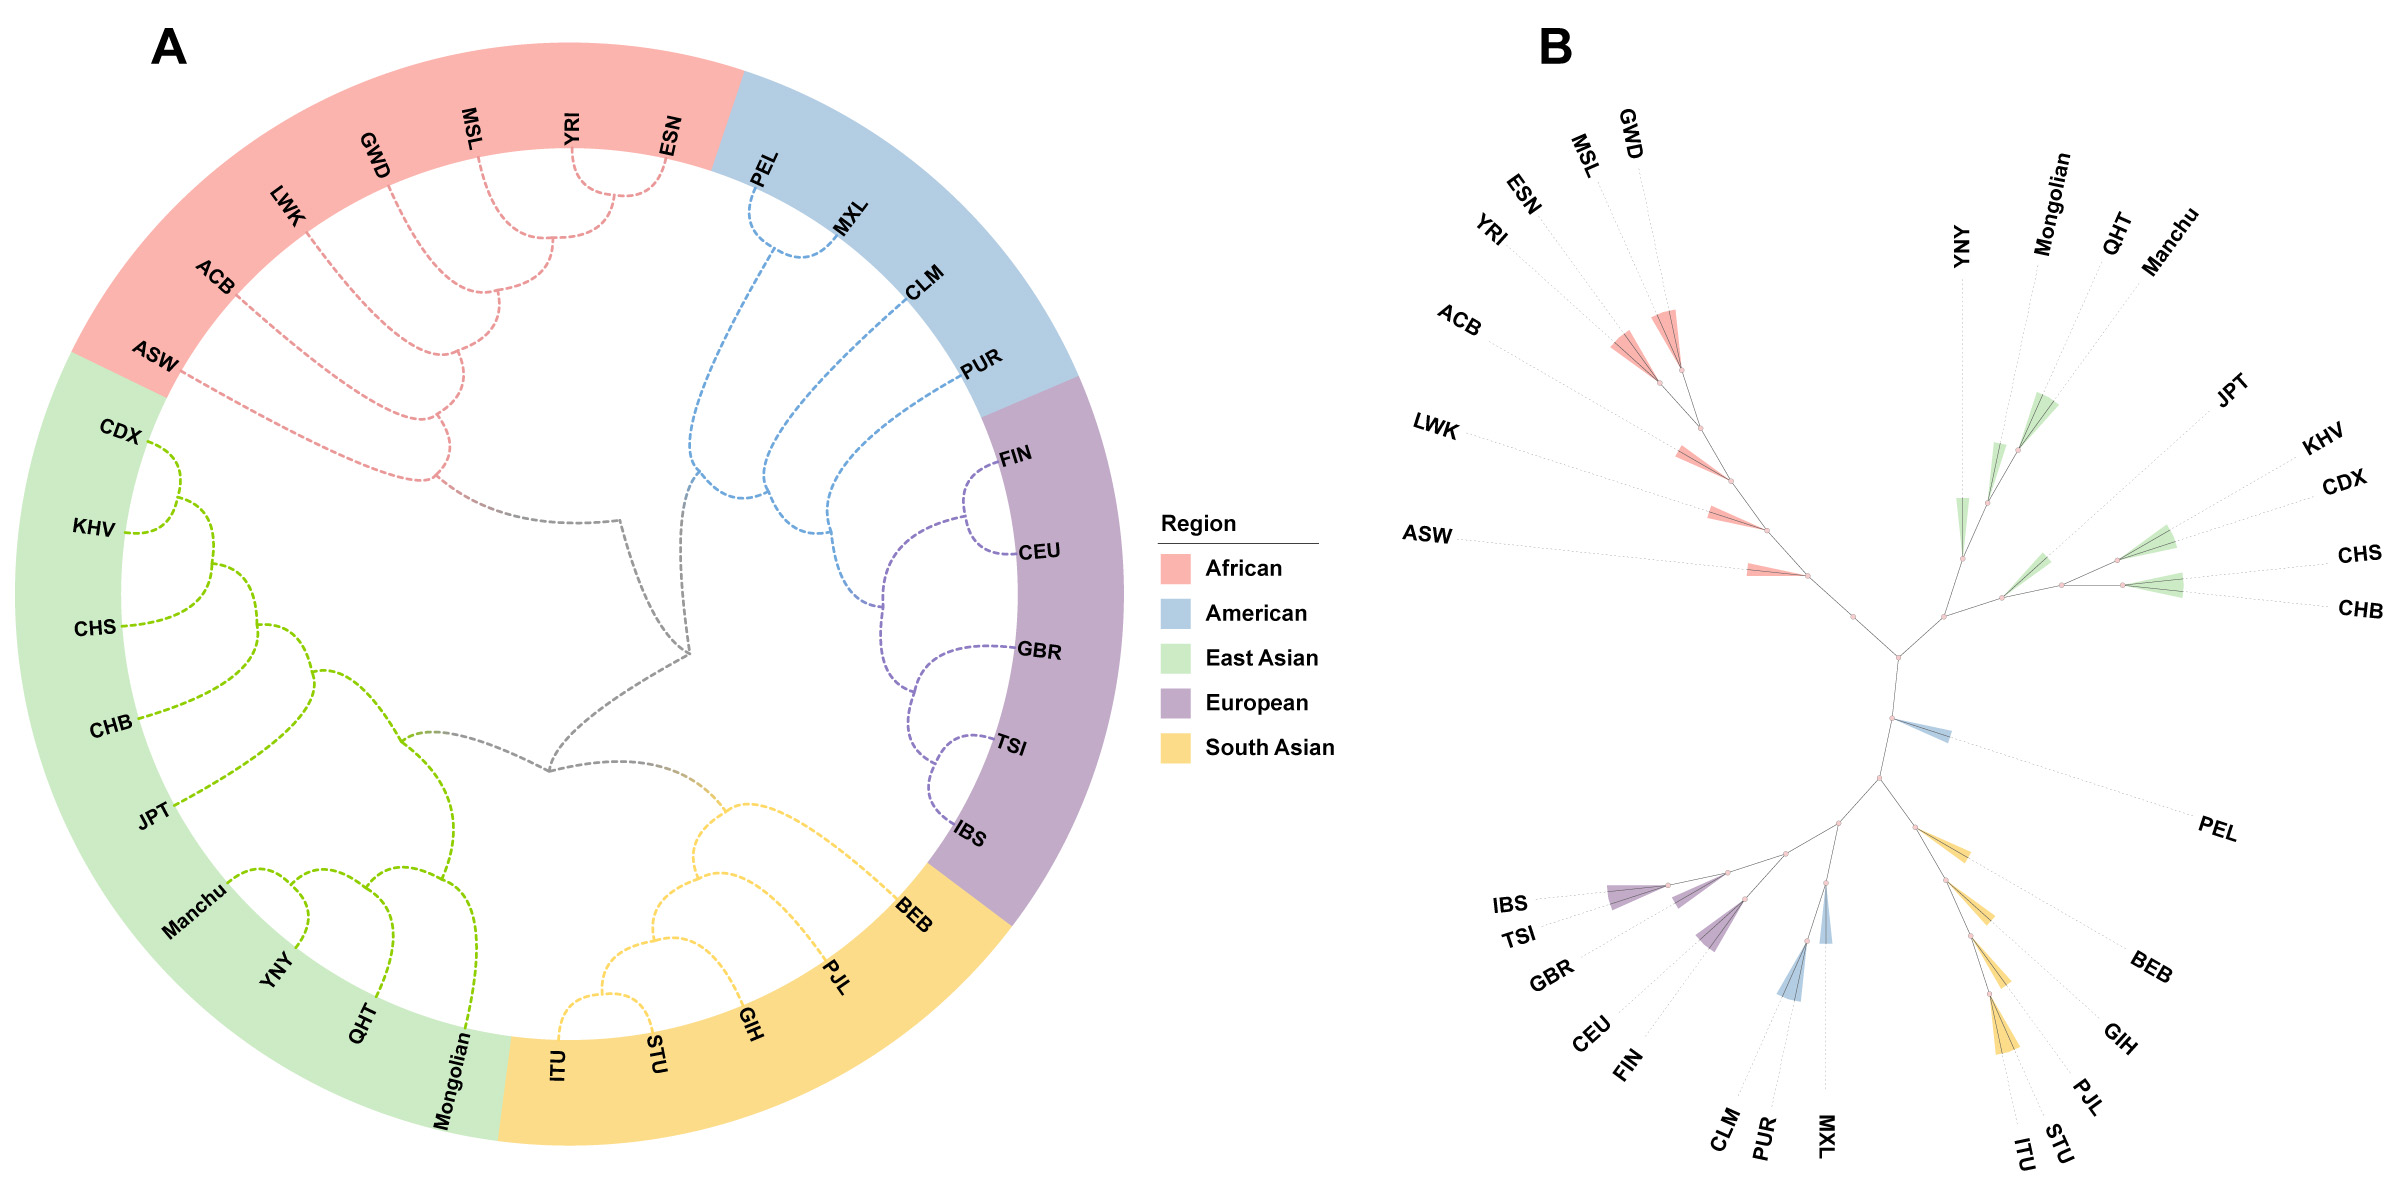
Figure 6. Phylogenetic trees of the YNY, QHT groups and 28 reference populations. (A) Rooted NJ phylogenetic tree based on pairwise DA distances among 30 populations; (B) Unrooted UPGMA tree based on pairwise DA distances among 30 populations.
STRUCTURE is a Bayesian model-based software used to infer population genetic components. In this study, we analyzed the ancestral components of the 30 populations using STRUCTURE based on raw genotype data. The optimal K value was determined to be 3 [Figure 7A]. At the individual level [Figure 7B], when K = 2, AFR populations were dominated by yellow, while other continental populations were dominated by green; when K = 3, the AFR, EAS, and EUR populations were mainly characterized by yellow, purple, and green, respectively. The AMR and SAS populations showed less distinct differentiation, exhibiting a mixture of purple and green. At the population level [Figure 7C], when K = 2, all 30 populations were broadly divided into AFR and non-AFR groups; when K = 3, the seven AFR populations and five EUR populations displayed distinct genetic structures dominated by yellow and green, respectively. The YNY and QHT groups showed similar genetic structures to the seven EAS populations, characterized by a mixture of purple, yellow, and green, with purple being predominant; when K = 4, SAS populations were distinguished from AMR populations by a unique ancestral component dominated by yellow. Notably, across K = 2 to 6, the YNY and QHT groups consistently exhibited ancestral components similar to those of the EAS populations.

Figure 7. Genetic structures of the YNY, QHY groups and 28 reference populations. (A) Relationship between the K values and ΔK; (B) Ancestral structures at the individual level for 3,069 individuals from five continental populations, as well as the YNY and QHT groups
DISCUSSION
The Multi-InDel marker, which comprises closely linked InDels, exhibits higher polymorphism than a single InDel locus and is compatible with STR typing technique[8]. It serves as an ideal complementary genetic marker for various forensic scenarios[34]. In this study, we employed a self-developed Multi-InDel panel[20] to evaluate genetic polymorphisms and forensic effectiveness in the YNY and QHT groups and to explore their genetic backgrounds.
According to the Bonferroni correction for the HWE test, all markers in the YNY and QHT groups conformed to HWE, except for the MI38 marker. In both the QHT and YNY groups, only two alleles (allele 3 and allele 4) were detected at the MI38 locus, with an unusually high frequency of homozygous genotypes. The frequency of allele 4 was particularly high (0.70 in the QHT group and 0.75 in the YNY group, respectively) resulting in a significant deviation from HWE. Therefore, the MI38 marker was excluded from subsequent analyses. The remaining 40 Multi-InDel markers in the panel showed conformity to HWE and pairwise linkage equilibrium in both groups, enabling the use of the product rule for further analyses. Except for the MI26 and 2MI16 markers, all other markers contained three or four alleles in both groups, resulting in lower diversity for these two loci. Specifically, in the YNY group, the PIC values for MI26 and 2MI26 were 0.3313 and 0.3629, respectively, both below the average value of 0.5343 for the 40 Multi-InDel markers; in the QHT group, the PIC values for MI26 and 2MI16 were 0.3206 and 0.3495, respectively, also below the mean value of 0.5243 for the 40 Multi-InDel markers. Nevertheless, the average PIC and Hobs values of the Multi-InDel panel exceeded 0.52 and 0.59 in both groups, indicating that the panel possesses a relatively high level of polymorphism in these populations.
Compared with the 39 DIP panel and 43 DIP system used in previous studies[35,36], this Multi-InDel panel demonstrated lower CPM values (YNY: 2.28 × 10⁻²⁶; QHT: 5.64 × 10⁻²⁶) and higher CPE values (YNY: 0.9999995429; QHT: 0.9999984549), indicating that it is suitable for forensic individual identification and paternity testing in these groups. Furthermore, in the two studied groups and seven EAS reference populations, the panel showed strong performance in full sibling identification. When LR thresholds were set at 1, 10, 100, 1,000, and 10,000, the average accuracies of full sibling identification in the above nine populations were 98.89%, 96.48%, 90.47%, 78.82%, and 61.83%, respectively. However, it is important to note that these thresholds may be associated with potential false-positive rates.
The average Ae values were 2.60 and 2.53 in the YNY and QHT groups, respectively, confirming the panel’s effectiveness in deconvoluting mixed samples. Since each marker consists of two closely linked InDels within 50 bp, the Ae values were less than 3. However, we anticipate that by selecting markers with longer physical distances (e.g., 200 bp) and incorporating additional InDel loci, the Ae values could be further increased.
In the population genetic analyses, we evaluated In values, allele frequencies, pairwise FST values and DA distances, and performed PCA and MDS. For the YNY and QHT groups, the highest FST values and DA distances were consistently observed when compared to AFR reference populations, while the lowest values were seen with EAS populations. These findings suggested that the YNY and QHT groups were genetically more distant from AFR populations and more closely related to EAS populations. This pattern was consistent with the higher number of loci having In values greater than 0.1 when comparing AFR populations to the two studied groups, and fewer such loci when comparing EAS populations. Additionally, PCA and MDS analyses revealed that the YNY and QHT groups clustered closely with EAS populations. PCA results showed that the Multi-InDel panel could effectively differentiate the five intercontinental populations into four clusters at the PC1 and PC2 levels, although AMR and SAS populations were not clearly separated. However, at the PC1 and PC3 levels, these two populations were better distinguished. This indicates that the panel has potential utility in inferring ancestry and classifying populations into geographically consistent clusters at the continental level. The MDS results were largely consistent with those of PCA.
We further explored genetic relationships among 30 populations through phylogenetic tree analyses. Although the NJ and UPGMA phylogenetic trees produced broadly similar results, slight differences were observed. In the UPGMA tree based on DA distance, the PEL population formed a main branch, while in the NJ tree, which accounts for evolutionary rates and genetic drift, PEL clustered with MXL in an outer branch, suggesting a close genetic relationship between these two populations. This indicates that the NJ tree might better infer ancestry information. In the STRUCTURE analysis, when the K values were set from 2 to 6, the genetic compositions of the YNY and QHT groups were similar to those of the EAS reference populations, reflecting shared genetic backgrounds. At K = 3, the ancestral components of AFR, EAS and EUR populations were clearly distinguished, suggesting that this Multi-InDel panel could also serve as an auxiliary tool for inferring the origins of these major continental groups.
The YNY and QHT groups are two important ethnic groups in southwest and northwest China, respectively, belonging to different language families: YNY to Sino-Tibetan and QHT to Tibetan-Burman. Several studies have investigated the genetic backgrounds of these groups using various markers[37-39]. These studies consistently show the strong correlation between their genetic clustering and their geographic and linguistic divisions. Fei proposed the concept of the “Tibetan-Yi corridor”, viewing it as a historically shaped ethnic region[40], which serves as a crossroad facilitating interactions among the Han, Tibetan, and Yi groups[41]. Migration and mobility have played critical roles in the history of these groups within this corridor[42]. The historical southward migration of Tibetans and the northward expansion of the Yis during the mid-Qing dynasty, especially following the Qing invasion of Liangshan Yi territory, led to significant mixing. Many Liangshan Yis migrated north or northwest and eventually settled in Muli Tibetan Autonomous County, Liangshan Prefecture, Sichuan province. Yao et al. revealed that populations in this corridor share mixed genetic contributions from Tibetans and lowland East Asians[43]. This genetic admixture helps explain the closer relationships of the YNY, QHT groups with EAS populations in our analyses.
Although this Multi-InDel panel shows great promise for forensic applications, three key limitations should be considered. First, the relatively small sample sizes of the YNY and QHT groups may not fully capture their genetic diversities; larger sample sizes are needed to validate these findings. Second, as the MI38 marker deviated from HWE in the two studied groups, it was excluded from the analyses. In future, other markers with high polymorphism should be included to replace the MI38 marker. Third, due to the complex genetic backgrounds of the YNY and QHT groups, incorporating additional neighboring reference populations in future analyses would provide more insights into their genetic structures.
CONCLUSION
In this study, 92 unrelated YNY individuals and 173 unrelated QHT individuals were genotyped using a self-developed Multi-InDel panel. The results demonstrated that these 40 Multi-InDel markers showed high polymorphisms in two studied groups. The panel proved to be a reliable tool for various forensic applications in these populations, including individual identification, paternity testing, and full sibling identification. Furthermore, population genetic analyses revealed that the YNY and QHT groups are genetically closely related to East Asian reference populations. Additionally, the panel demonstrated potential for distinguishing among East Asian, European, and African populations, highlighting its value for ancestry inference in unknown individuals.
DECLARATIONS
Acknowledgments
The authors express their deepest gratitude to the volunteers who provided samples for the study.
Authors’ contributions
Made substantial contributions to the conception and design of the study: Zhu B
Performed the experiments, data analysis, and interpretation, and prepared the draft manuscript: Wu X
Participated in DNA extraction and PCR amplification: Bai X
Supervised the experiments and revised the manuscript: Lei F, Lan Q
Assisted with data analysis and manuscript revision: Liu Q, Liang Q, Luo L
Funded the study and revised the manuscript: Shen C
Collected samples: Yao H
Availability of data and materials
The datasets used during the current study are available from the corresponding author upon reasonable request.
Financial support and sponsorship
This work was supported by the National Natural Science Foundation of China (No. 82471917 and No. 82302123) and funded by the Guangdong Provincial Science and Technology Program (2024A1111120006).
Conflicts of interest
Zhu B is a Section Editor of Journal of Translational Genetics and Genomics. Zhu B is also a Guest Editor for the Special Issue Molecular Innovation in Forensic Genetics. Zhu B was not involved in any steps of the editorial processing, notably including reviewer selection, manuscript handling, or decision making, while the other authors have declared that they have no conflicts of interest.
Ethical approval and consent to participate
This research was conducted in accordance with the ethical principles outlined in the World Medical Association Declaration of Helsinki and was approved by the Ethics Committees of Southern Medical University and Xi’an Jiaotong University (No. 2019-1039). All volunteers provided written informed consent prior to sample collection.
Consent for publication
Not applicable.
Copyright
© The Author(s) 2025.
Supplementary Materials
REFERENCES
1. Holmes AS, Roman MG, Hughes-Stamm S. In-field collection and preservation of decomposing human tissues to facilitate rapid purification and STR typing. Forensic Sci Int Genet. 2018;36:124-9.
2. Santos NBPD, de Paula Filho MFF, Silva AMDS, et al. Allele frequencies and forensic data of 25 STR markers for individuals in Northeast Brazil. Genes. 2023;14:1185.
3. Chen M, Zhang J, Zhao J, et al. Comparison of CE- and MPS-based analyses of forensic markers in a single cell after whole genome amplification. Forensic Sci Int Genet. 2020;45:102211.
4. Pereira R, Phillips C, Pinto N, et al. Straightforward inference of ancestry and admixture proportions through ancestry-informative insertion deletion multiplexing. PLoS One. 2012;7:e29684.
5. Wang M, Du W, Tang R, et al. Genomic history and forensic characteristics of Sherpa highlanders on the Tibetan Plateau inferred from high-resolution InDel panel and genome-wide SNPs. Forensic Sci Int Genet. 2022;56:102633.
6. Kidd KK, Speed WC, Pakstis AJ, et al. Evaluating 130 microhaplotypes across a global set of 83 populations. Forensic Sci Int Genet. 2017;29:29-37.
7. Kidd KK, Speed WC. Criteria for selecting microhaplotypes: mixture detection and deconvolution. Investig Genet. 2015;6:1.
8. Huang J, Luo H, Wei W, Hou Y. A novel method for the analysis of 20 multi-Indel polymorphisms and its forensic application. Electrophoresis. 2014;35:487-93.
9. Fan G, Ye Y, Luo H, Hou Y. Use of multi-InDels as novel markers to analyze 13 X-chromosome haplotype loci for forensic purposes. Electrophoresis. 2015;36:2931-8.
10. Liu J, Zhang X, Zhang X, et al. A new set of 20 multi-InDel markers for forensic application. Electrophoresis. 2022;43:1193-202.
11. Sun K, Ye Y, Luo T, Hou Y. Multi-InDel analysis for ancestry inference of sub-populations in China. Sci Rep. 2016;6:39797.
12. Yao Y, Sun K, Yang Q, et al. Development of a multiplex panel with 31 multi-allelic InDels for forensic DNA typing. Int J Legal Med. 2023;137:1-12.
13. Fan GY, Ye Y, Hou YP. Detecting a hierarchical genetic population structure via Multi-InDel markers on the X chromosome. Sci Rep. 2016;6:32178.
14. Qu S, Lv M, Xue J, et al. Multi-indel: a microhaplotype marker can be typed using capillary electrophoresis platforms. Front Genet. 2020;11:567082.
15. Wang F, Song F, Song M, Li J, Xie M, Hou Y. Genetic reconstruction and phylogenetic analysis by 193 Y-SNPs and 27 Y-STRs in a Chinese Yi ethnic group. Electrophoresis. 2021;42:1480-7.
16. Liu Y, Cui W, Jin X, et al. Forensic efficiency estimation of a homemade six-color fluorescence multiplex panel and in-depth anatomy of the population genetic architecture in two Tibetan groups. Front Genet. 2022;13:880346.
17. Chen M, Lan Q, Nie S, et al. Forensic efficiencies of individual identification, kinship testing and ancestral inference in three Yunnan groups based on a self-developed multiple DIP panel. Front Genet. 2022;13:1057231.
18. Jian H, Wang L, Wang H, Bai X, Lv M, Liang W. Population genetic analysis of 30 insertion-deletion (INDEL) loci in a Qinghai Tibetan group using the Investigator DIPplex kit. Int J Legal Med. 2019;133:1039-41.
19. Cui W, Chen M, Yao H, et al. Forensic characterization and genetic portrait of the Gannan Tibetan ethnic group via 165 AI-SNP loci. Front Biosci. 2023;28:114.
20. Lan Q, Cai M, Lei F, Shen C, Zhu B. Systematically exploring the performance of a self-developed multi-InDel system in forensic identification, ancestry inference and genetic structure analysis of Chinese Manchu and Mongolian groups. Forensic Sci Int. 2023;346:111637.
21. Mei S, Yi S, Cai M, et al. Exploring the forensic effectiveness and population genetic differentiation by self-constructed 41 multi-InDel panel in Yunnan Zhuang group. Gene. 2023;860:147180.
22. Stephens M, Smith NJ, Donnelly P. A new statistical method for haplotype reconstruction from population data. Am J Hum Genet. 2001;68:978-89.
23. Gouy A, Zieger M. STRAF-A convenient online tool for STR data evaluation in forensic genetics. Forensic Sci Int Genet. 2017;30:148-51.
24. Kling D, Tillmar AO, Egeland T. Familias 3 - extensions and new functionality. Forensic Sci Int Genet. 2014;13:121-7.
25. Rosenberg NA, Li LM, Ward R, Pritchard JK. Informativeness of genetic markers for inference of ancestry. Am J Hum Genet. 2003;73:1402-22.
26. Excoffier L, Lischer HE. Arlequin suite ver 3.5: a new series of programs to perform population genetics analyses under Linux and Windows. Mol Ecol Resour. 2010;10:564-7.
27. Nei M, Tajima F, Tateno Y. Accuracy of estimated phylogenetic trees from molecular data. II. Gene frequency data. J Mol Evol. 1983;19:153-70.
28. George D, Mallery P. IBM SPSS statistics 29 step by step: a simple guide and reference. New York: Routledge; 2024.
29. Kumar S, Stecher G, Tamura K. MEGA7: molecular evolutionary genetics analysis version 7.0 for bigger datasets. Mol Biol Evol. 2016;33:1870-4.
30. Pritchard JK, Stephens M, Donnelly P. Inference of population structure using multilocus genotype data. Genetics. 2000;155:945-59.
31. Jakobsson M, Rosenberg NA. CLUMPP: a cluster matching and permutation program for dealing with label switching and multimodality in analysis of population structure. Bioinformatics. 2007;23:1801-6.
32. Rosenberg NA. Distruct: a program for the graphical display of population structure. Mol Ecol Notes. 2004;4:137-8.
33. Yuan X, Wang X, Lan Q, et al. Using two self-developed InDel panels to explore forensic traits and ancestral components in the Hui group. Genomics. 2024;116:110756.
34. Liu J, Hao T, Cheng X, et al. DIP-microhaplotypes: new markers for detection of unbalanced DNA mixtures. Int J Legal Med. 2021;135:13-21.
35. Jin XY, Shen CM, Chen C, et al. Ancestry informative DIP loci for dissecting genetic structure and ancestry proportions of Qinghai Tibetan and Tibet Tibetan groups. Mol Biol Rep. 2020;47:1079-87.
36. Zhao M, Cui W, Xu H, Zhang Y, Zhu B. Unveiling the genetic landscape of high-altitude adaptive ethnic groups with polymorphic markers: implications of comprehensive forensic appraisals and population genetic investigations. Heliyon. 2023;9:e21229.
37. Guo Y, Shen C, Meng H, et al. Population differentiations and phylogenetic analysis of Tibet and Qinghai Tibetan groups based on 30 indel loci. DNA Cell Biol. 2016;35:787-94.
38. Li L, Ye Y, Song F, Wang Z, Hou Y. Genetic structure and forensic parameters of 30 InDels for human identification purposes in 10 Tibetan populations of China. Forensic Sci Int Genet. 2019;40:e219-27.
39. Zhang YD, Shen CM, Jin R, et al. Forensic evaluation and population genetic study of 30 insertion/deletion polymorphisms in a Chinese Yi group. Electrophoresis. 2015;36:1196-201.
40. Li S. Fei Xiaotong's theory on the corridor of the Tibet-Yi minority. Journal of Xizang Minzu University. 2006. Available from: https://kns.cnki.net/nzkhtml/xmlRead/xml.html?pageType=web&fileName=XZMZ200601000&tableName=CJFDTOTAL&dbCode=CJFD&fileSourceType=1&appId=KNS_BASIC_PSMC&invoice=ZRprB/Q1/qvTSFE5kF+5CV2ekMBbhLFcD7X7v5SpP2VkS8VH3avggmSp5B4WIqPNboZsmj+qLP6lkvmCJwUz+s8vEwhsuxej1slg7zJUOyBkFOQOTMJbNC7idSGkquo7bkVkz2Ek/X1Cgjw08EcwQXCuasvhx15TD1khvPU4iG0= [Last accessed on 21 Jul 2025]
41. Shi S. Ethnic flows in the Tibetan-Yi corridor throughout history. Int J Anthropol Ethnol. 2018;2:9.
42. Zhang Z, Zhang Y, Wang Y, et al. The Tibetan-Yi region is both a corridor and a barrier for human gene flow. Cell Rep. 2022;39:110720.
Cite This Article
How to Cite
Download Citation
Export Citation File:
Type of Import
Tips on Downloading Citation
Citation Manager File Format
Type of Import
Direct Import: When the Direct Import option is selected (the default state), a dialogue box will give you the option to Save or Open the downloaded citation data. Choosing Open will either launch your citation manager or give you a choice of applications with which to use the metadata. The Save option saves the file locally for later use.
Indirect Import: When the Indirect Import option is selected, the metadata is displayed and may be copied and pasted as needed.
About This Article
Special Issue
Copyright

Data & Comments
Data
0


Comments
Comments must be written in English. Spam, offensive content, impersonation, and private information will not be permitted. If any comment is reported and identified as inappropriate content by OAE staff, the comment will be removed without notice. If you have any queries or need any help, please contact us at support@oaepublish.com.