


fig2
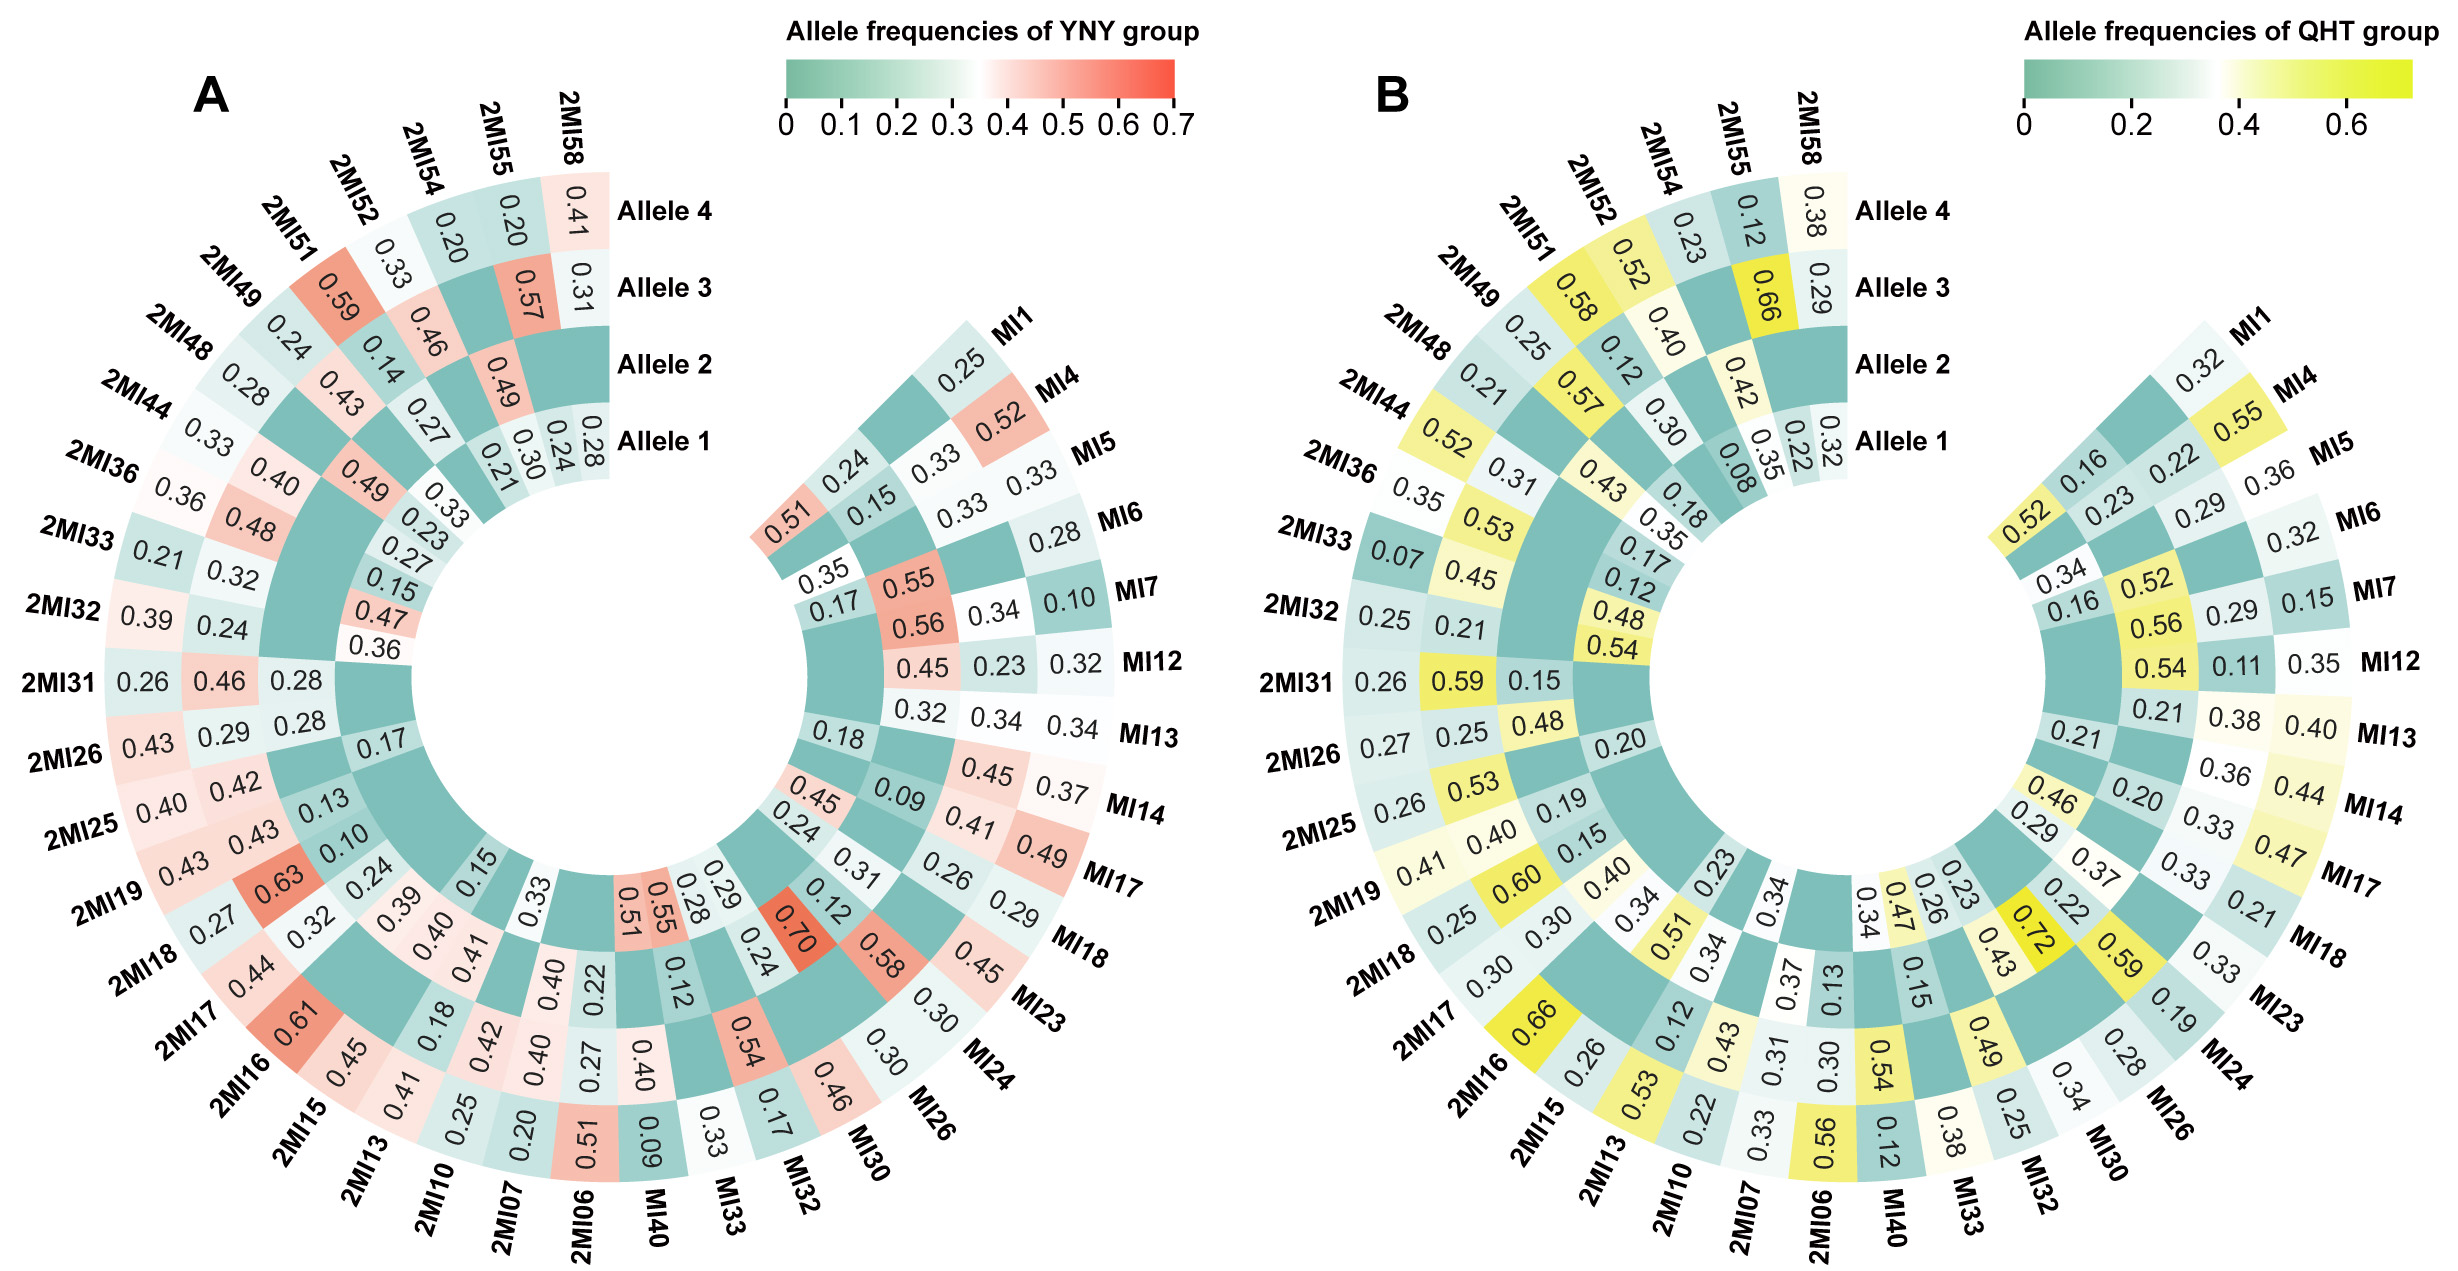
Figure 2. Heatmaps of allele frequencies for the 40 Multi-InDel markers in the YNY and QHT groups. (A) Heatmap of allele frequencies in the YNY group, with a color gradient ranging from green to red indicating low to high values; (B) Heatmap of allele frequencies in the QHT group, with a color gradient ranging from green to yellow indicating low to high values.


