


fig3
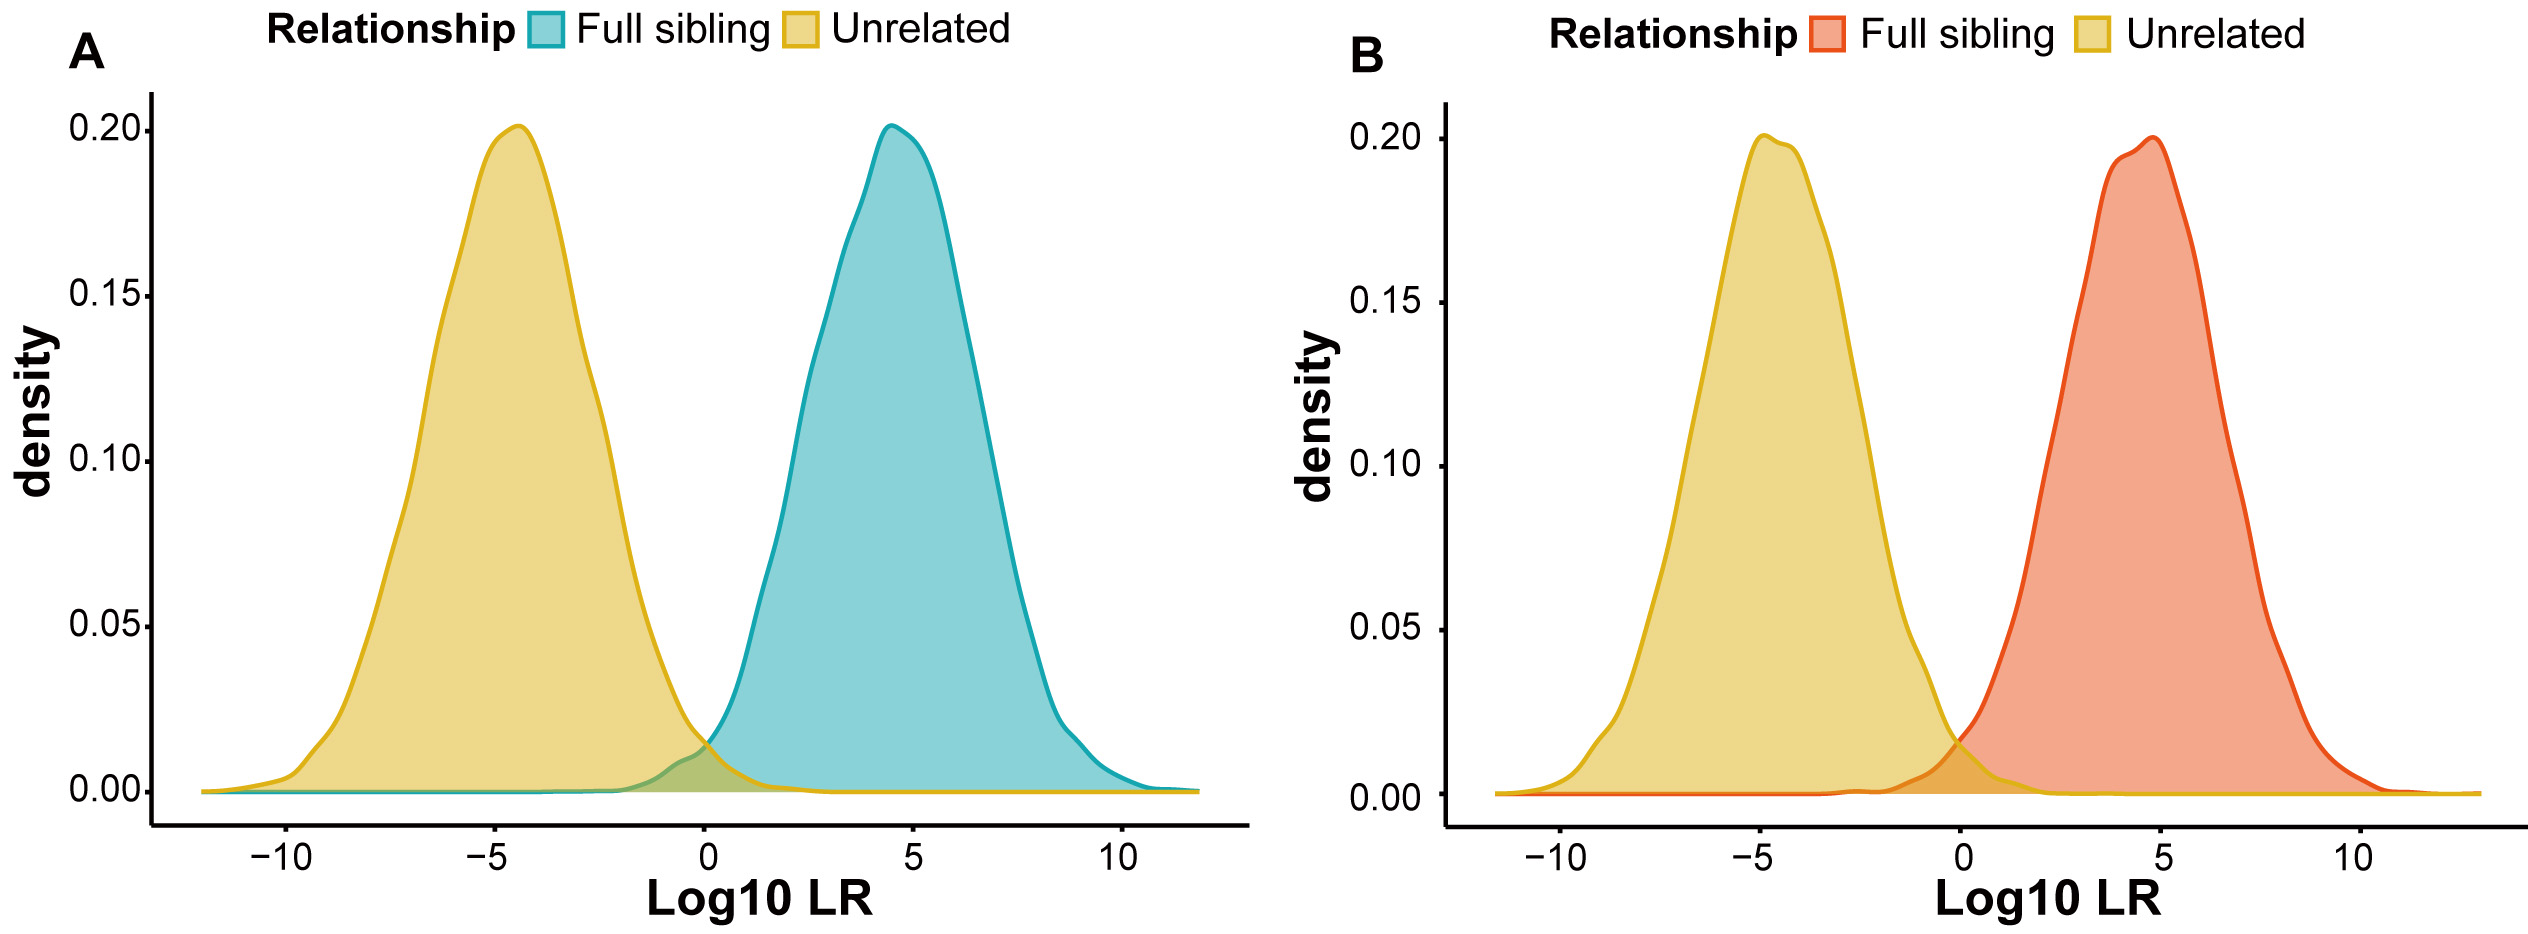
Figure 3. Log10 LR density distribution curves. (A) Simulated full sibling and unrelated pairs in the YNY group; (B) Simulated full sibling and unrelated pairs in the QHT group. Yellow indicates 10,000 simulated unrelated pairs, blue indicates 10,000 simulated full sibling pairs in the YNY group, and orange indicates 10,000 simulated full sibling pairs in the QHT group.


