



fig6
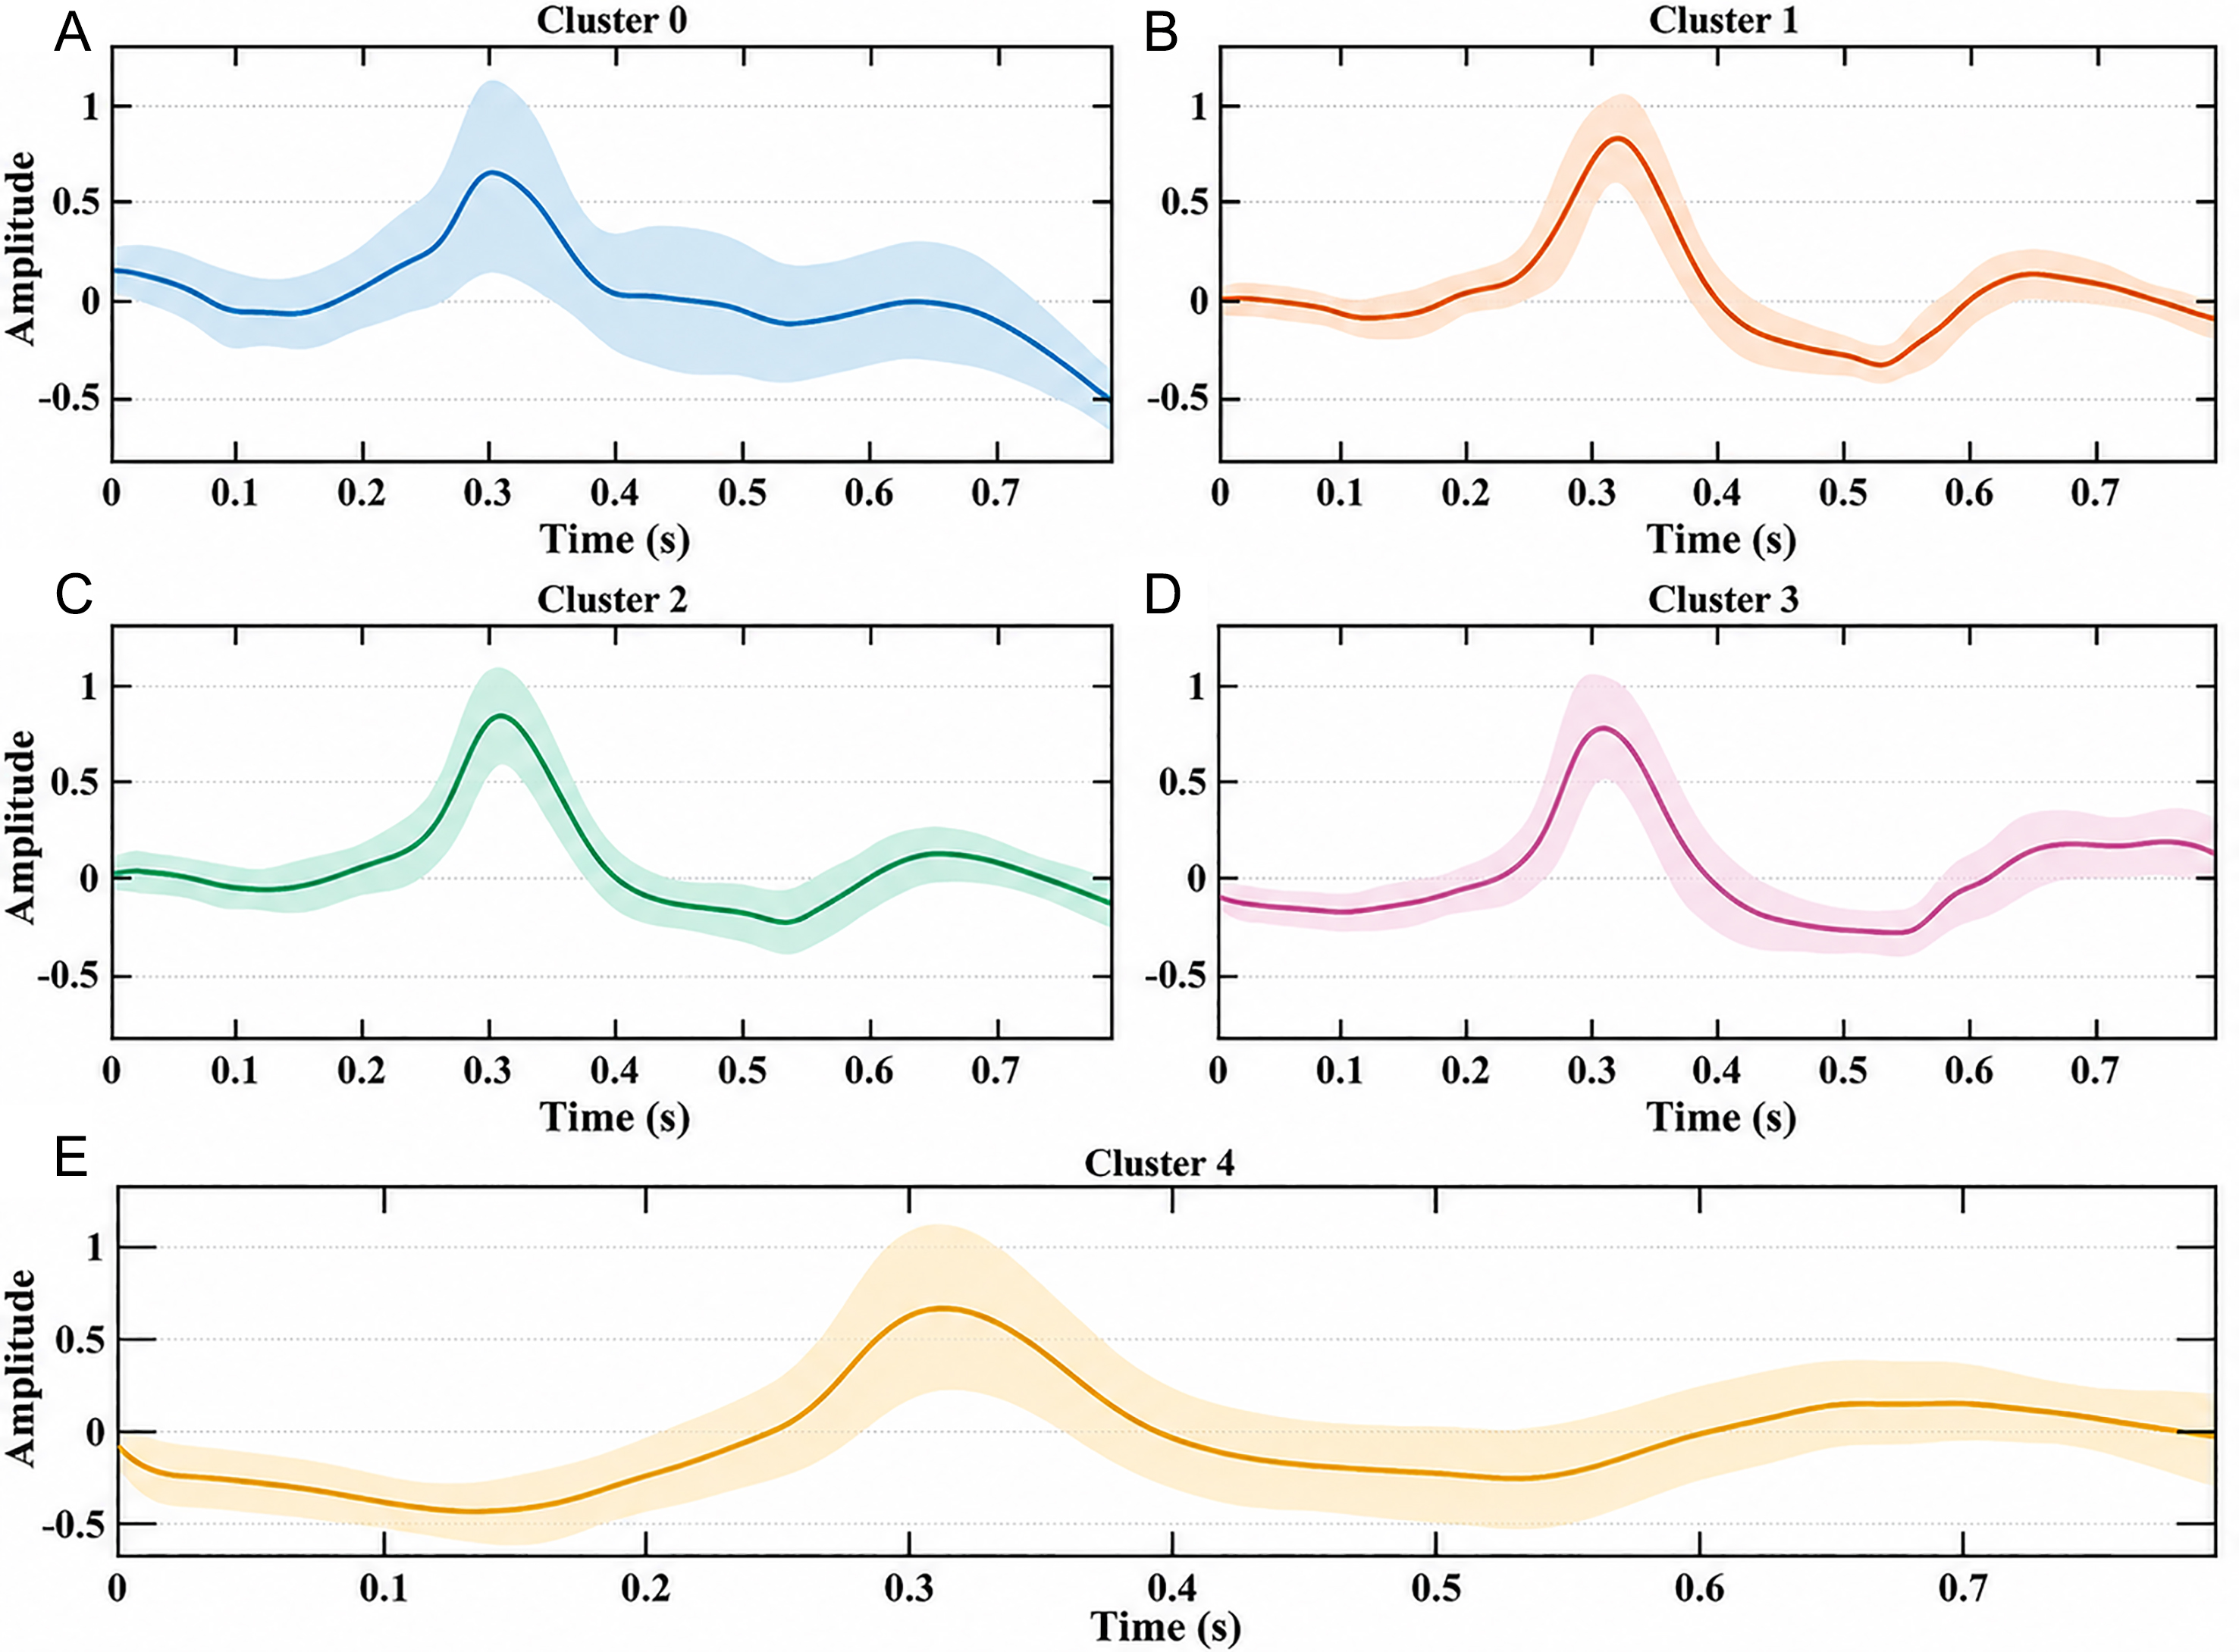
Figure 6. ICG waveform morphology of the HeartCycle dataset under the K = 5 clustering scheme. A total of N = 1,908 valid ICG beat segments are included. (A-E) correspond to Cluster 0-4, with sample sizes of n = 297, 340, 526, 612, and 133, respectively. The solid line represents the mean normalized ICG waveform of each cluster, and the shaded region indicates the mean ± SD.




