



fig19
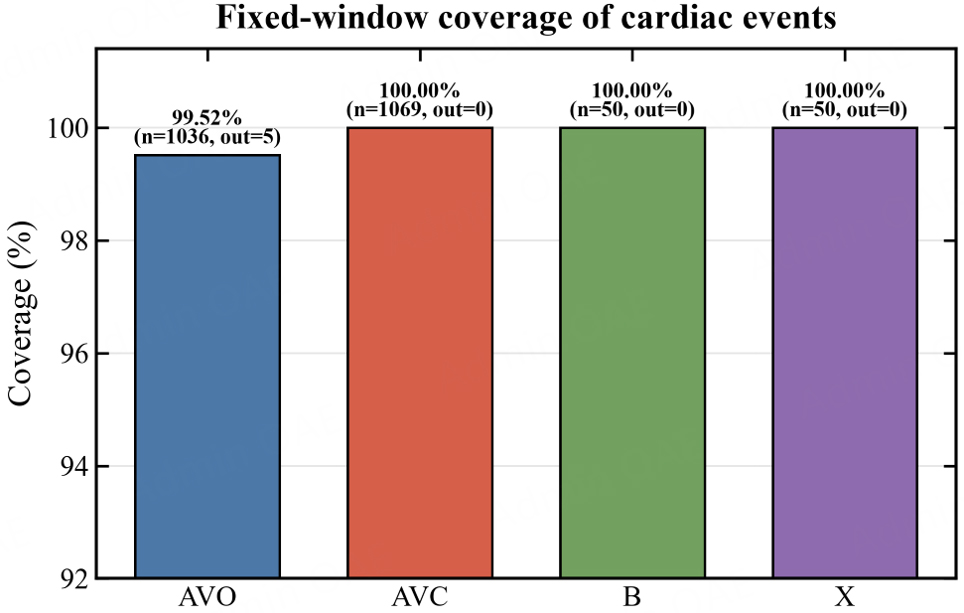
Figure 19. Coverage of AVO, AVC, and B/X events within the fixed temporal window. The sample sizes are n = 1,036 for AVO, n = 1,069 for AVC, n = 50 for B points, and n = 50 for X points. The bars or annotated values indicate the proportion of events falling within the fixed time window from 0.20 s before to 0.80 s after the R peak.




