


fig16

Morphological analysis and multimodal deep learning for impedance cardiography feature localization and hemodynamic parameter estimation

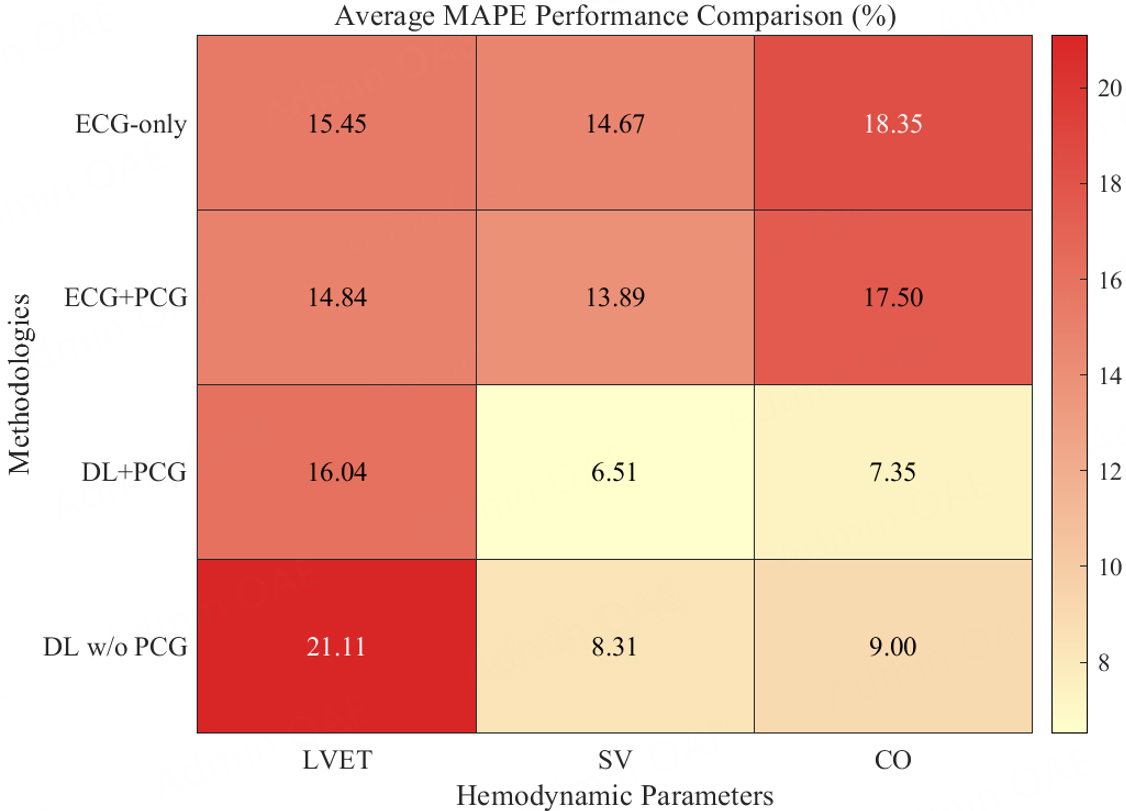
Figure 16. Heatmap of mean MAPE values for LVET, SV, and CO across the four experimental groups. Statistics for the conventional rule-based methods are based on n = 92 valid test beats, whereas statistics for the deep learning methods are based on n = 61 valid test beats. Color indicates the mean MAPE (%) of each method for the corresponding metric.


The Journal of Cardiovascular Aging

Portico

All published articles are preserved here permanently:

https://www.portico.org/publishers/oae/

Portico

All published articles are preserved here permanently:

https://www.portico.org/publishers/oae/

