



fig14
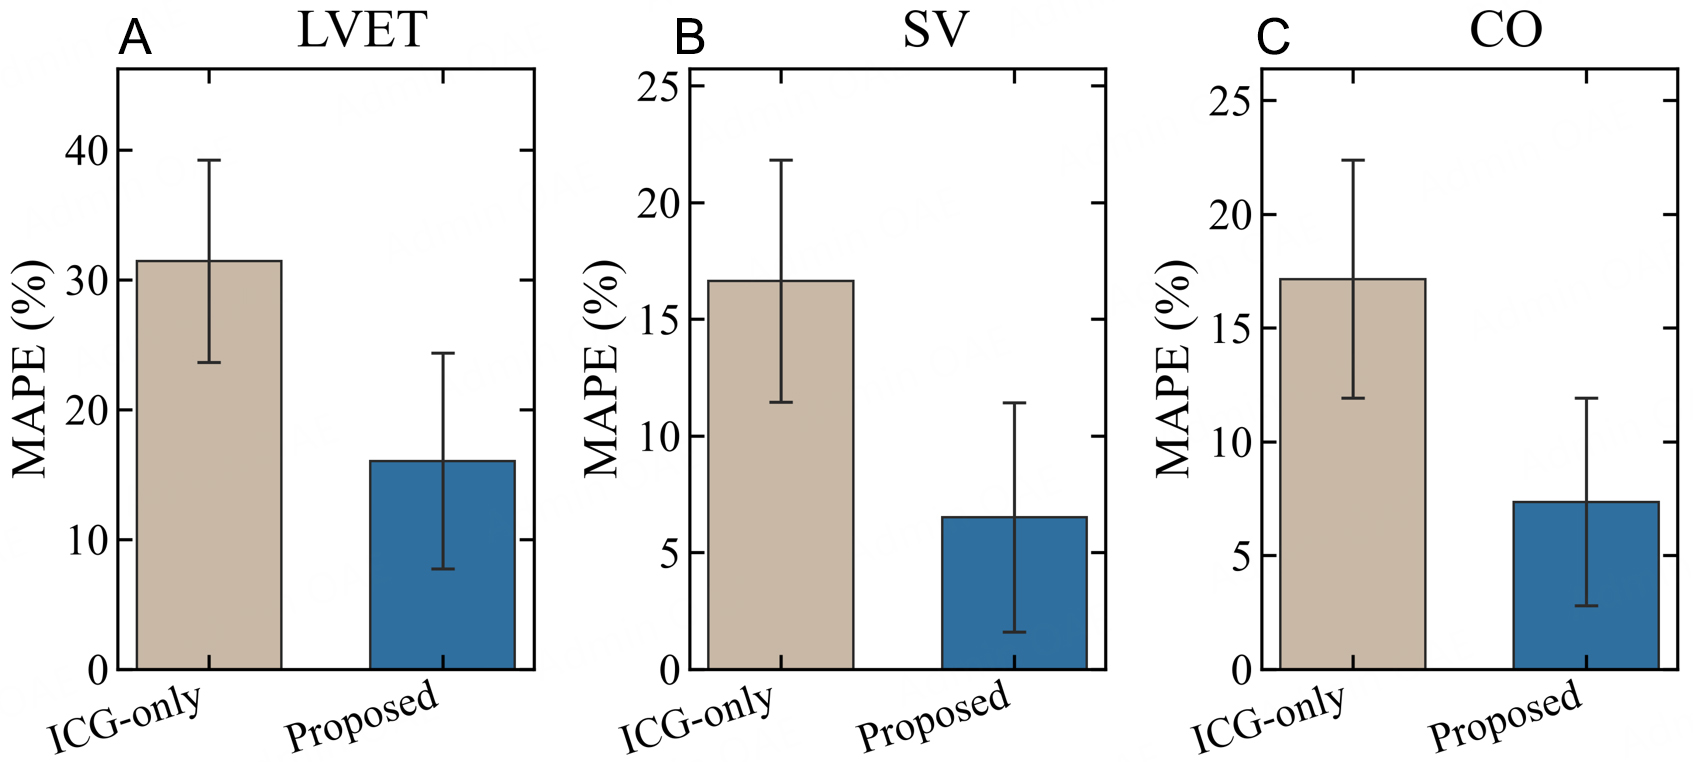
Figure 14. Comparison of MAPE values for beat-level hemodynamic parameter estimation between the single-channel ICG-only model and the proposed model. (A-C) correspond to LVET, SV, and CO, respectively. The bar height represents the mean MAPE calculated from n = 61 valid test beats, and the error bars indicate mean ± SD.




