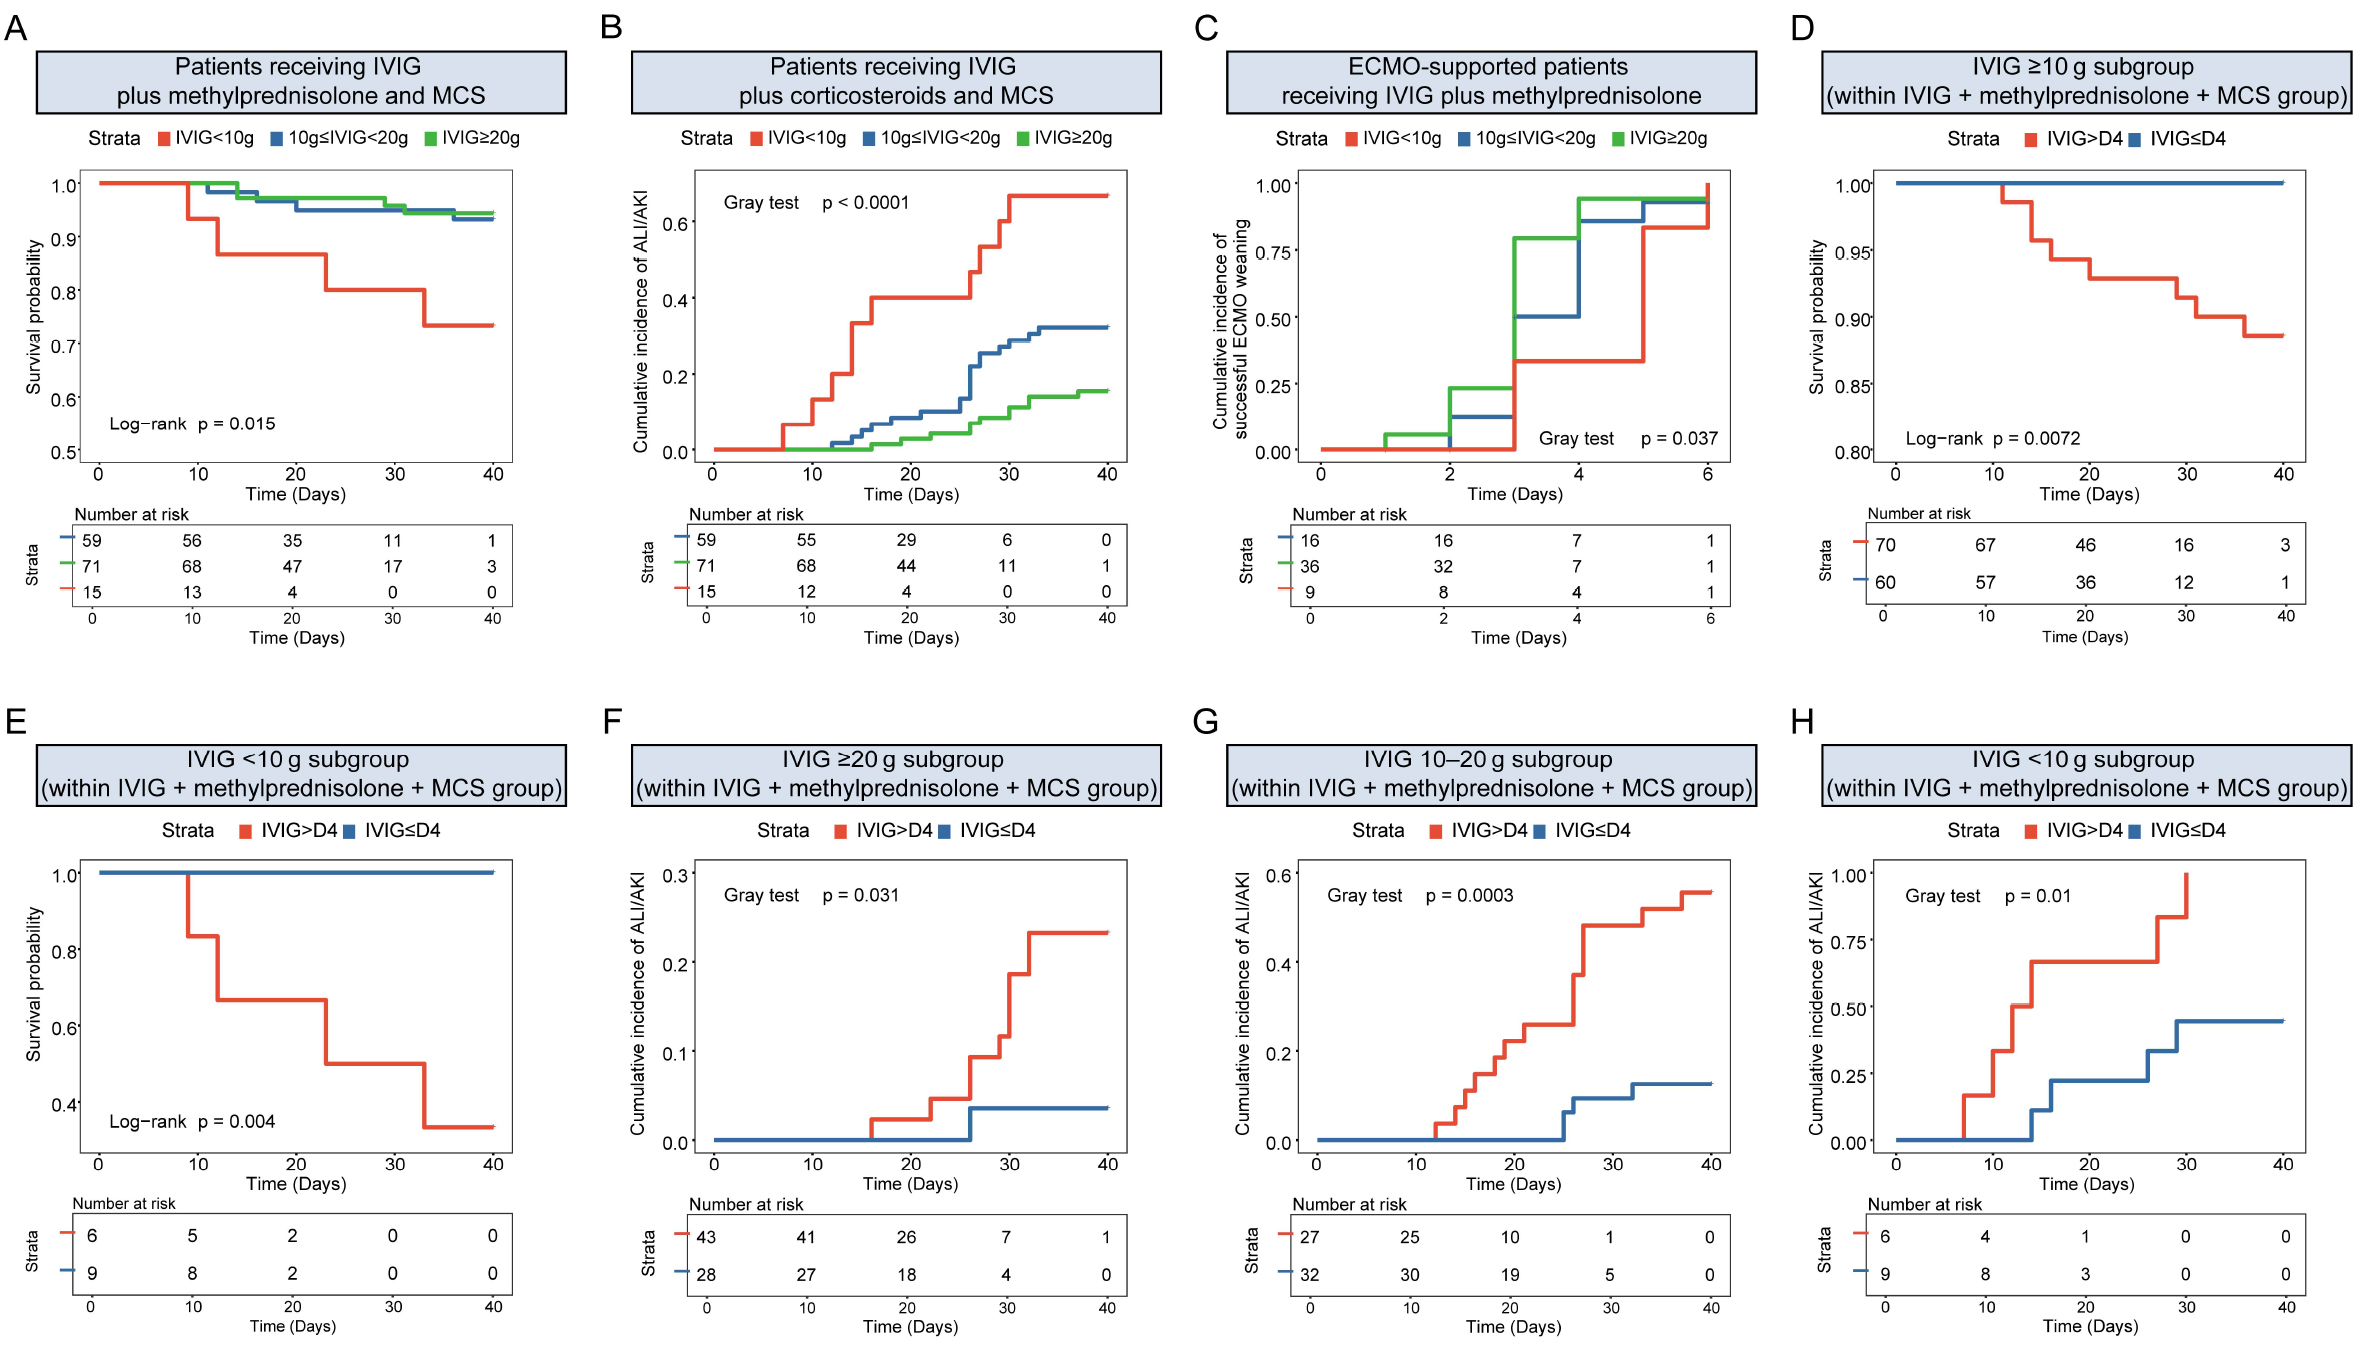
Figure 3. Exploratory dose- and timing-stratified outcomes among IVIG-treated patients. (A) Kaplan-Meier survival curves among patients who received IVIG plus methylprednisolone and MCS, stratified by cumulative IVIG dose (< 10 g, n = 15; 10 to < 20 g, n = 59; ≥ 20 g, n = 71). (B) Aalen-Johansen cumulative incidence of ALI/AKI in the same MCS-treated dose groups. (C) Aalen-Johansen cumulative incidence of successful ECMO weaning with survival to discharge among ECMO-supported patients receiving IVIG plus methylprednisolone, stratified by cumulative IVIG dose (< 10 g, n = 9; 10 to < 20 g, n = 16; ≥ 20 g, n = 36). (D) Kaplan-Meier survival curves in the ≥ 10 g subgroup, stratified by IVIG initiation within 4 days of admission versus later initiation (≤ 4 days, n = 60; > 4 days, n = 70). (E) Kaplan-Meier survival curves in the < 10 g subgroup, stratified by treatment timing (≤ 4 days, n = 9; > 4 days, n = 6). (F) Aalen-Johansen cumulative incidence of ALI/AKI in the ≥ 20 g subgroup, stratified by treatment timing (≤ 4 days, n = 28; > 4 days, n = 43). (G) Aalen-Johansen cumulative incidence of ALI/AKI in the 10 to < 20 g subgroup, stratified by treatment timing (≤ 4 days, n = 32; > 4 days, n = 27). (H) Aalen-Johansen cumulative incidence of ALI/AKI in the < 10 g subgroup, stratified by treatment timing (≤ 4 days, n = 9; > 4 days, n = 6). (D-H) were restricted to patients receiving IVIG plus methylprednisolone and MCS. For the timing-stratified survival analyses in (D and E), cumulative IVIG dose was displayed as < 10 g versus ≥ 10 g, whereas the original three dose categories were retained for the ALI/AKI analyses in (F-H). Day 4 was measured from hospital admission. For ALI/AKI cumulative-incidence analyses, in-hospital death before ALI/AKI and discharge alive without prior ALI/AKI were treated as competing events. For (C), death before qualifying for successful ECMO weaning was treated as a competing event. Displayed P values are from log-rank tests for ( A, D, and E) and Gray's tests for (B, C, and F-H). Patients discharged alive in the Kaplan-Meier analyses were censored on their actual discharge dates, and the displayed numbers at risk were generated directly from the corresponding survival objects.