


fig11
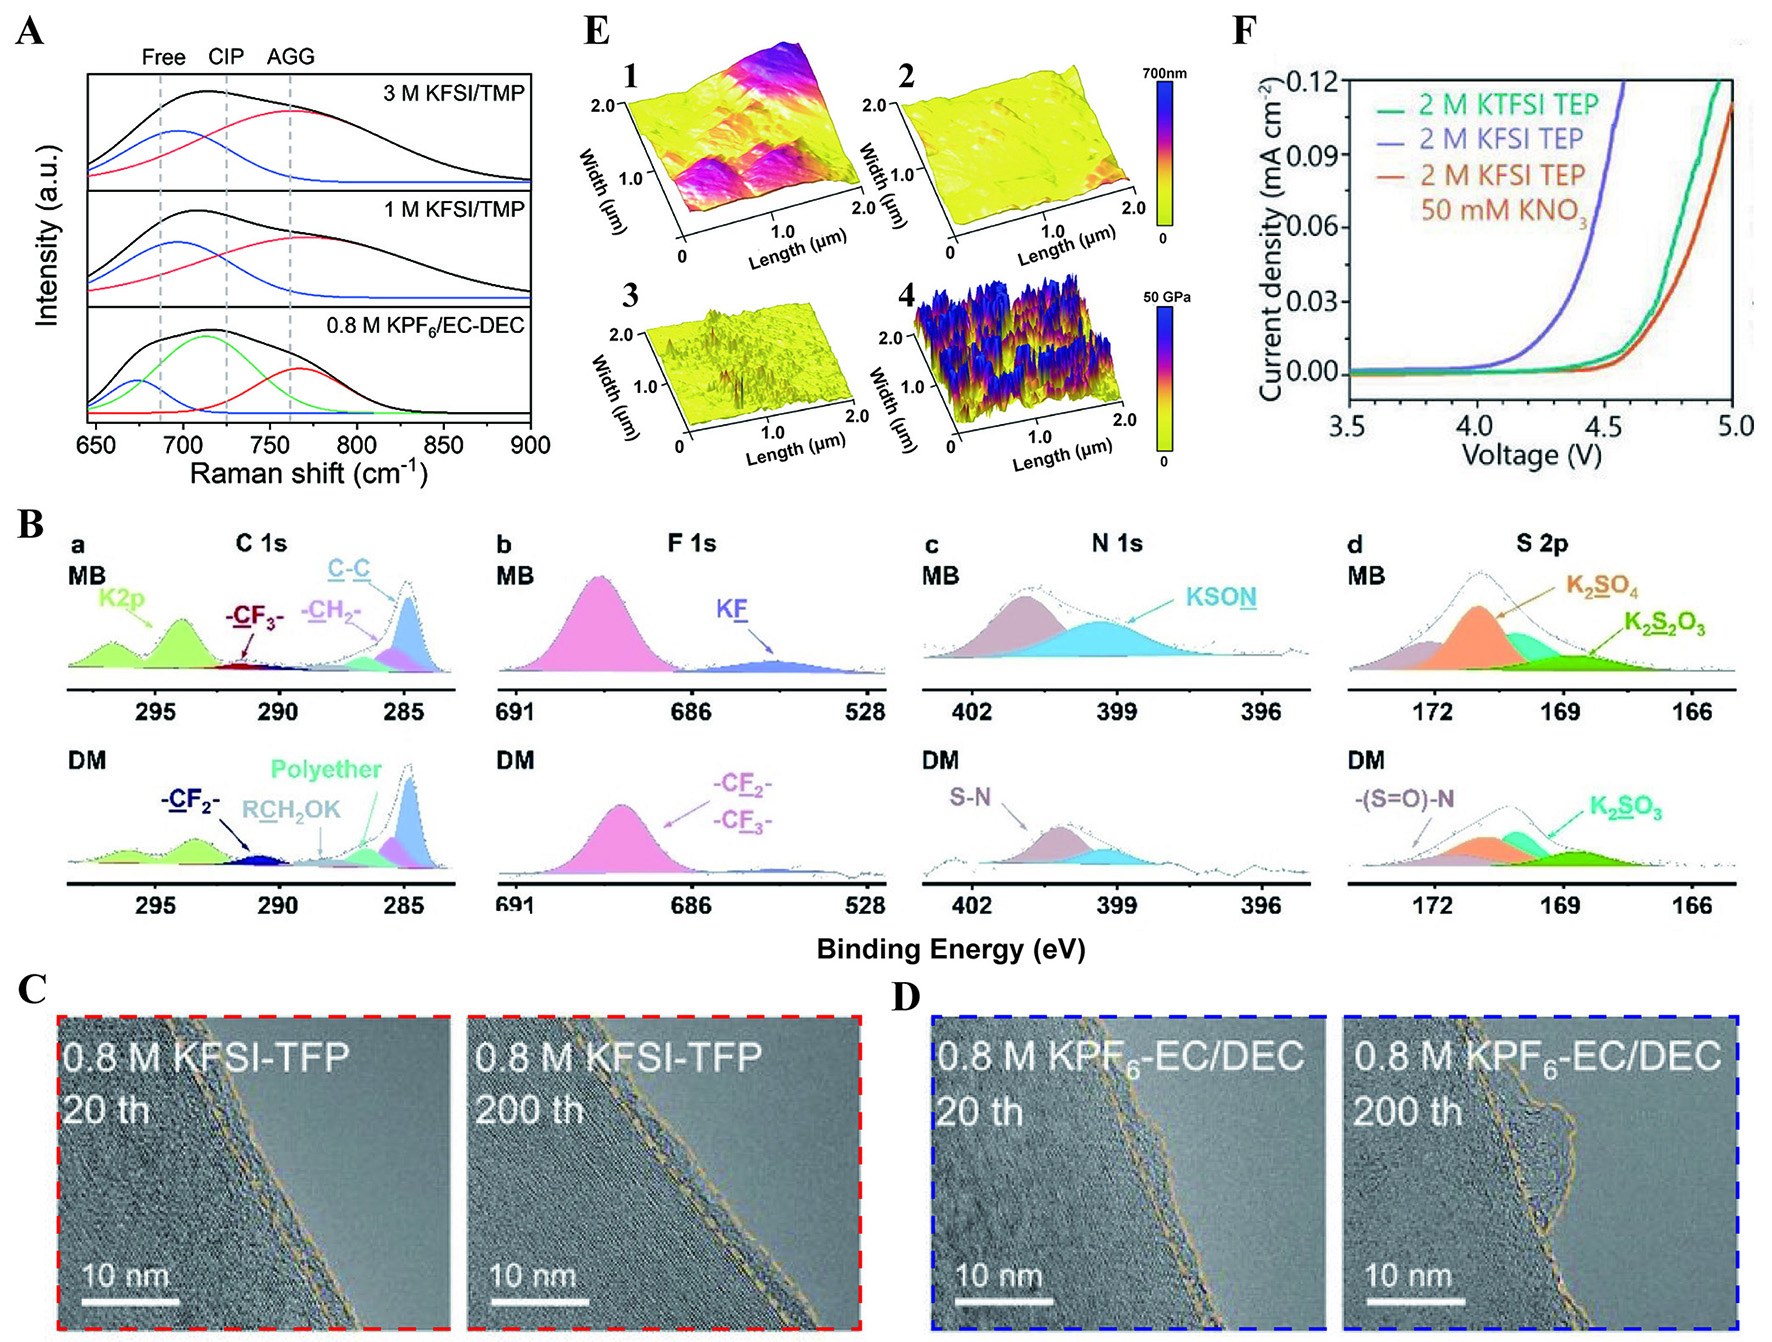
Figure 11. (A) Raman spectra of three electrolytes[139]. Reprinted with permission from Ref.[139]. Copyright 2024 Wiley-VCH[139]. (B) XPS spectra of C 1s, F 1s, N 1s, and S 2p on K0.67MnO2 surface[142]. Reprinted with permission from Ref.[142]. Copyright 2024 Wiley-VCH[142]. TEM images of SEI on the graphite cycled in 0.8 M KFSI-TFP (C) and 0.8 M KPF6-EC/DEC (D) for 20 and 200 cycles[143].


