

fig8
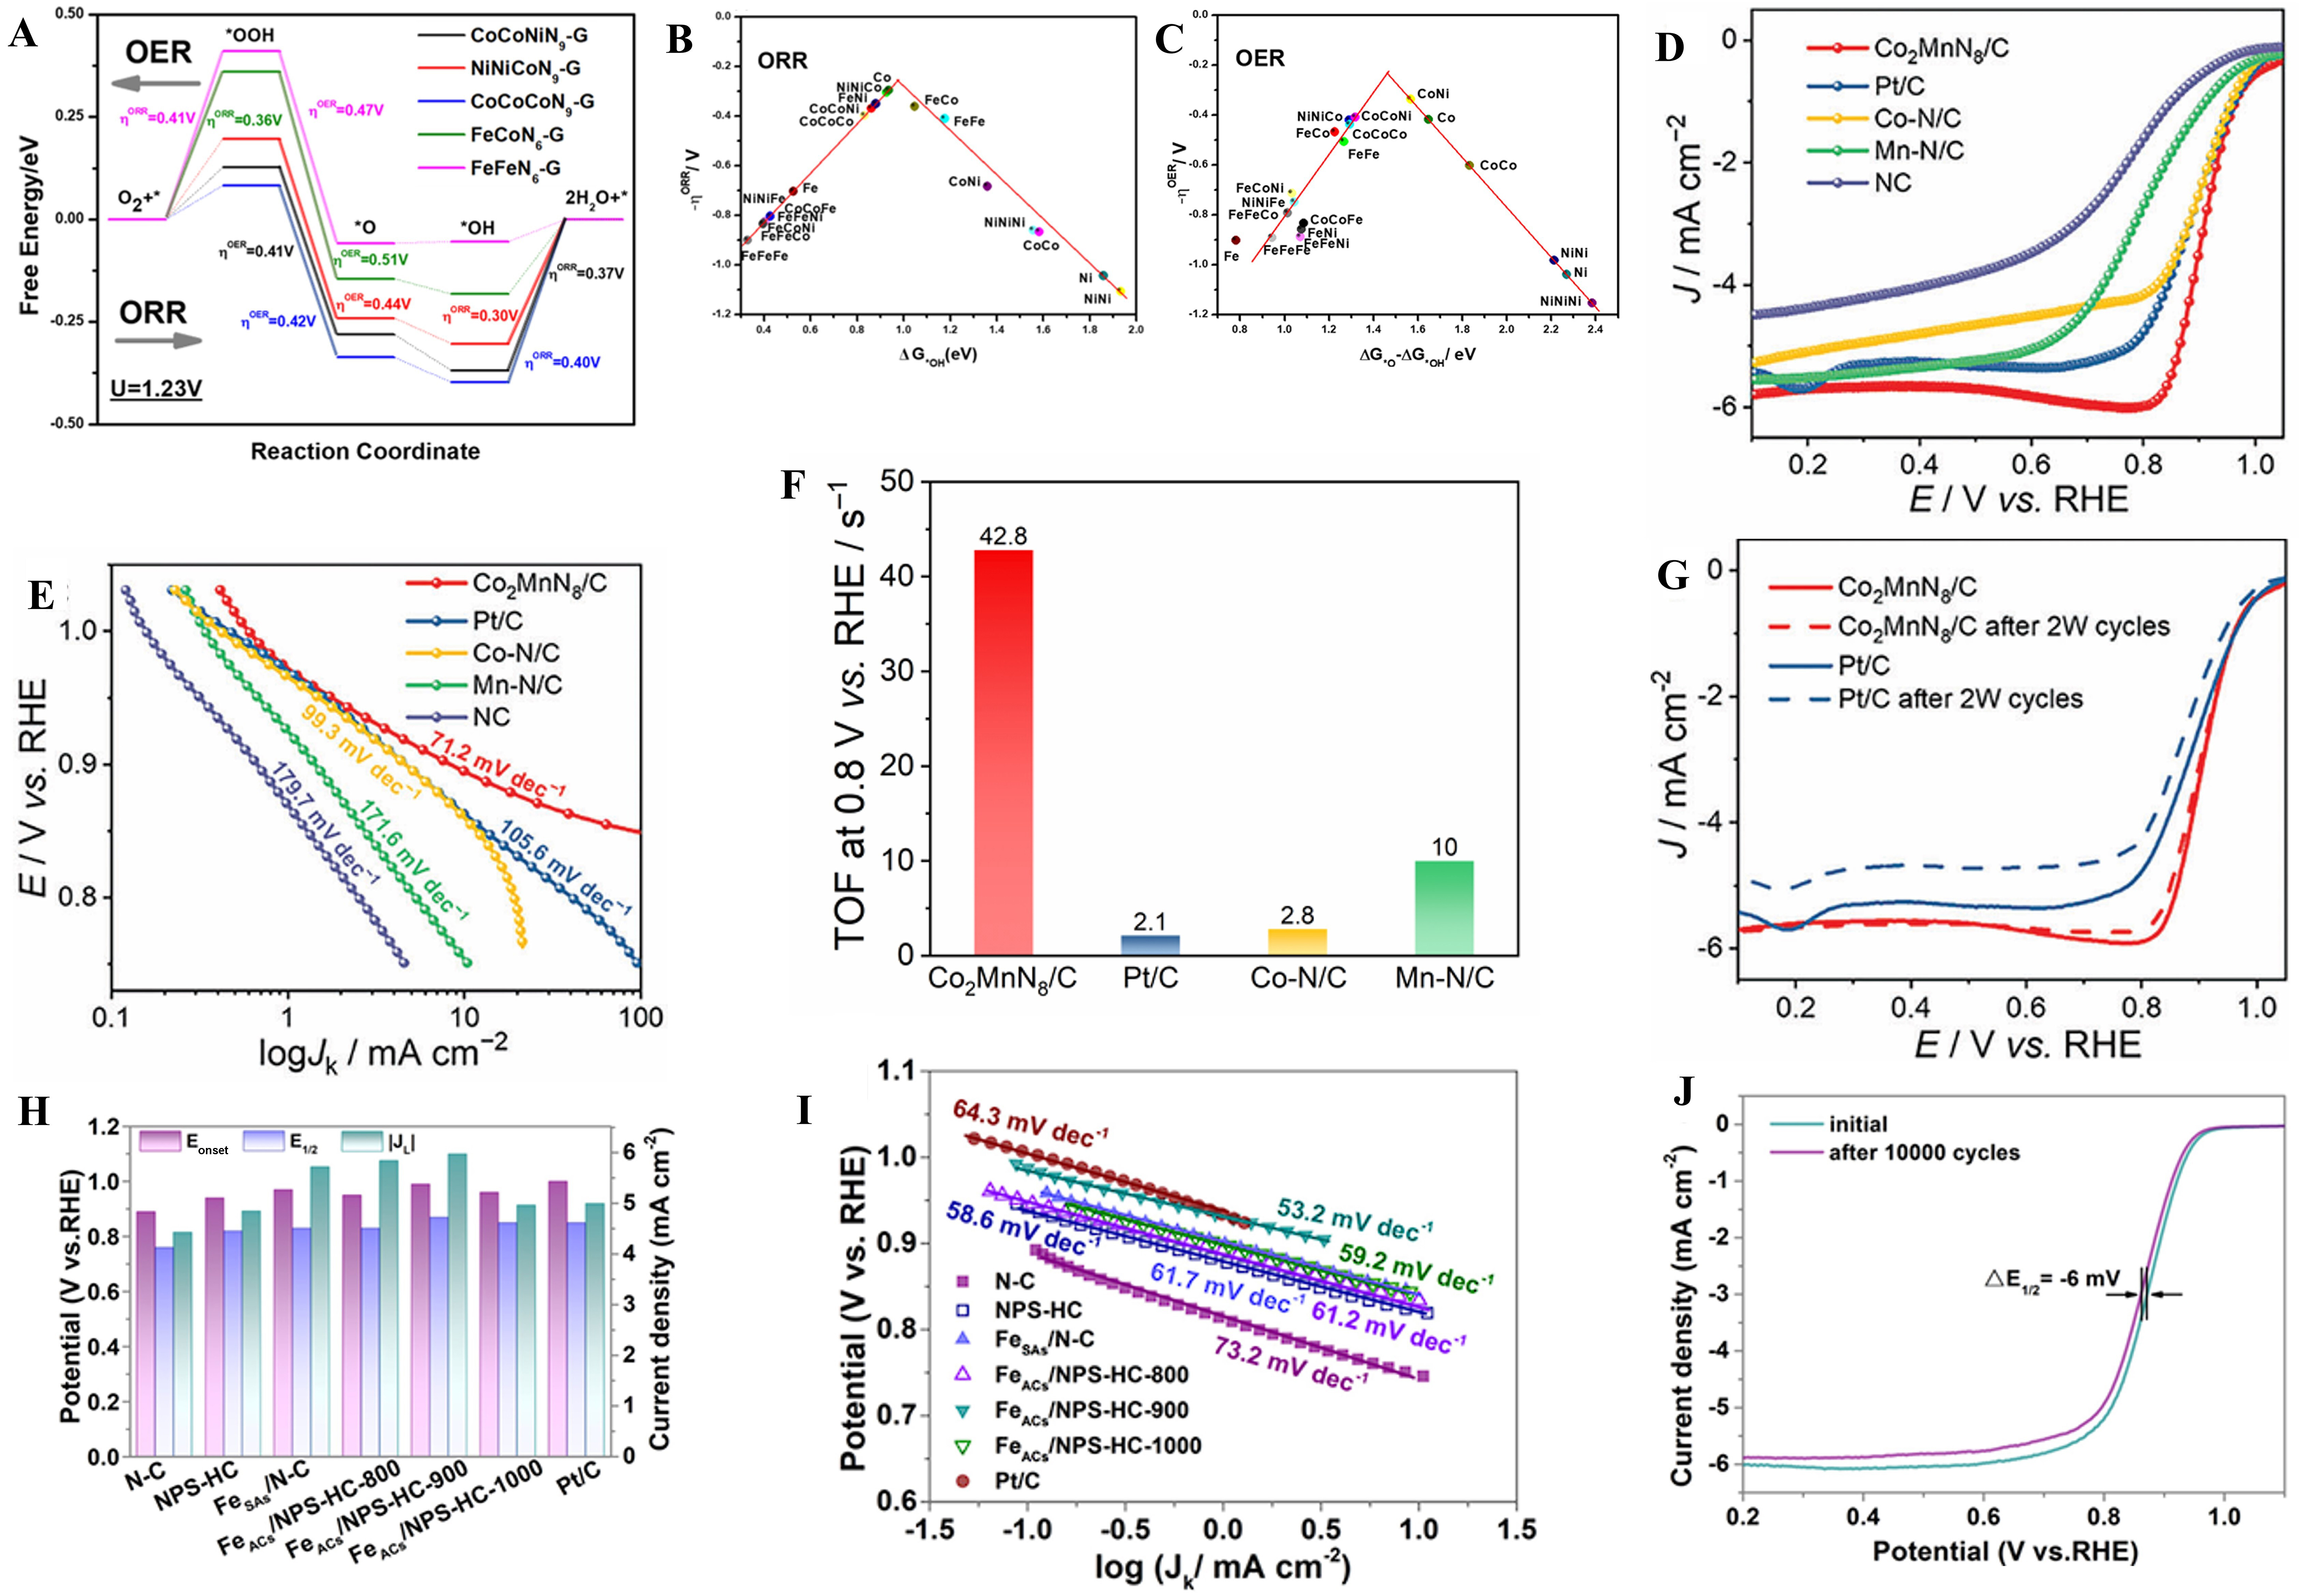
Figure 8. (A) The ORR and OER free energy diagram of CoCoNiN9-G, NiNiCoN9-G, CoCoCoN9-G, FeCoN6-G and FeFeN6-G under U = 1.23 V; (B and C) The volcano plots of OER and ORR[46], Copyright 2022 Elsevier B.V.; (D) LSV curves for ORR in O2-saturated 0.1 m KOH at 1,600 rpm; (E) Tafel plots; (F) The TOF values Co2MnN8/C, Pt/C, Co-N/C and Mn-N/C at 0.8 V vs. RHE; (G) LSV curves of


