




fig5
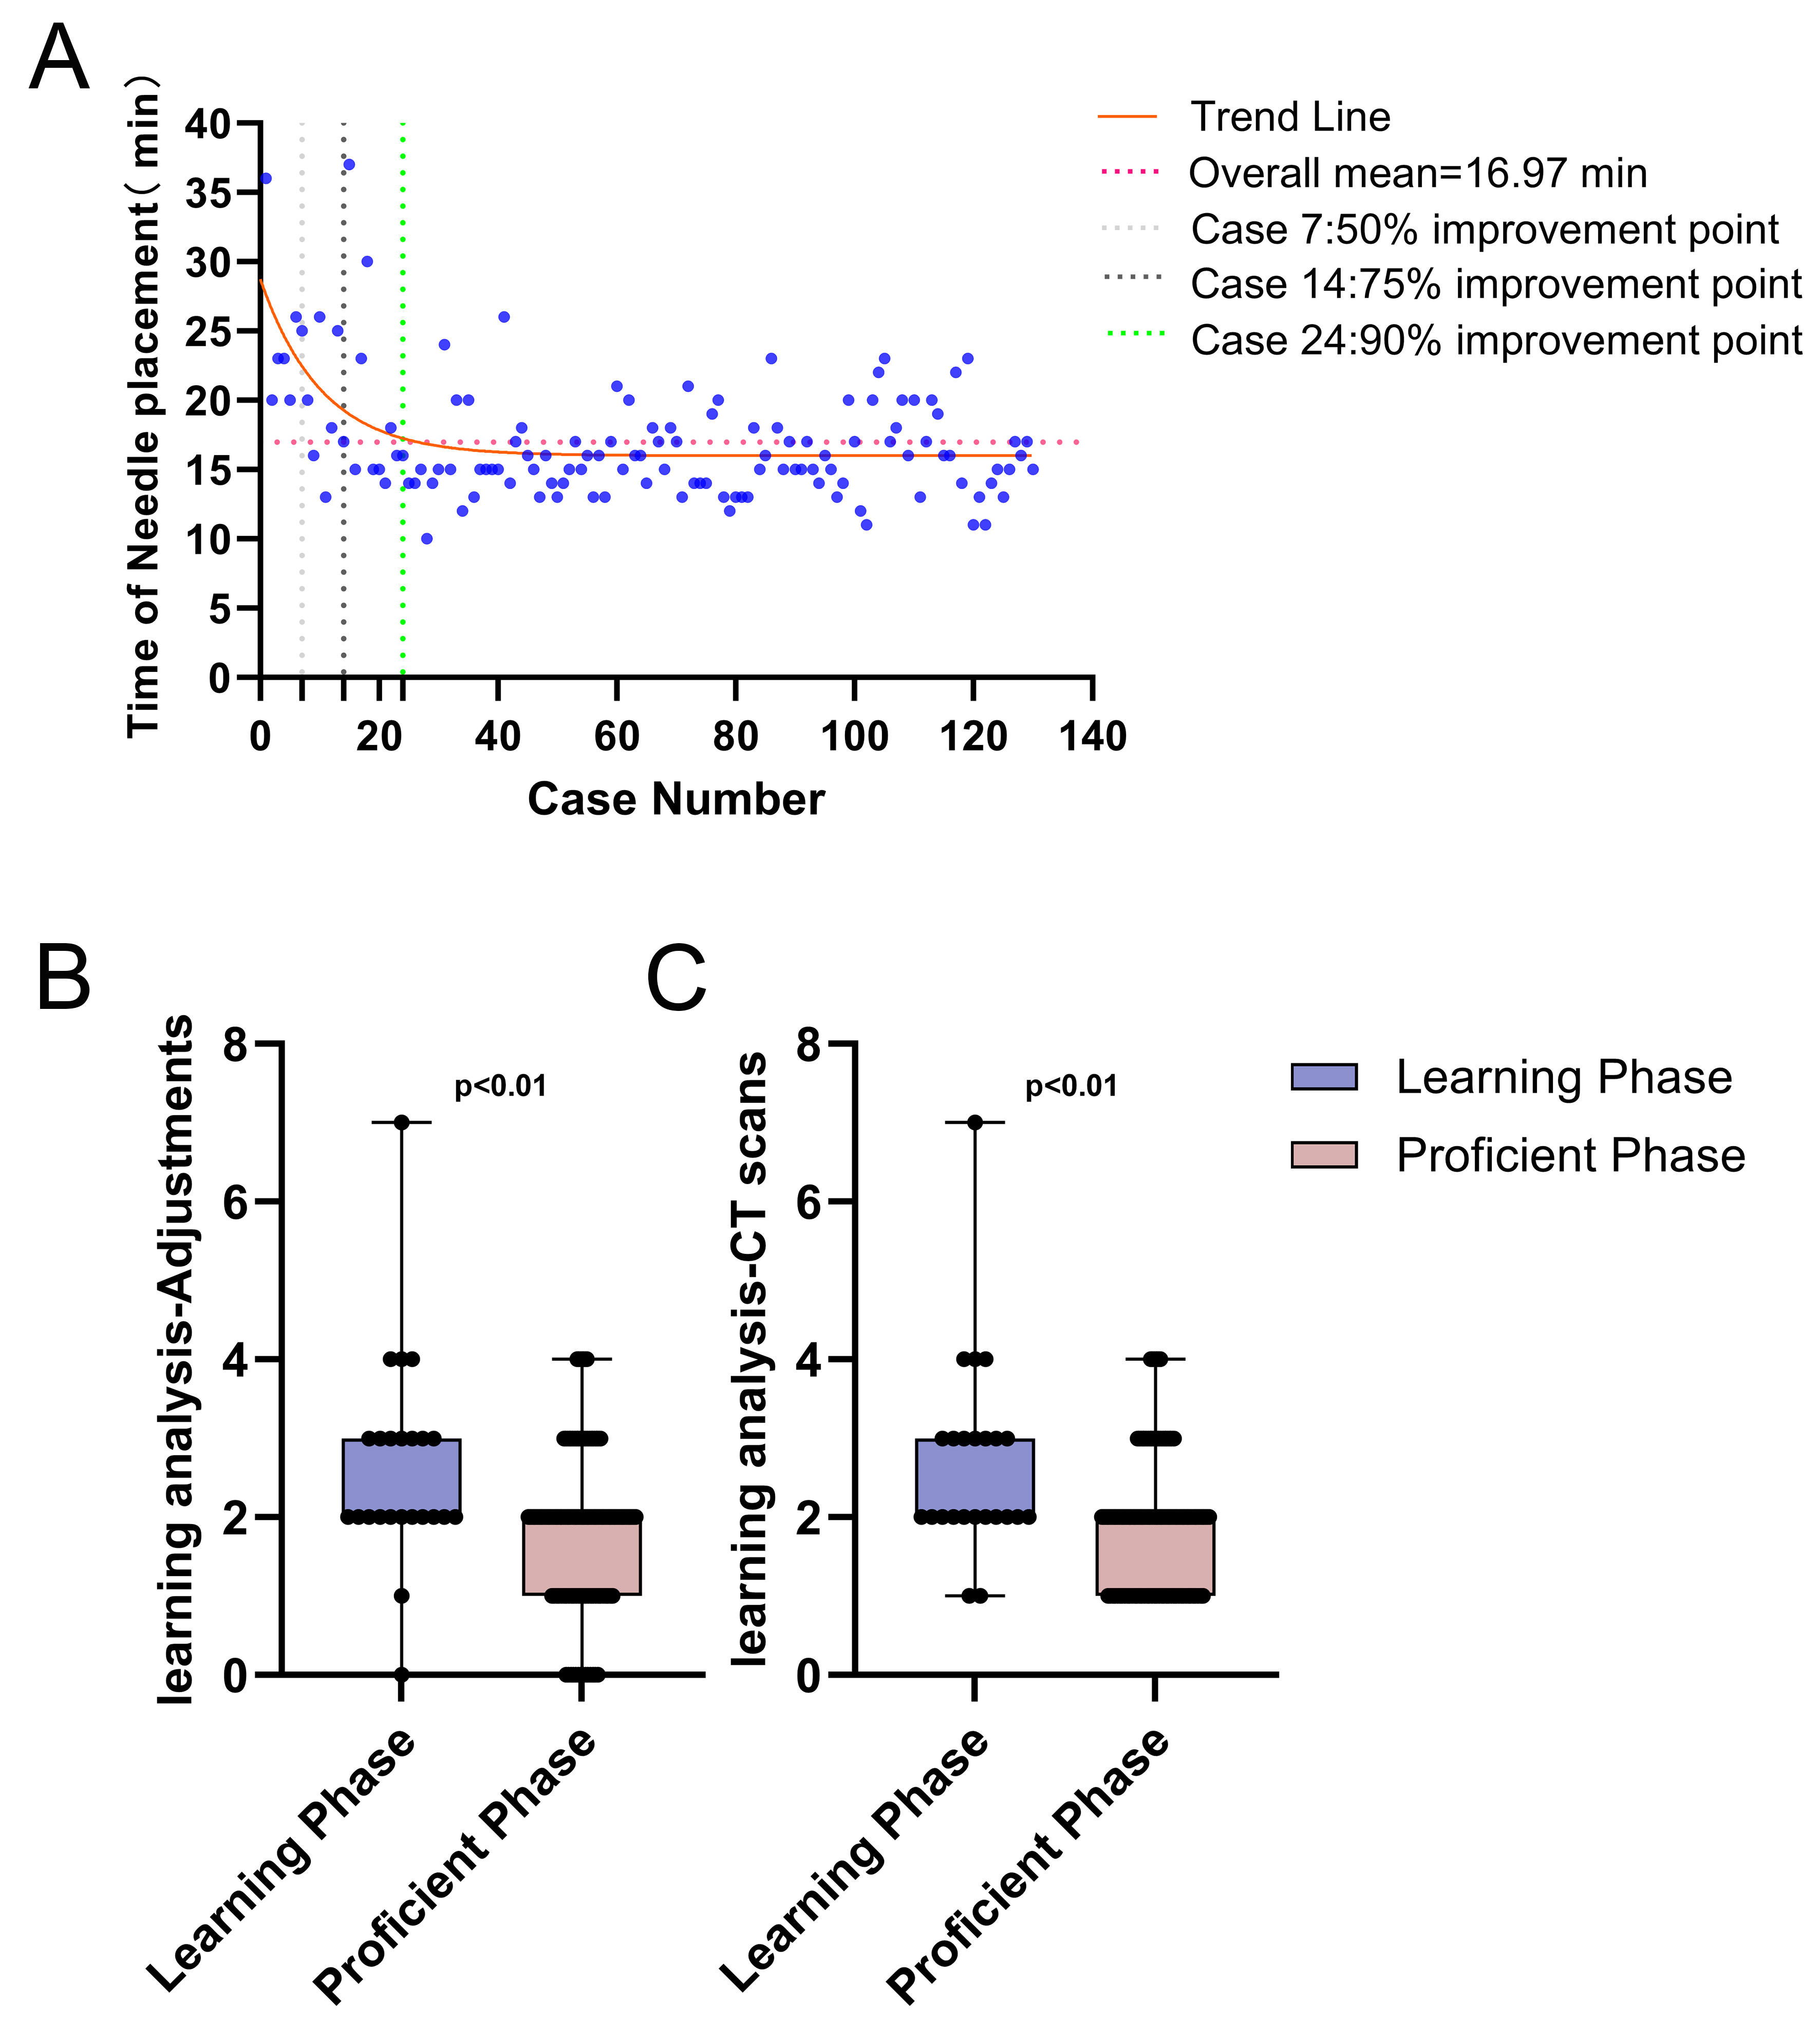
Figure 5. Learning curve of Robotic-Assisted Navigation and analysis. (A) Scatter plot with fitted one-phase exponential decay curve showing the relationship between procedure number and the interval from first CT acquisition to successful needle placement (n = 130 consecutive robotic-assisted procedures). The curve plateau was used to define the learning phase (first 24 cases) and proficient phase (subsequent 106 cases); (B) Box-and-whisker plot of needle adjustment frequency comparing the learning and proficient phases; (C) Box-and-whisker plot of CT acquisition number comparing the learning and proficient phases. For (B) and (C), data are presented as median [IQR], and P values were calculated using the Mann-Whitney U test. IQR: Interquartile ranges; CT: computed tomography.