




fig1
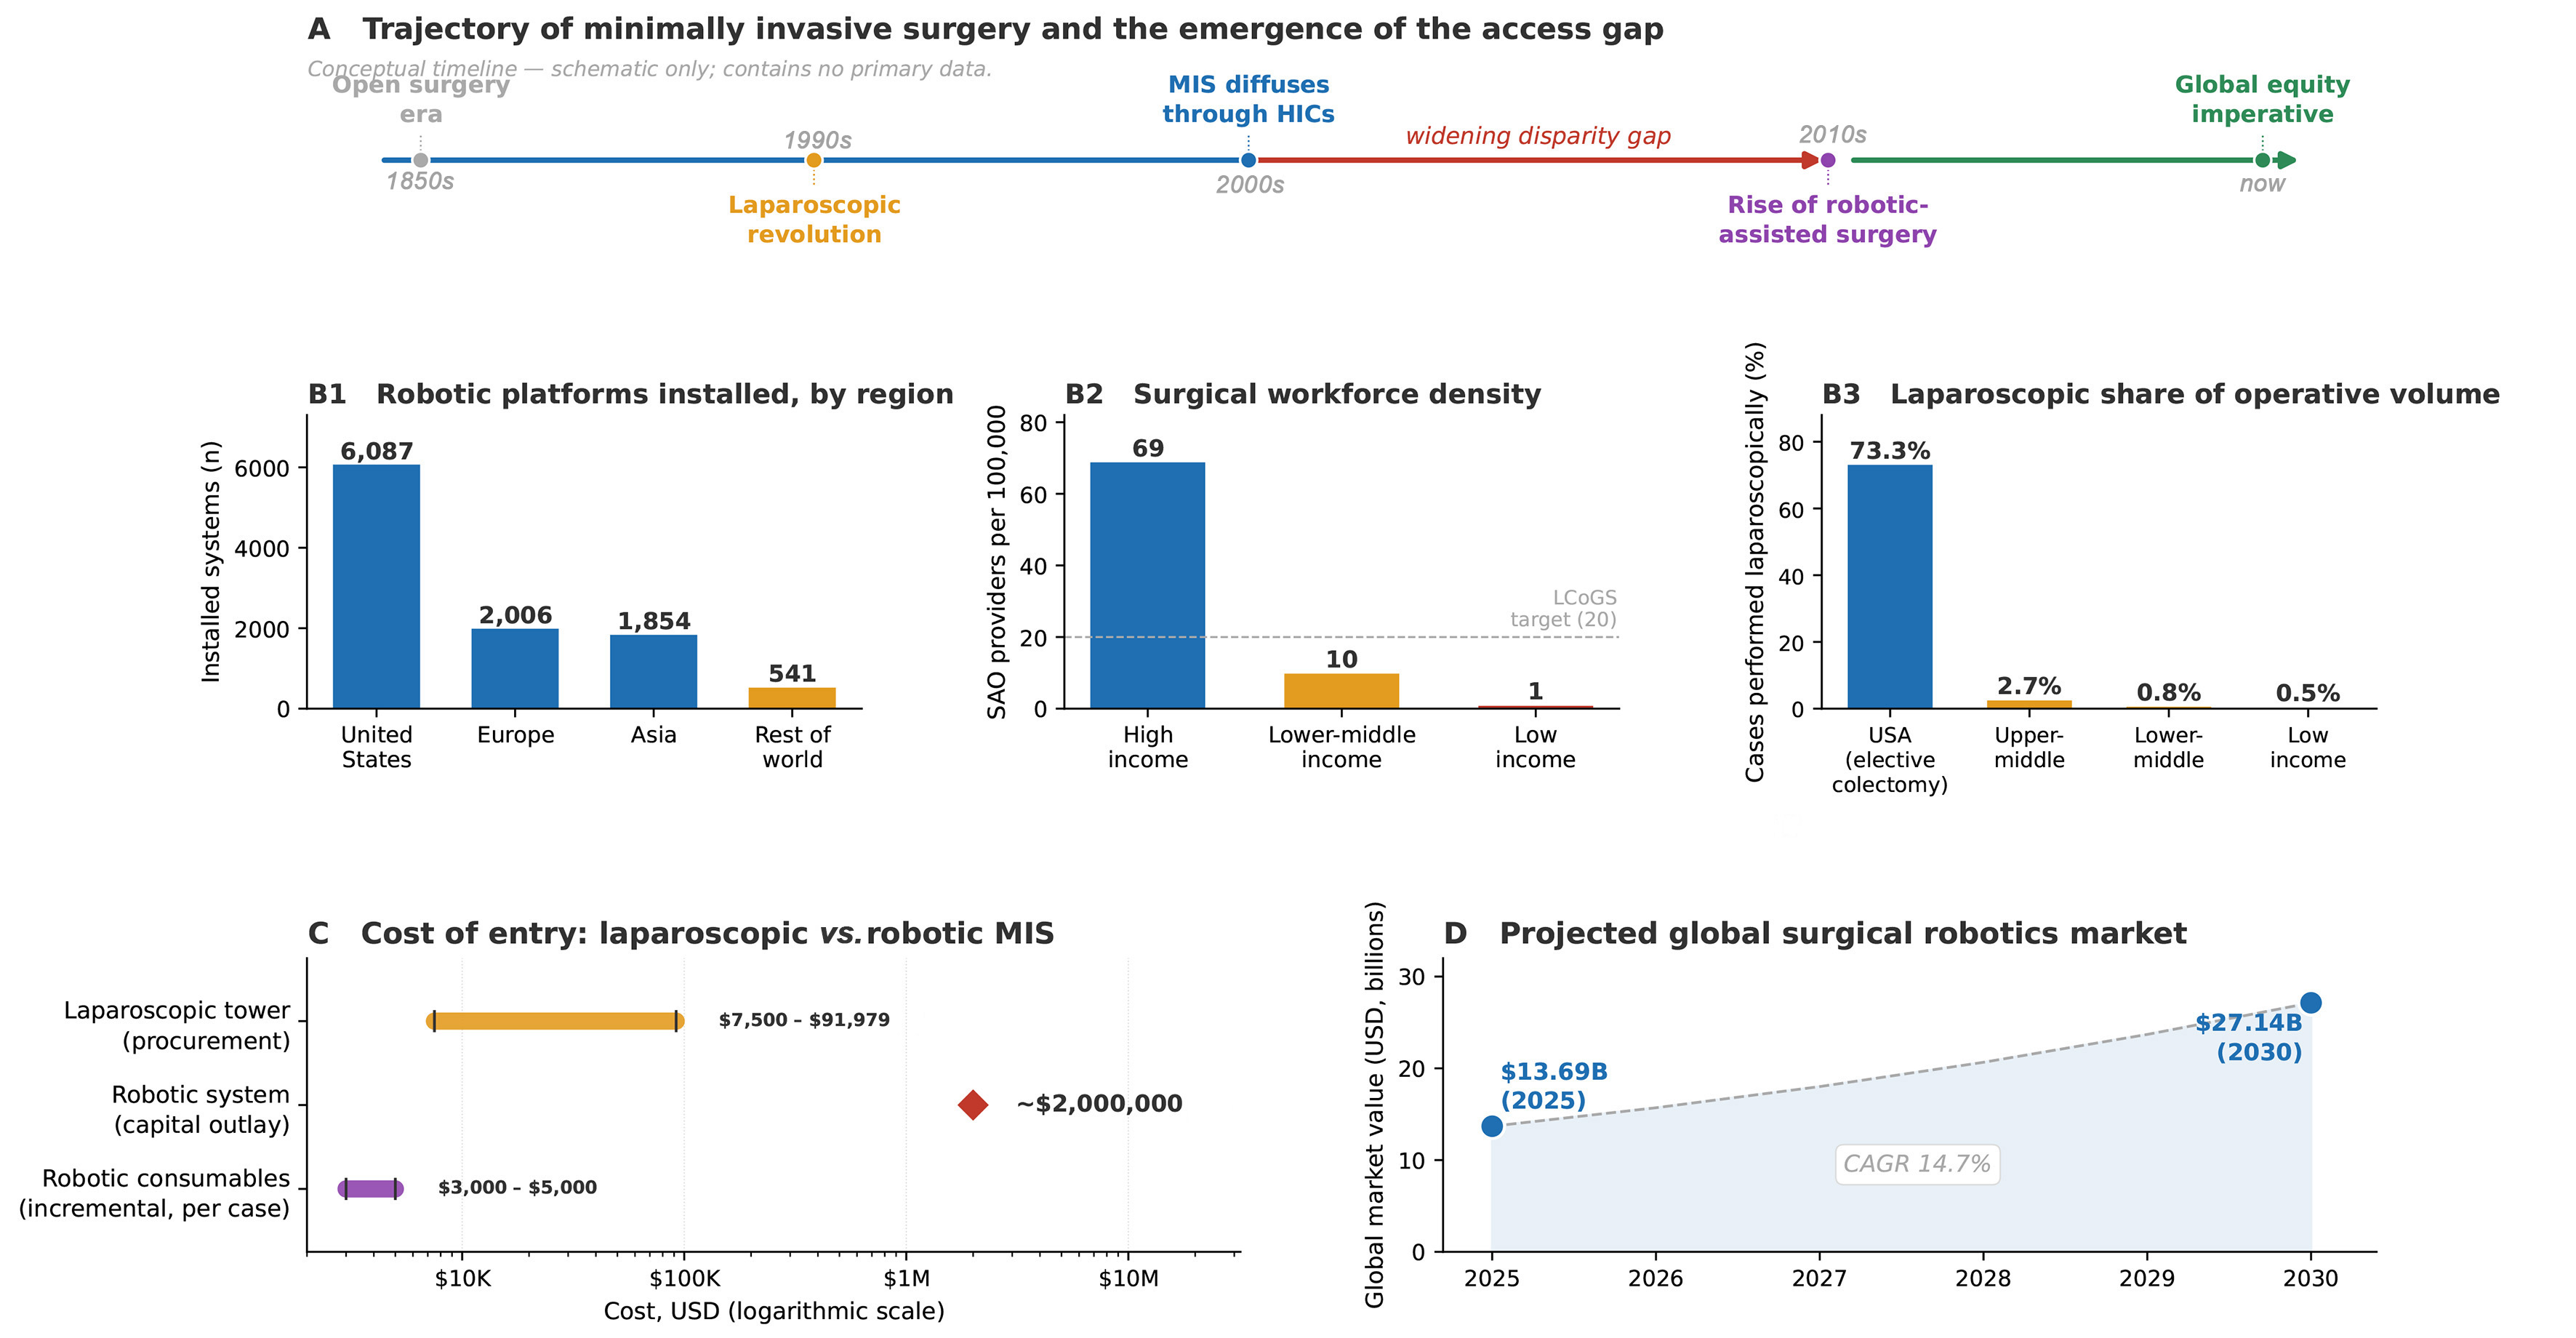
Figure 1. Surgical disparities and the robot: a multi-dimensional overview. Methods note: no primary data were collected for this figure. All values in (B1-3), (C) and (D) are taken directly from the published sources cited below, with the unit of measurement and denominator stated for each; no normalization, modeling, or rescaling has been applied, and interpolated points are identified as such. (A) A conceptual, non-quantitative timeline (schematic only) tracing surgery across four eras - the open-surgery era (from the 1850s), the laparoscopic revolution (1980s-2000s) during which MIS diffused through HICs, the rise of robotic-assisted surgery (2010s onward), and the present “global equity imperative” - in which the widening arrow between the high-income diffusion of MIS and the present day depicts the growing disparity gap that is the central theme of this perspective; (B1) Absolute number of installed robotic surgical systems (n) by region as of 30 June 2025 (United States 6,087; Europe 2,006; Asia 1,854; rest of world 541), illustrating the extreme geographic concentration of robotic infrastructure in high-income regions[2]; (B2) Density of SAO providers per 100,000 population by World Bank income group (high income 69; lower-middle income 10; low income 1), with the dashed line marking the LCoGS minimum target of 20 per 100,000; only high-income countries exceed the target, whereas low-income countries fall roughly 20-fold below it[3,4]; (B3) Percentage of cases performed laparoscopically, showing that even basic laparoscopy - not robotics - remains largely inaccessible outside high-income settings; the US bar (elective colectomy, 73.3%) reflects a national series, while the income-group bars (upper-middle 2.7%; lower-middle 0.8%; low 0.5%) derive from COSECSA trainee logs (68,659 cases), the two sets being drawn from different case types and denominators and juxtaposed for scale rather than as a matched comparison[5,6]; (C) Capital and per-case cost ranges on a logarithmic USD axis for three entry points - a laparoscopic tower (procurement, $7,500-91,979), a robotic system (capital outlay, ~$2,000,000), and robotic consumables (incremental, per case, $3,000-5,000) - highlighting the 22- to 267-fold difference in capital cost that separates a laparoscopic tower from a robotic system[2,7,8]; (D) Projected global surgical-robotics market value (USD billions) rising from $13.69B (2025) to $27.14B (2030) at a compound annual growth rate of 14.7%, in which the two filled circles are the reported values and the dashed line is interpolated from the reported CAGR and shown for trend only[9]. MIS: Minimally invasive surgery; HICs: high-income countries; SAO: surgical, anaesthetic and obstetric; LCoGS: Lancet Commission on Global Surgery; USD: United States dollar; CAGR: compound annual growth rate.