fig3
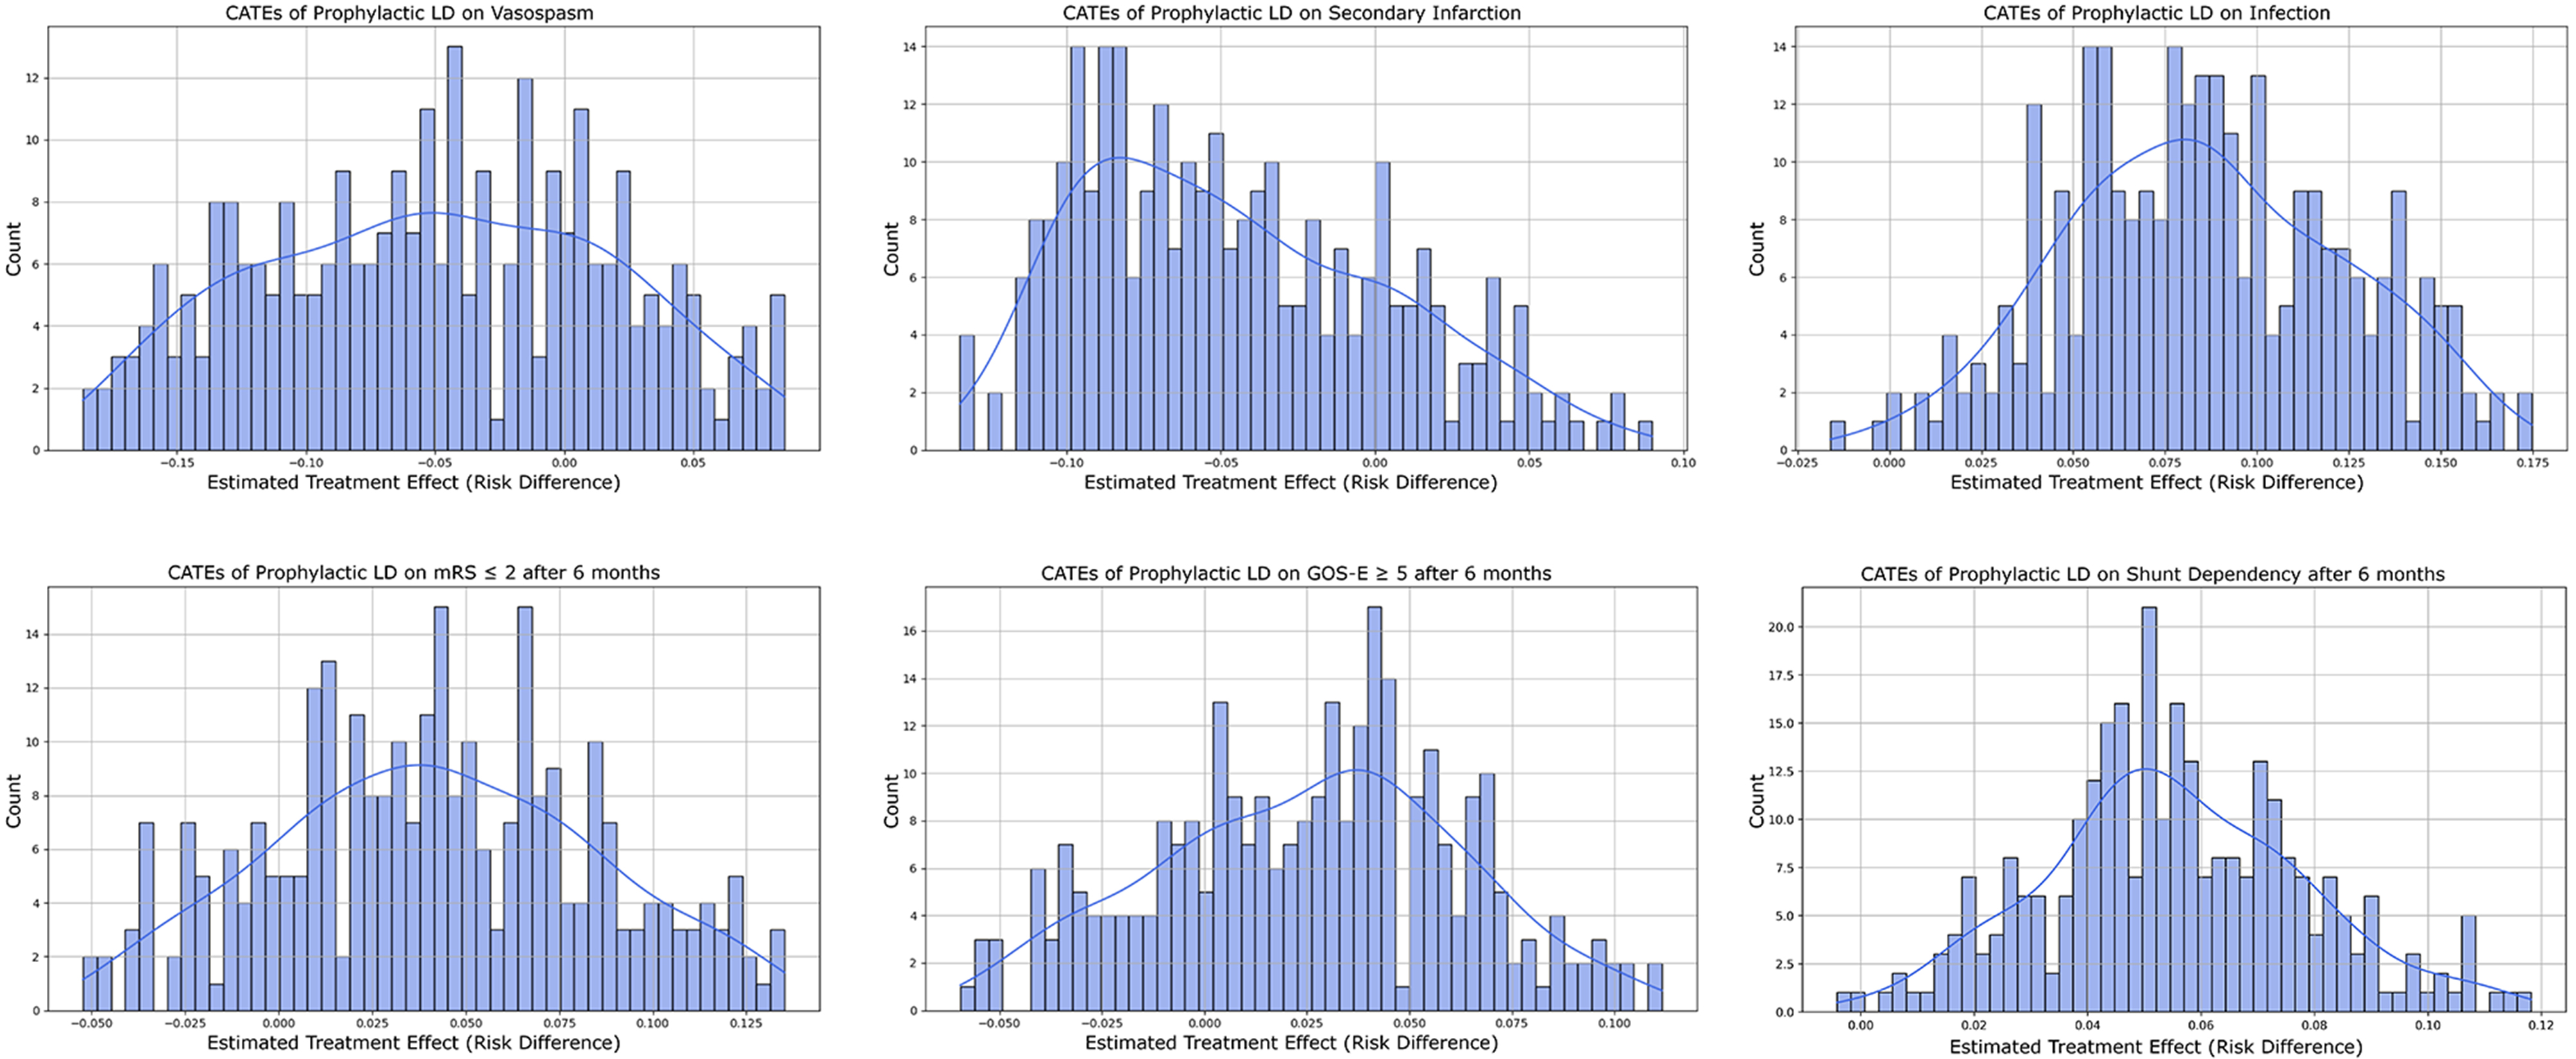
Figure 3. Conditional average treatment effect (CATE) distributions for prophylactic lumbar drainage (LD) across six clinical outcomes. Each panel displays the estimated treatment effect (risk difference) from the Causal Forest model. Outcomes include: vasospasm, secondary infarction, and infection during ICU course (top row); and modified Rankin Scale (mRS ≤ 2), Glasgow Outcome Scale-Extended (GOS-E ≥ 5), and shunt dependency at six months (bottom row). These distributions suggest heterogeneity in treatment effects across patients. ICU: intensive care unit.