fig4
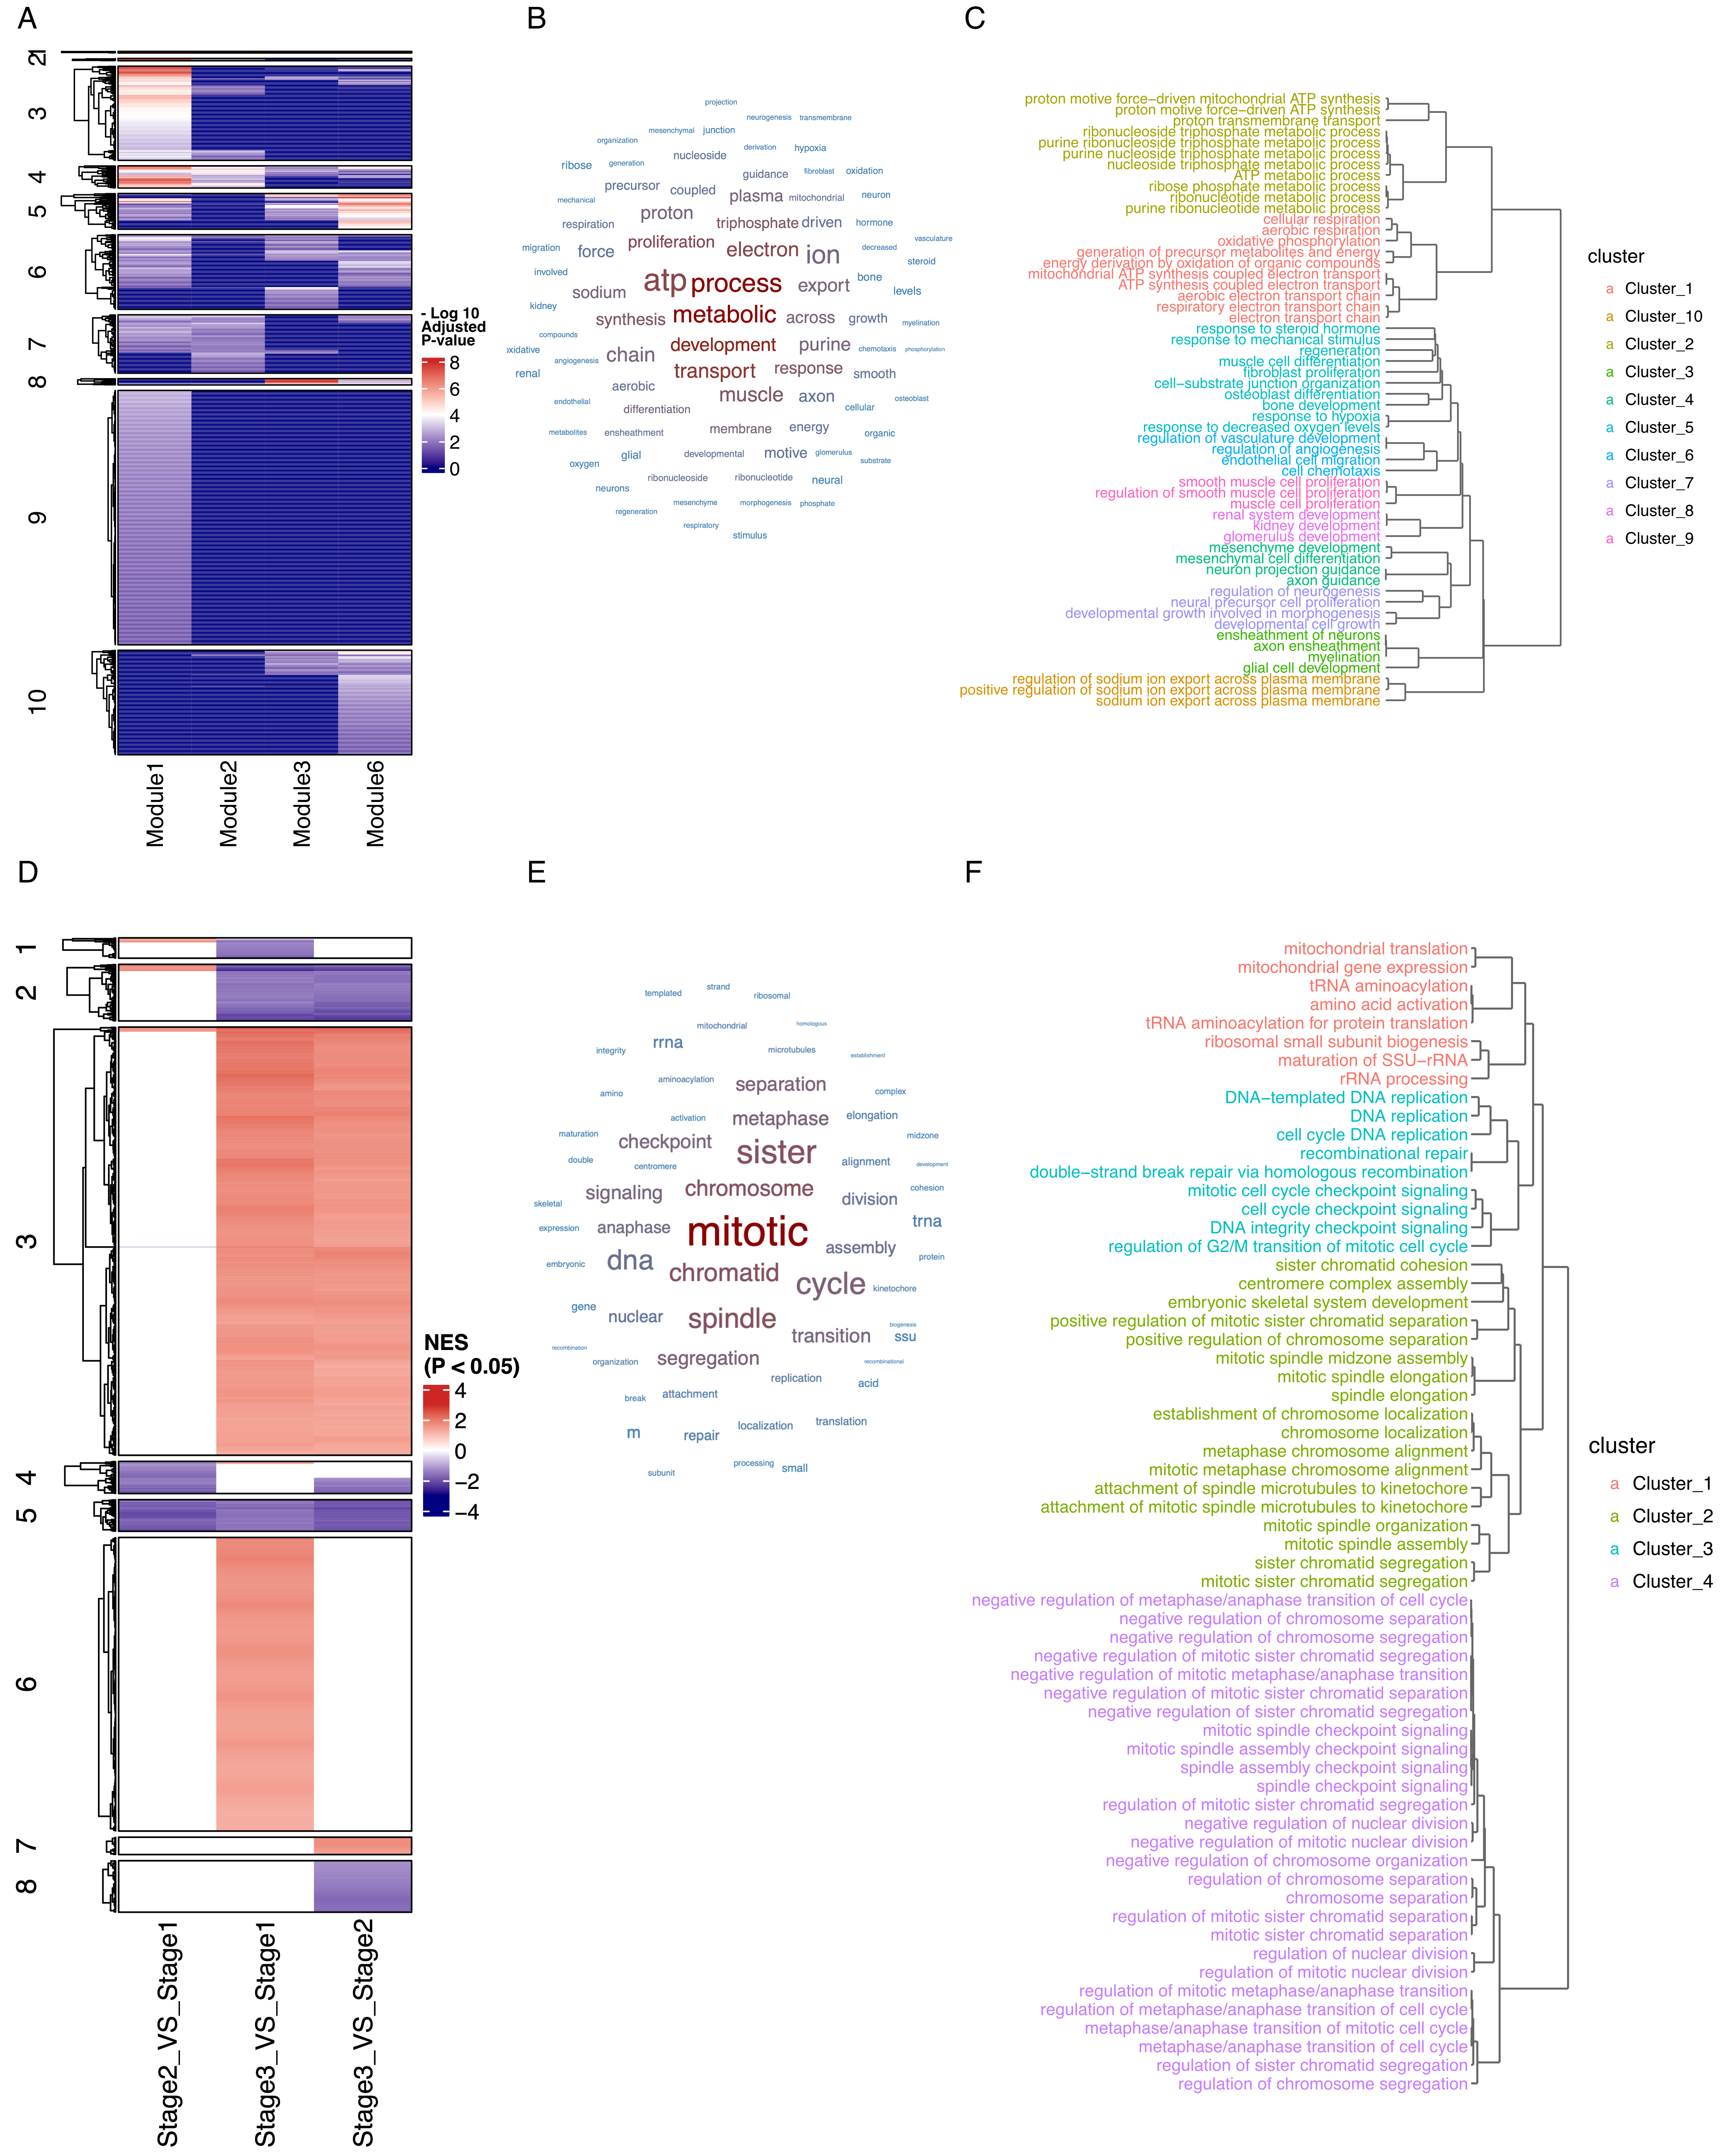
Figure 4. Clustering-based multi-condition comparison reveals conserved and dynamic biological processes across complex experimental designs. (A) Heatmap showing the enrichment of each group of genes across distinct pathways. Color intensity represents -log10 transformed adjusted P values, with darker red indicating higher statistical significance; (B) Word cloud visualization of Cluster 4 highlighting key developmental themes; (C) Pathway hierarchical clustering dendrogram of Cluster 4 showing highly interconnected developmental processes; (D) Heatmap displaying Normalized Enrichment Scores (NES) from Gene Set Enrichment Analysis (GSEA) comparing three developmental stages (Stage 2 vs. Stage 1, Stage 3 vs. Stage 1, Stage 3 vs. Stage 2) across different pathways. Color scale represents significant NES values, with red indicating positive enrichment and blue indicating negative enrichment (scale: -4 to 4); (E) Word cloud analysis of Cluster 5 emphasizing disrupted tissue functions; (F) Pathway hierarchical clustering dendrogram within Cluster 5 showing coordinated loss of normal lung physiological processes during tumor progression.