fig3
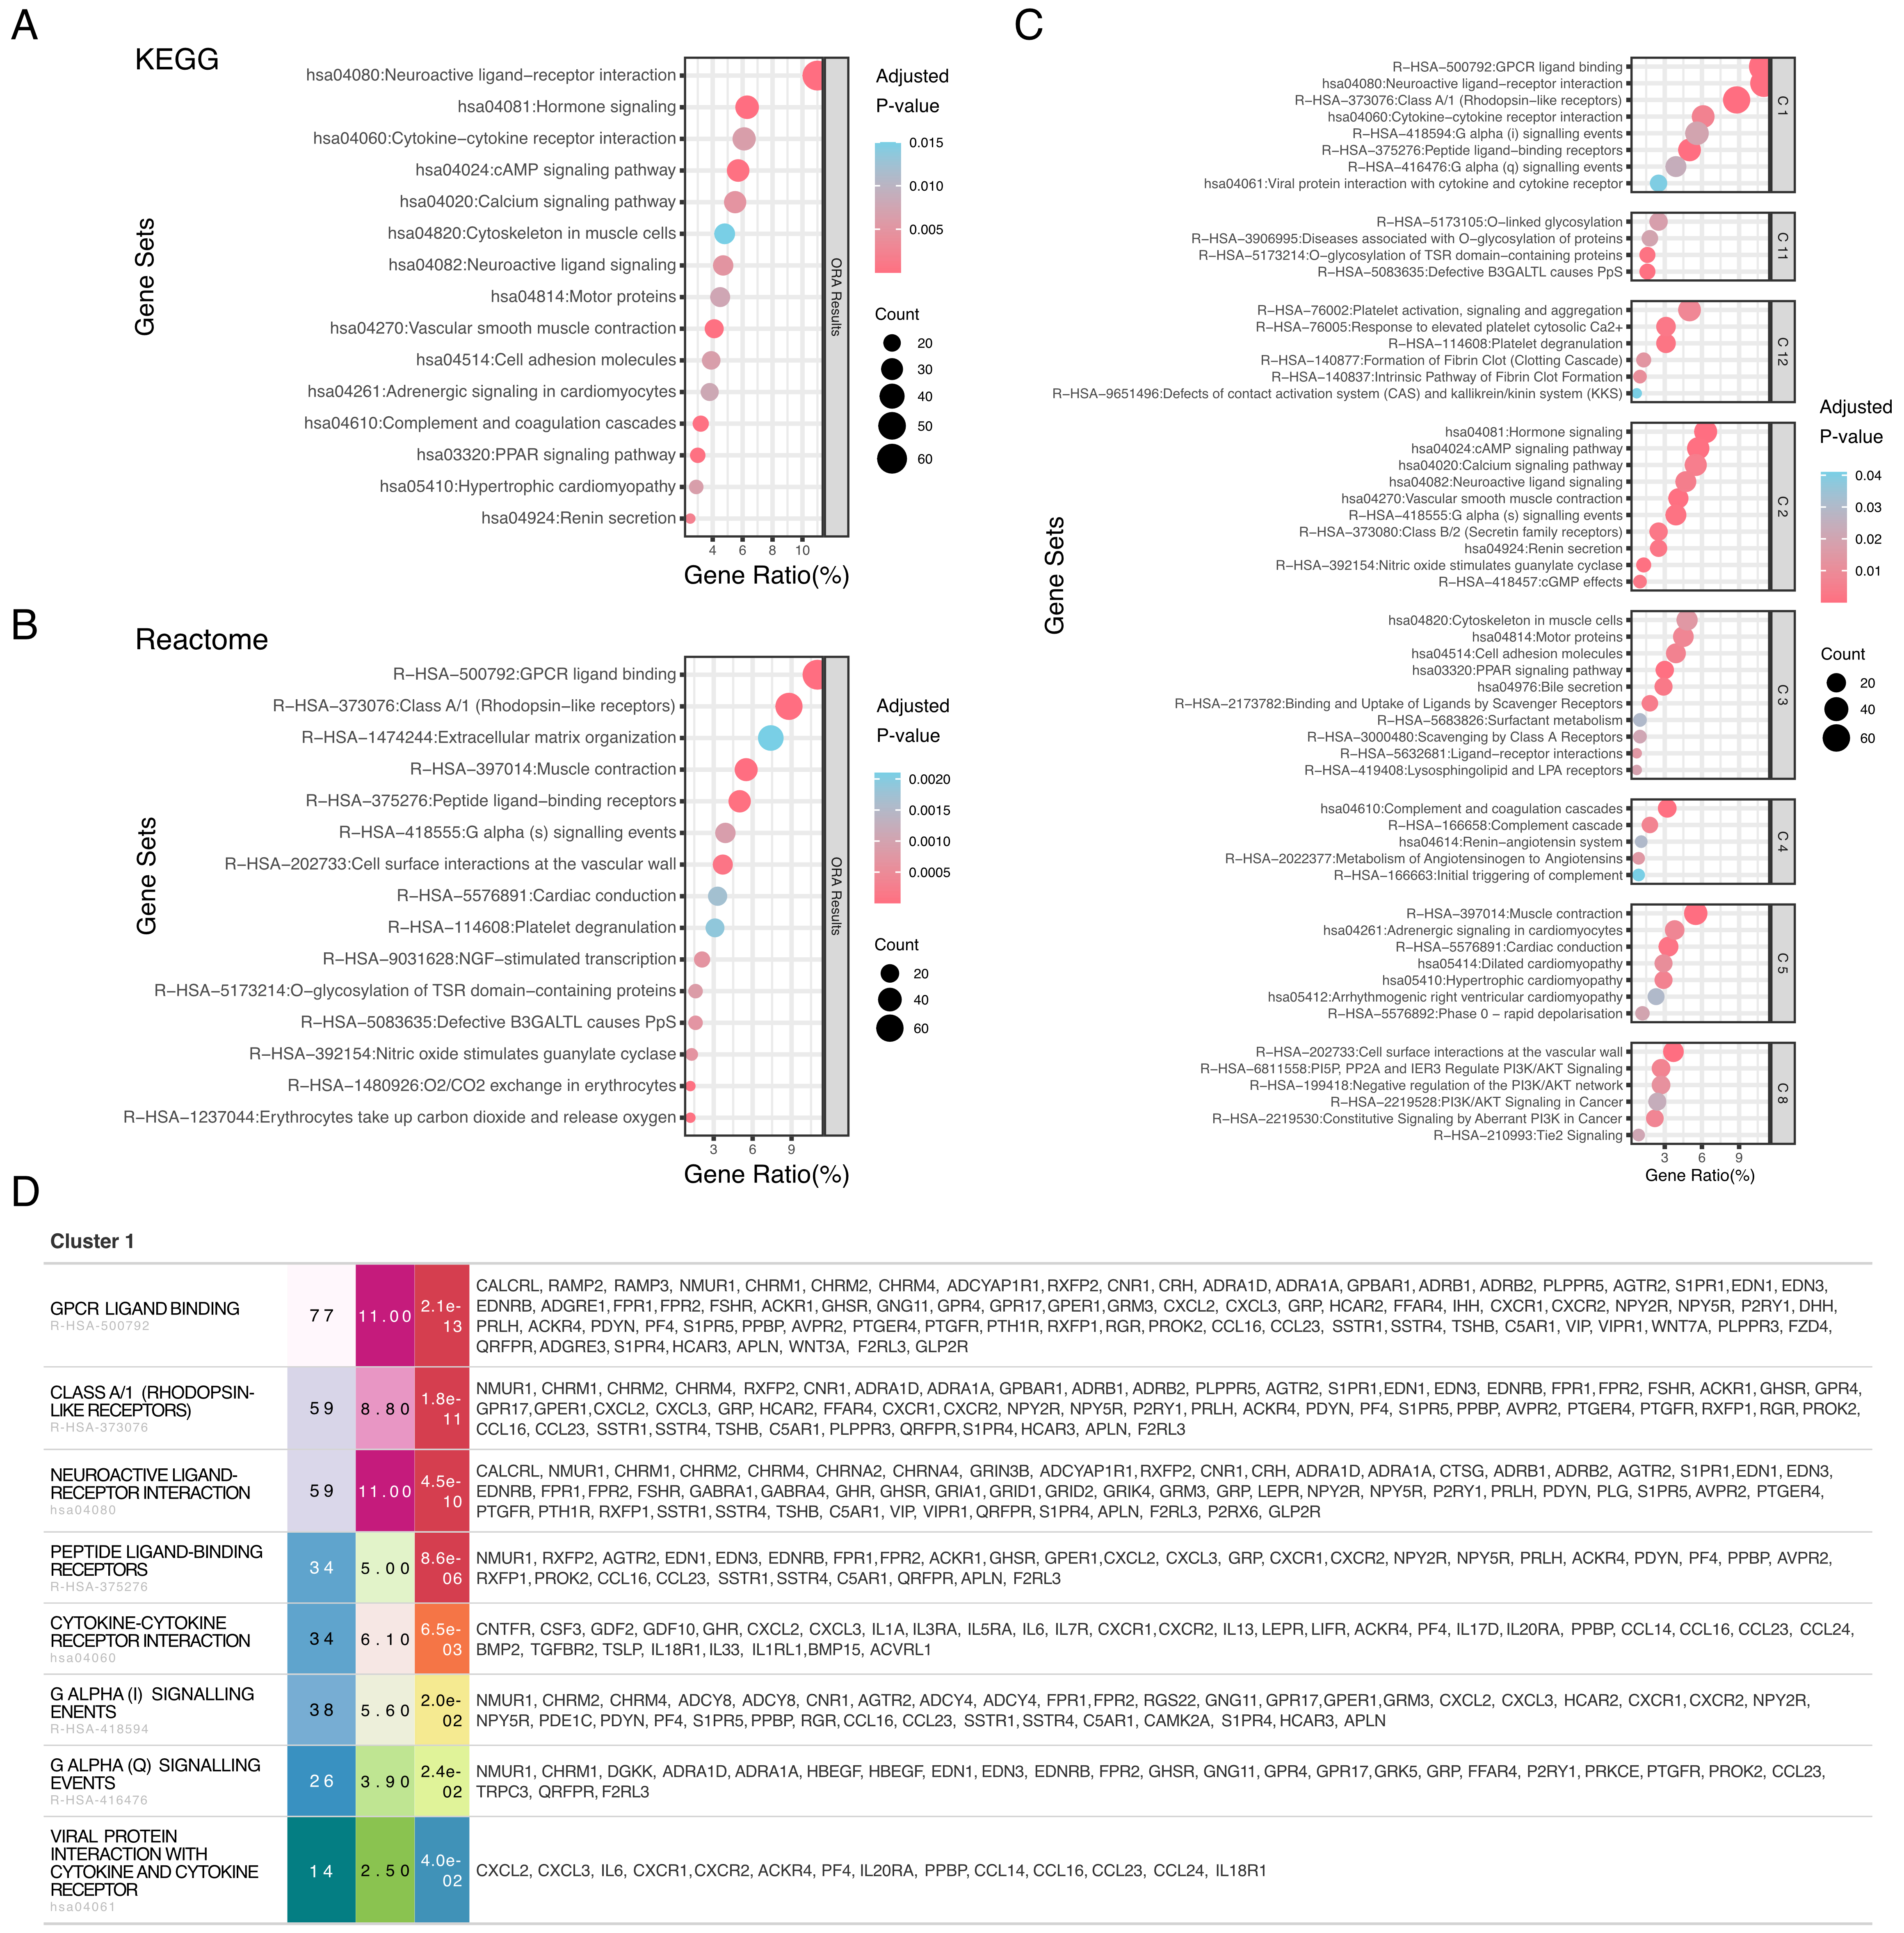
Figure 3. Multi-database integration provides comprehensive pathway analysis through complementary annotations. (A) KEGG pathway enrichment analysis of differentially expressed genes. Bubble plot showing enriched KEGG pathways, with the x-axis representing gene ratio (percentage of genes in each pathway), bubble size indicating gene count, and color denoting adjusted P-value (blue: higher significance; red: lower significance); (B) Reactome pathway enrichment analysis. Bubble plot displaying enriched Reactome pathways with the same representation as in (A). Gene ratio (x-axis), gene count (bubble size), and adjusted P-value (color scale) are shown for each pathway; (C) Comprehensive gene set enrichment re-cluster analysis across multiple databases. Multiple panels showing enriched gene sets organized by functional categories. Each bubble plot displays gene ratio (x-axis), with bubble size representing gene count and color indicating adjusted P-value. Gene sets are derived from Reactome (R-HSA) and KEGG (hsa) databases, covering diverse biological processes including signal transduction, metabolism, and cellular functions; (D) Interactive table for comprehensive gene set enrichment re-cluster analysis. KEGG: Kyoto Encyclopedia of Genes and Genomes.