
fig9
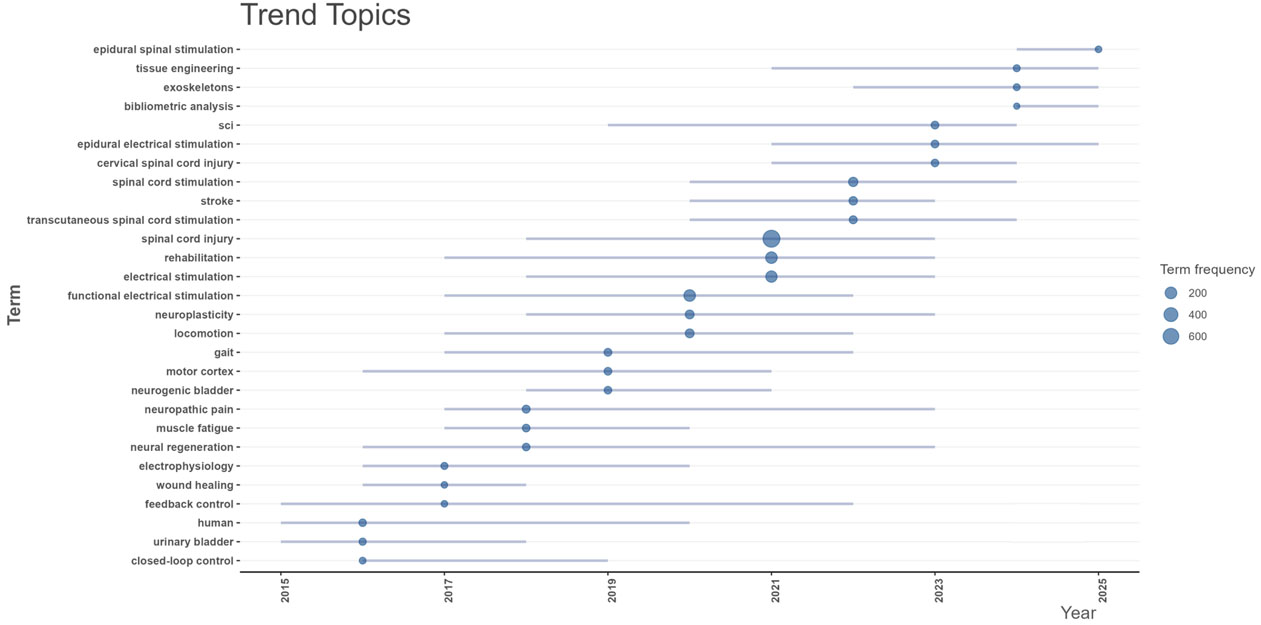
Figure 9. Trend topics analysis displaying the temporal distribution and frequency of key terms over the years. Bubble size indicates term frequency, and horizontal bars represent the active time span.
Figure 9. Trend topics analysis displaying the temporal distribution and frequency of key terms over the years. Bubble size indicates term frequency, and horizontal bars represent the active time span.

