



fig5
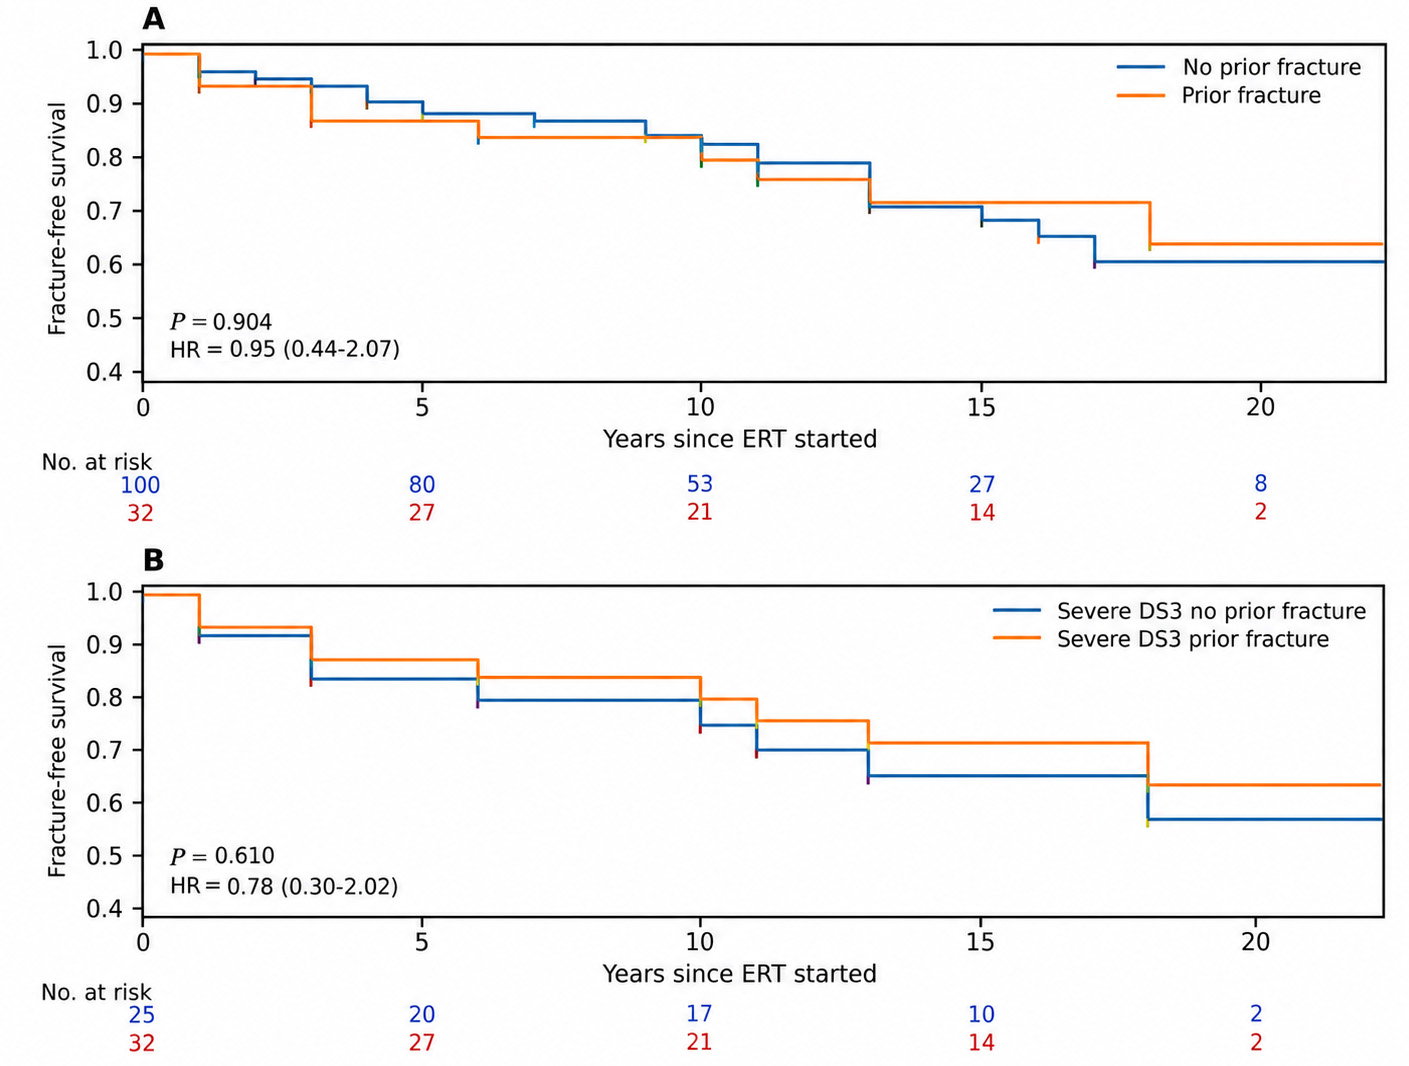
Figure 5. Sensitivity analysis. (A) Kaplan-Meier fracture-free survival plots for 32 patients who had a history of fracture before starting treatment with 100 patients who had no history of pre-treatment fracture. The number of patients at risk at the start of study and after 5, 10, 15, 20 years are shown above the X-axis. P values were calculated by Holm-corrected log rank-χ2 tests; (B: post-treatment fracture-free survival in 25 patients with a history of pre-ERT fractures and 32 with no such history. This analysis was restricted to patients with baseline DS3 ≥ 6 (i.e. severe disease). DS3: Disease severity scoring system; ERT: enzyme replacement therapy; HR: hazard ratio.