


fig1
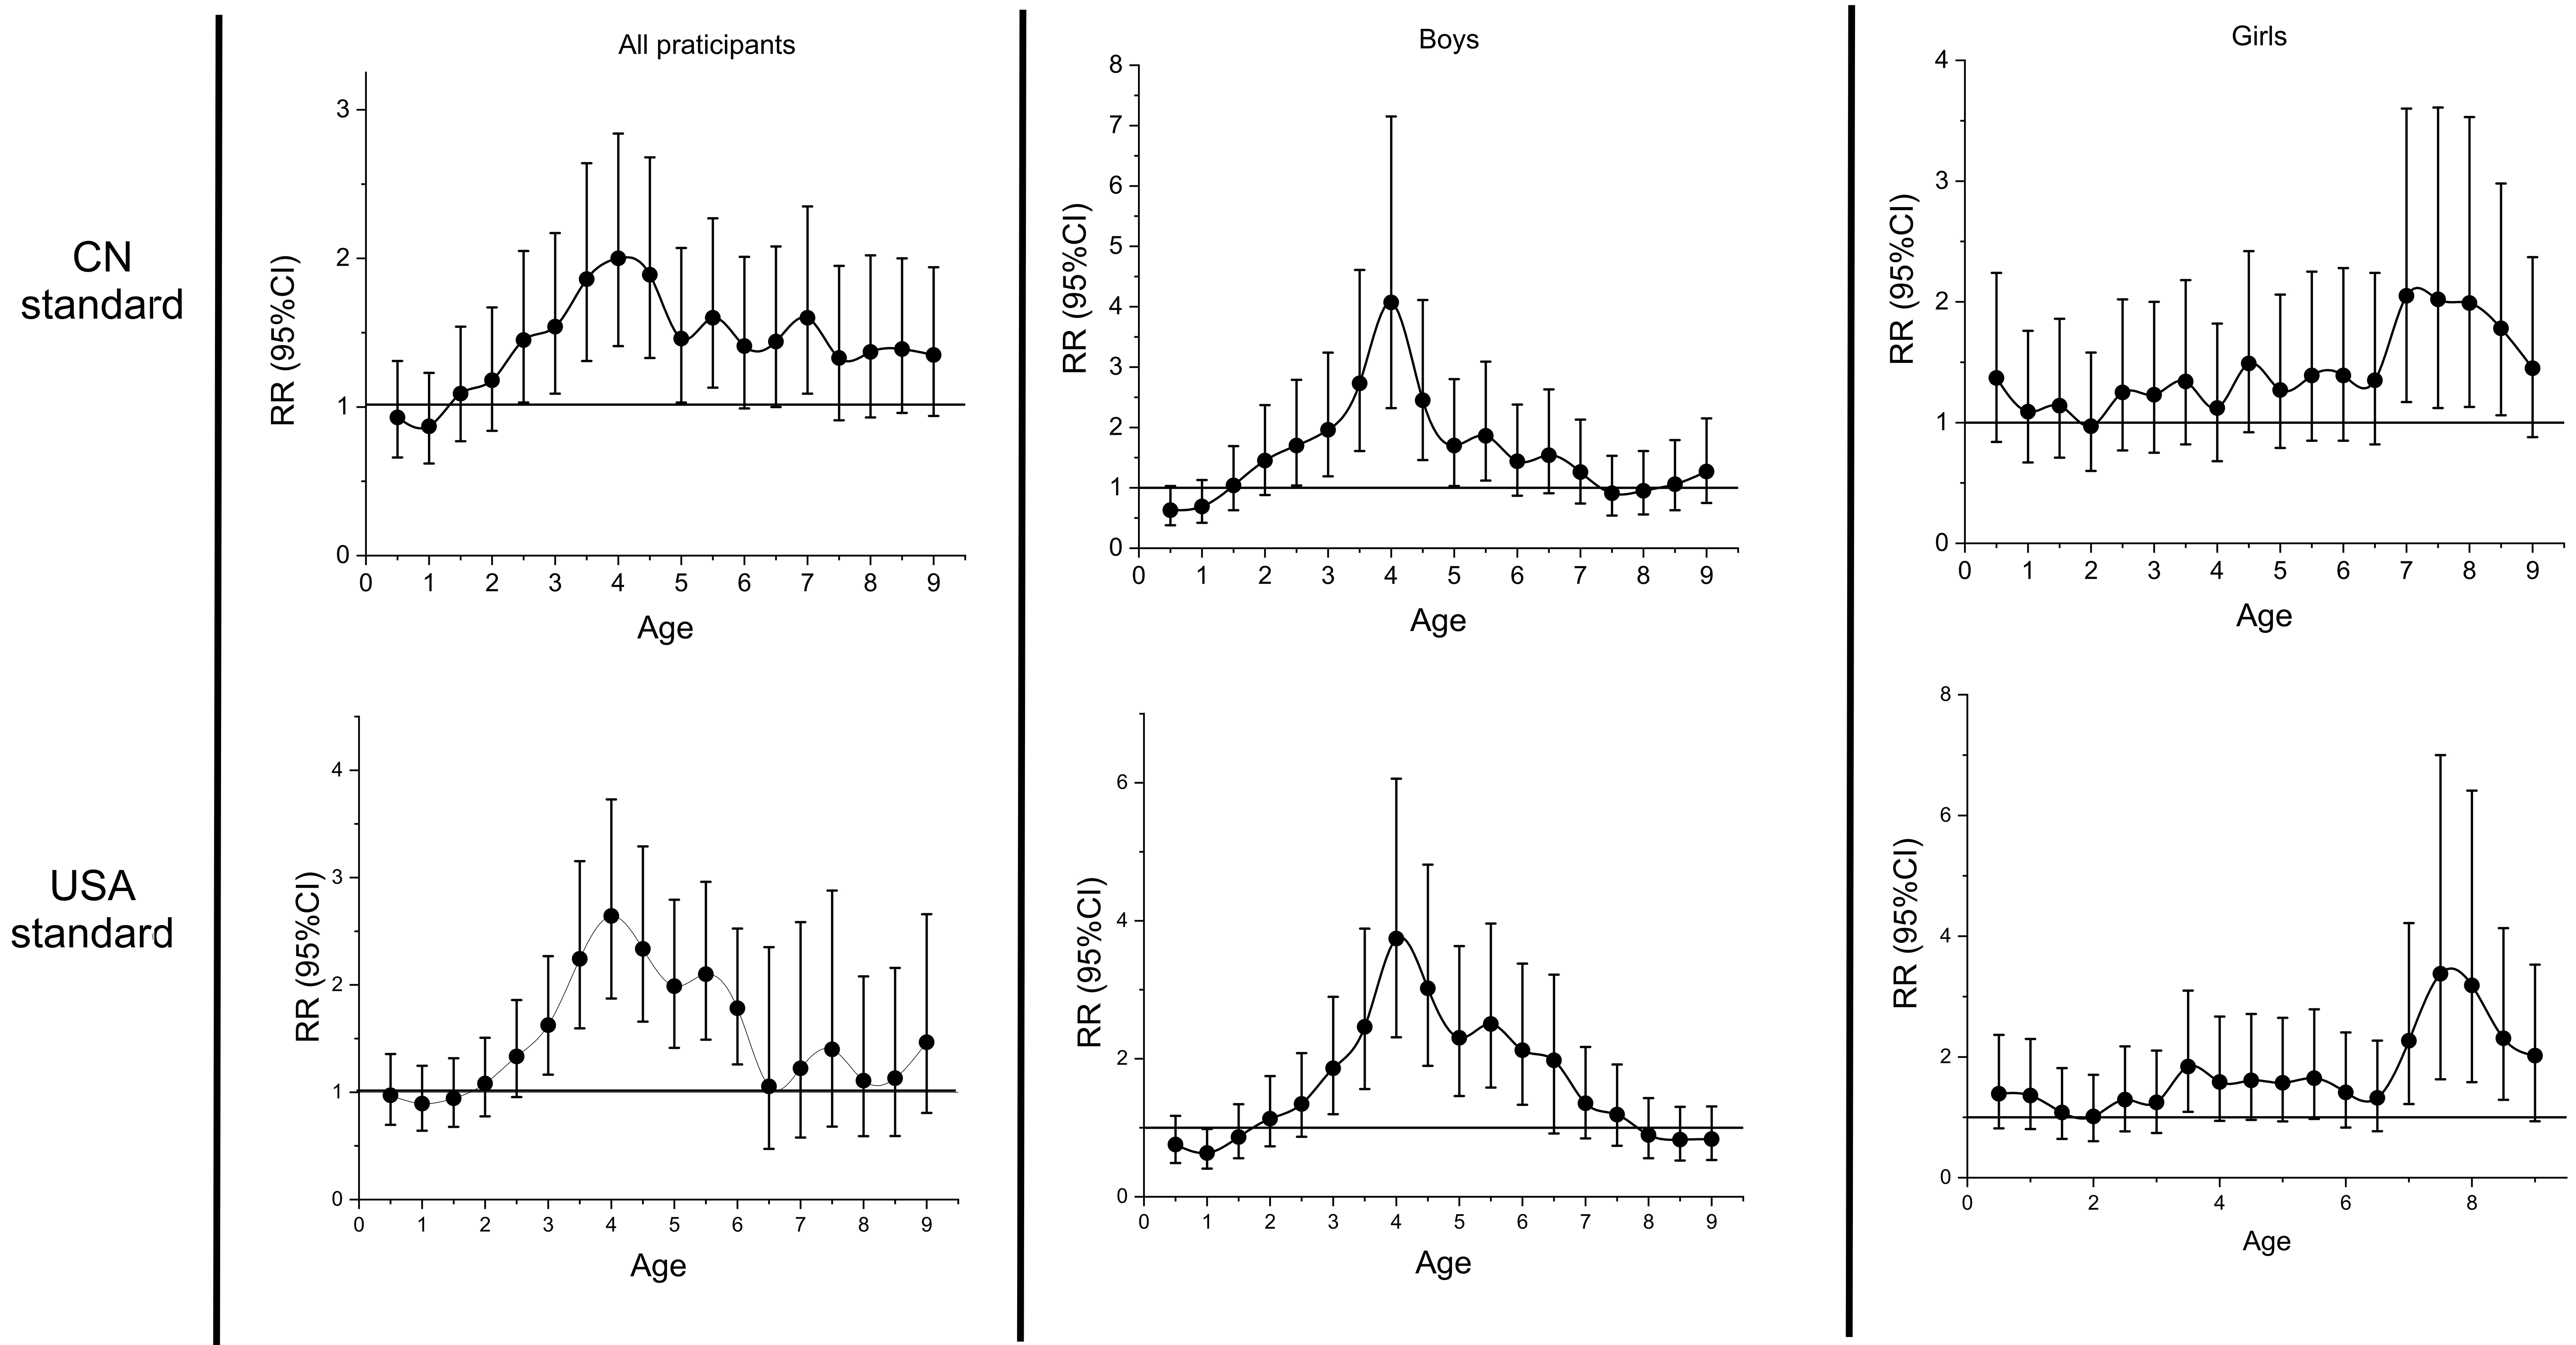
Figure 1. Identification of the Sensitive Period of Overweight/Obesity on Childhood High Blood Pressure. The associations between the linear slope at each time point and the incidence of HBP in the final survey were estimated by calculating the RR value. If the lower limit of the 95%CI of the RR value exceeded 1, we considered that the change in BMI Z-score at this time point was sensitive to HBP. BMI: Body mass index; CI: confidence interval; HBP: high blood pressure; RR: relative risk; CN: Chinese National.


