



fig4
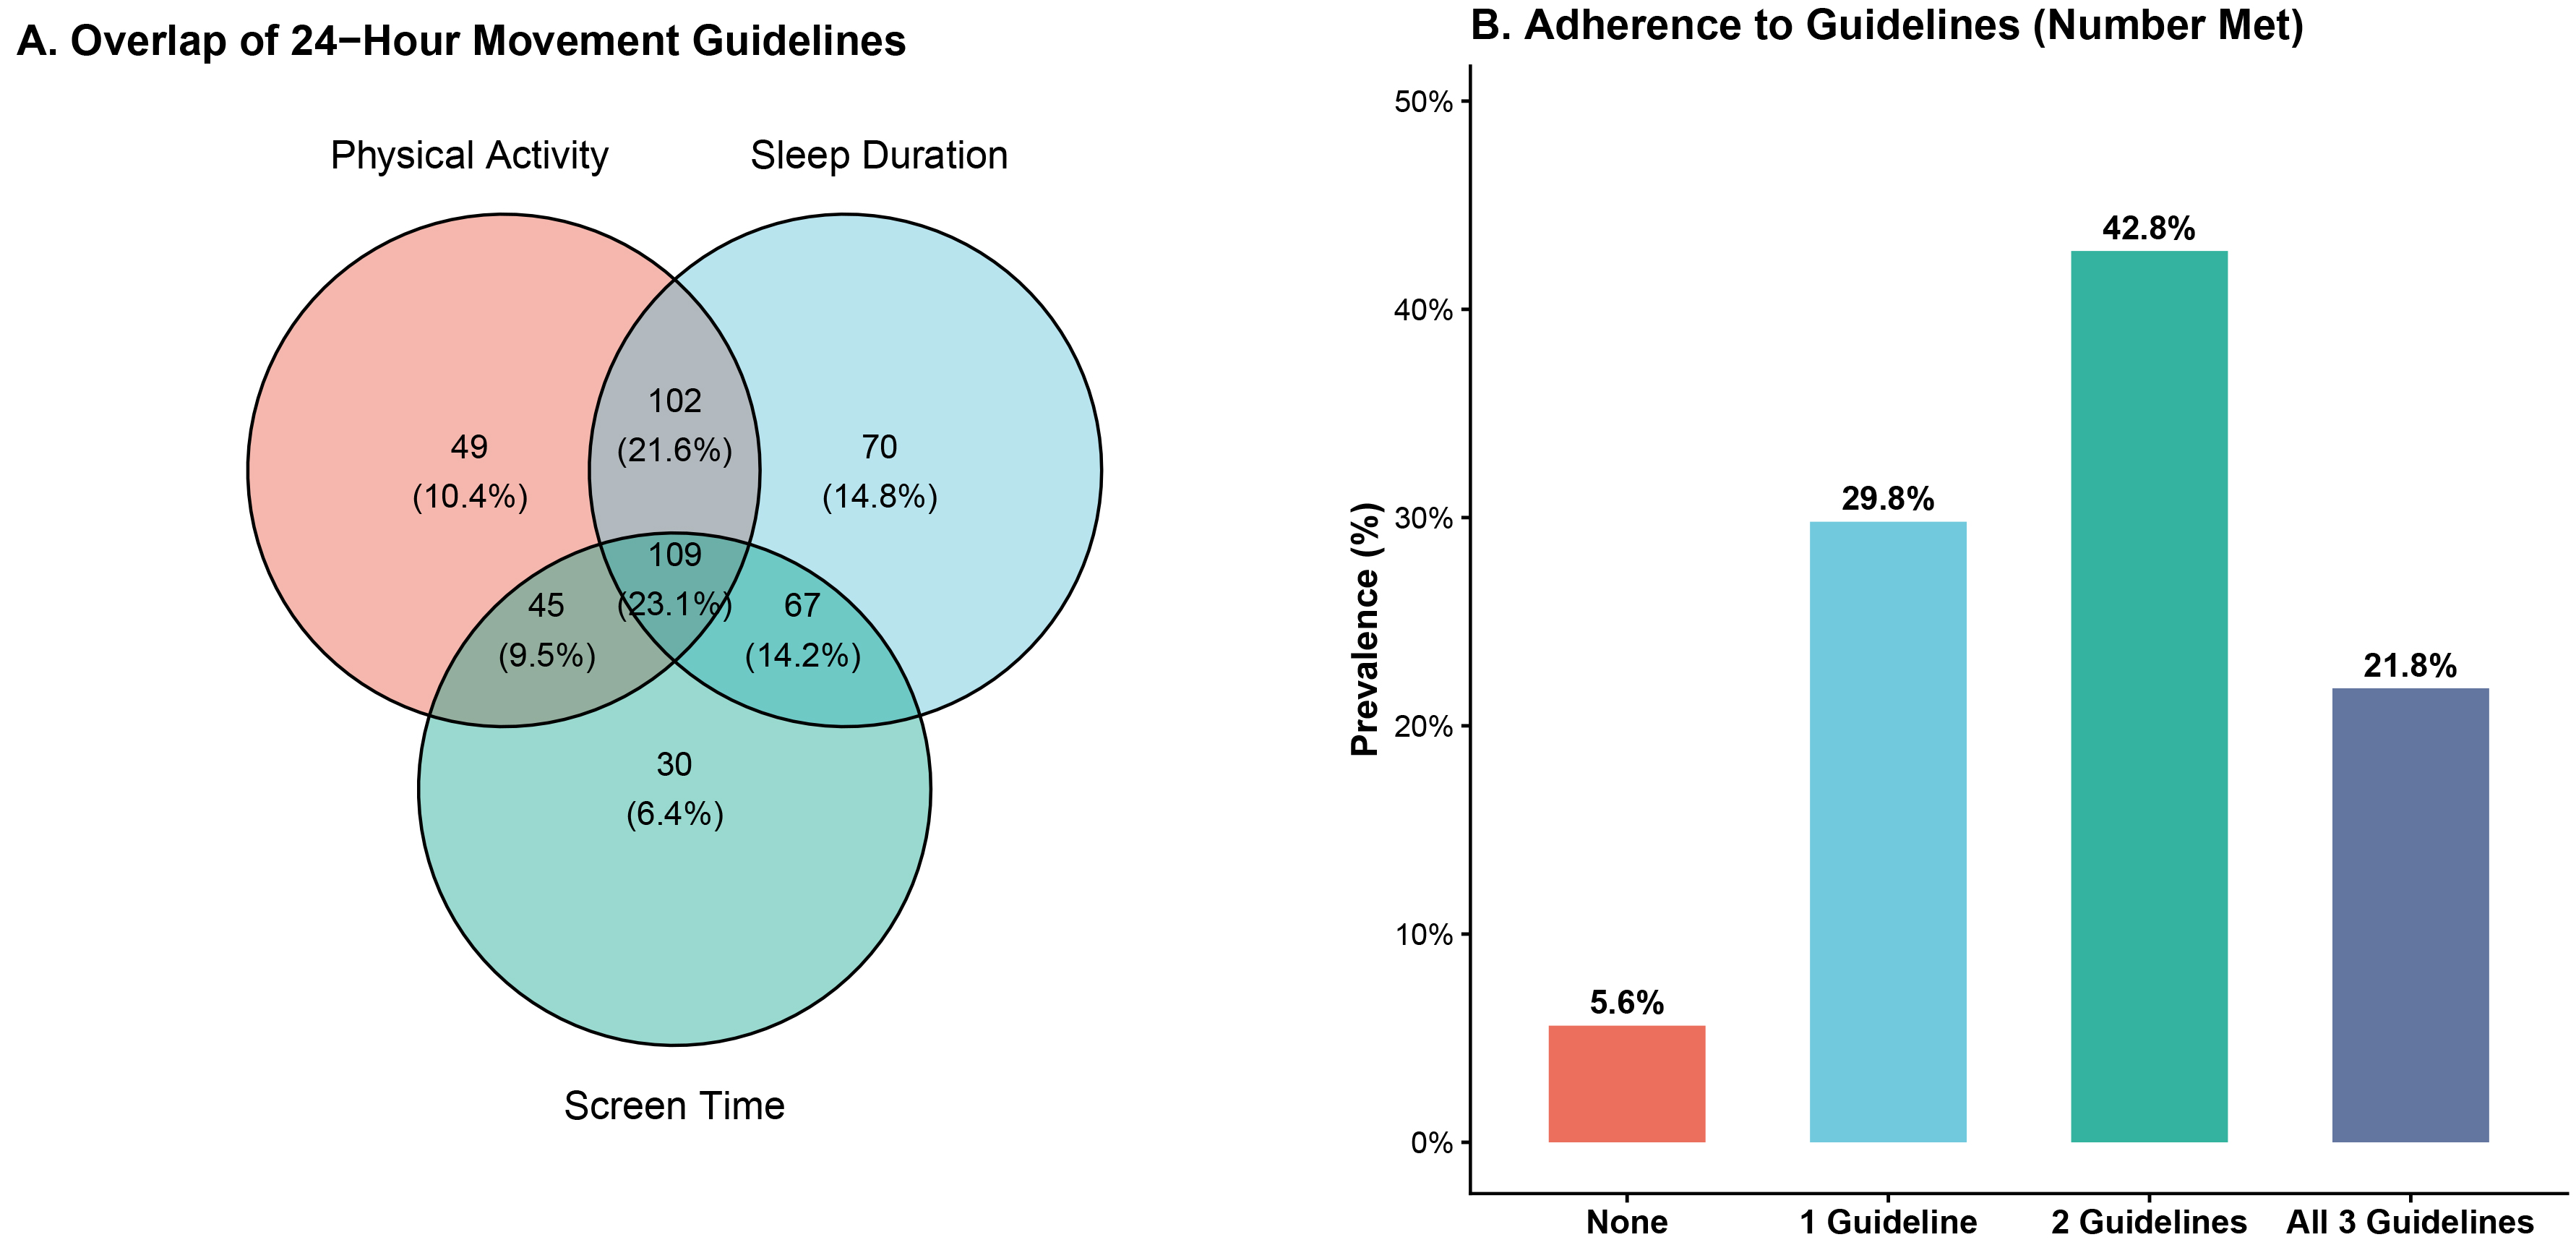
Figure 4. Distribution of adherence to the 24-h movement guidelines among participants. (A) Venn diagram showing the overlap of adherence to physical activity, recreational screen time, and sleep duration recommendations; (B) Bar chart showing the distribution of participants according to the number of 24-h movement guideline components met. Participants were classified according to the number of recommendations met (0-3), including physical activity, recreational screen time, and sleep duration.





