



fig3
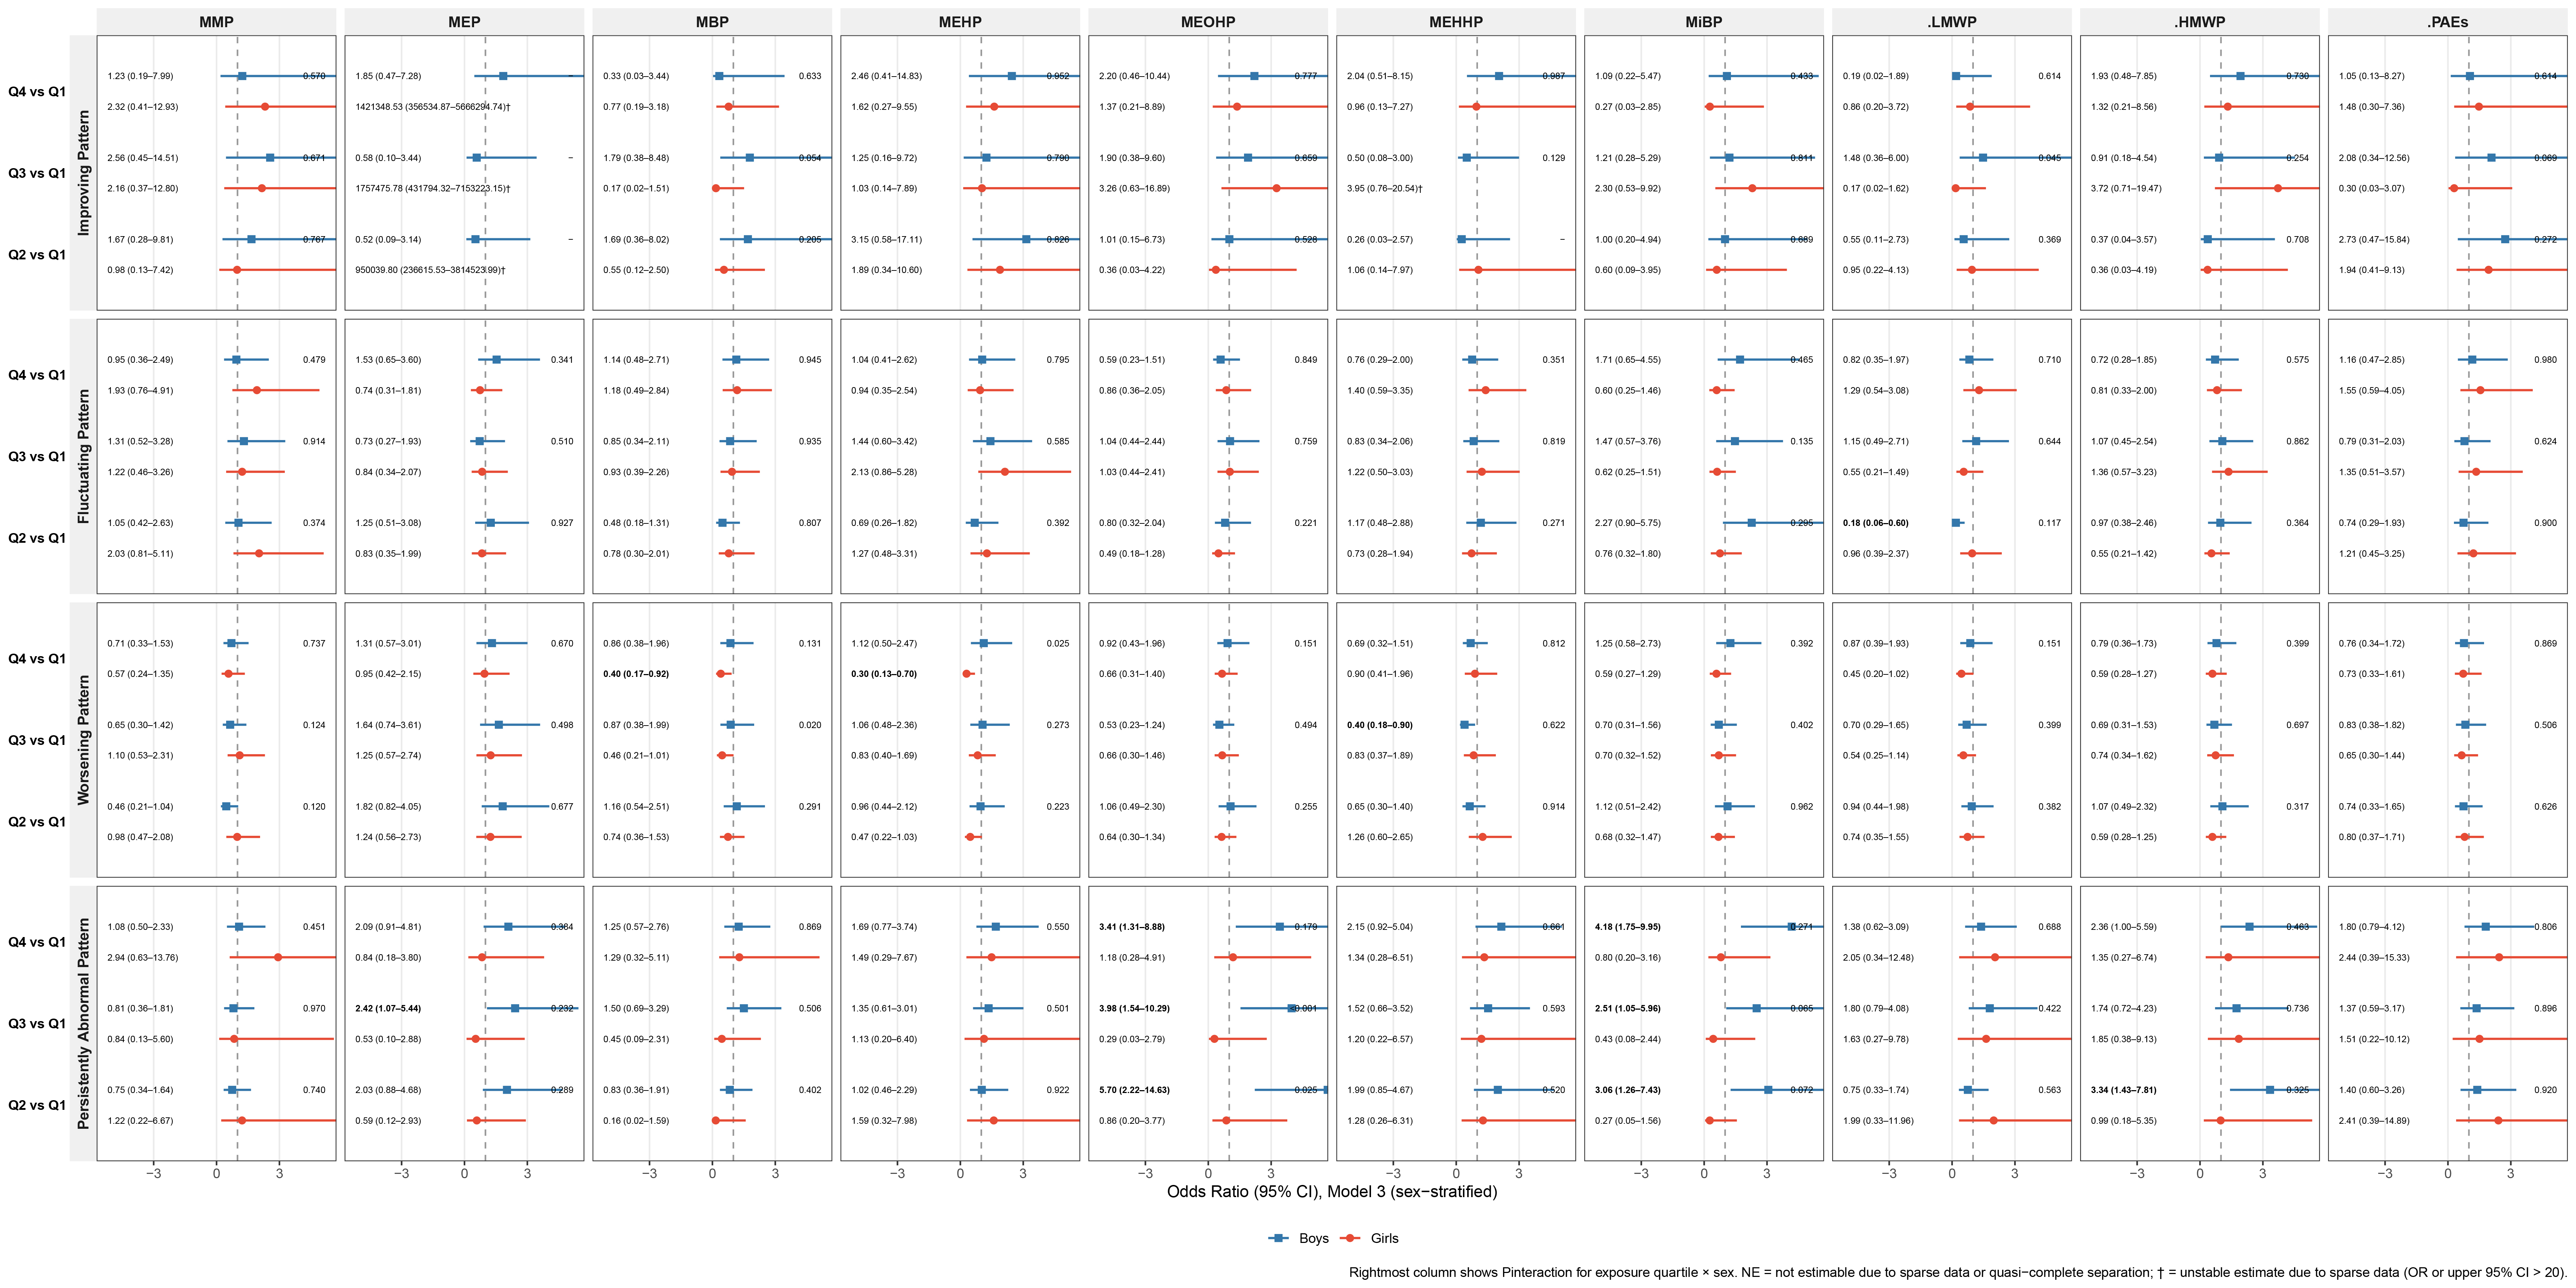
Figure 3. Sex-stratified associations between phthalate exposure and cardiometabolic risk progression patterns. Sex-stratified analyses based on multinomial logistic regression models (Model 3). Model 3 was adjusted for age, residence, parental educational attainment, only-child status, mode of delivery, and family history of cardiometabolic diseases. Phthalate exposures were categorized into quartiles. OR: Odds ratio; CI: confidence interval; MEP: monoethyl phthalate; MBP: mono-n-butyl phthalate; MEHP: mono-2-ethylhexyl phthalate; MEOHP: mono-2-ethyl-5-oxohexyl phthalate; MEHHP: mono-2-ethyl-5-hydroxyhexyl phthalate; MiBP: monoisobutyl phthalate; ∑LMWP: sum of low-molecular-weight phthalates; ∑HMWP: sum of high-molecular-weight phthalates; ∑PAEs: sum of all measured phthalate metabolites.





