


fig2
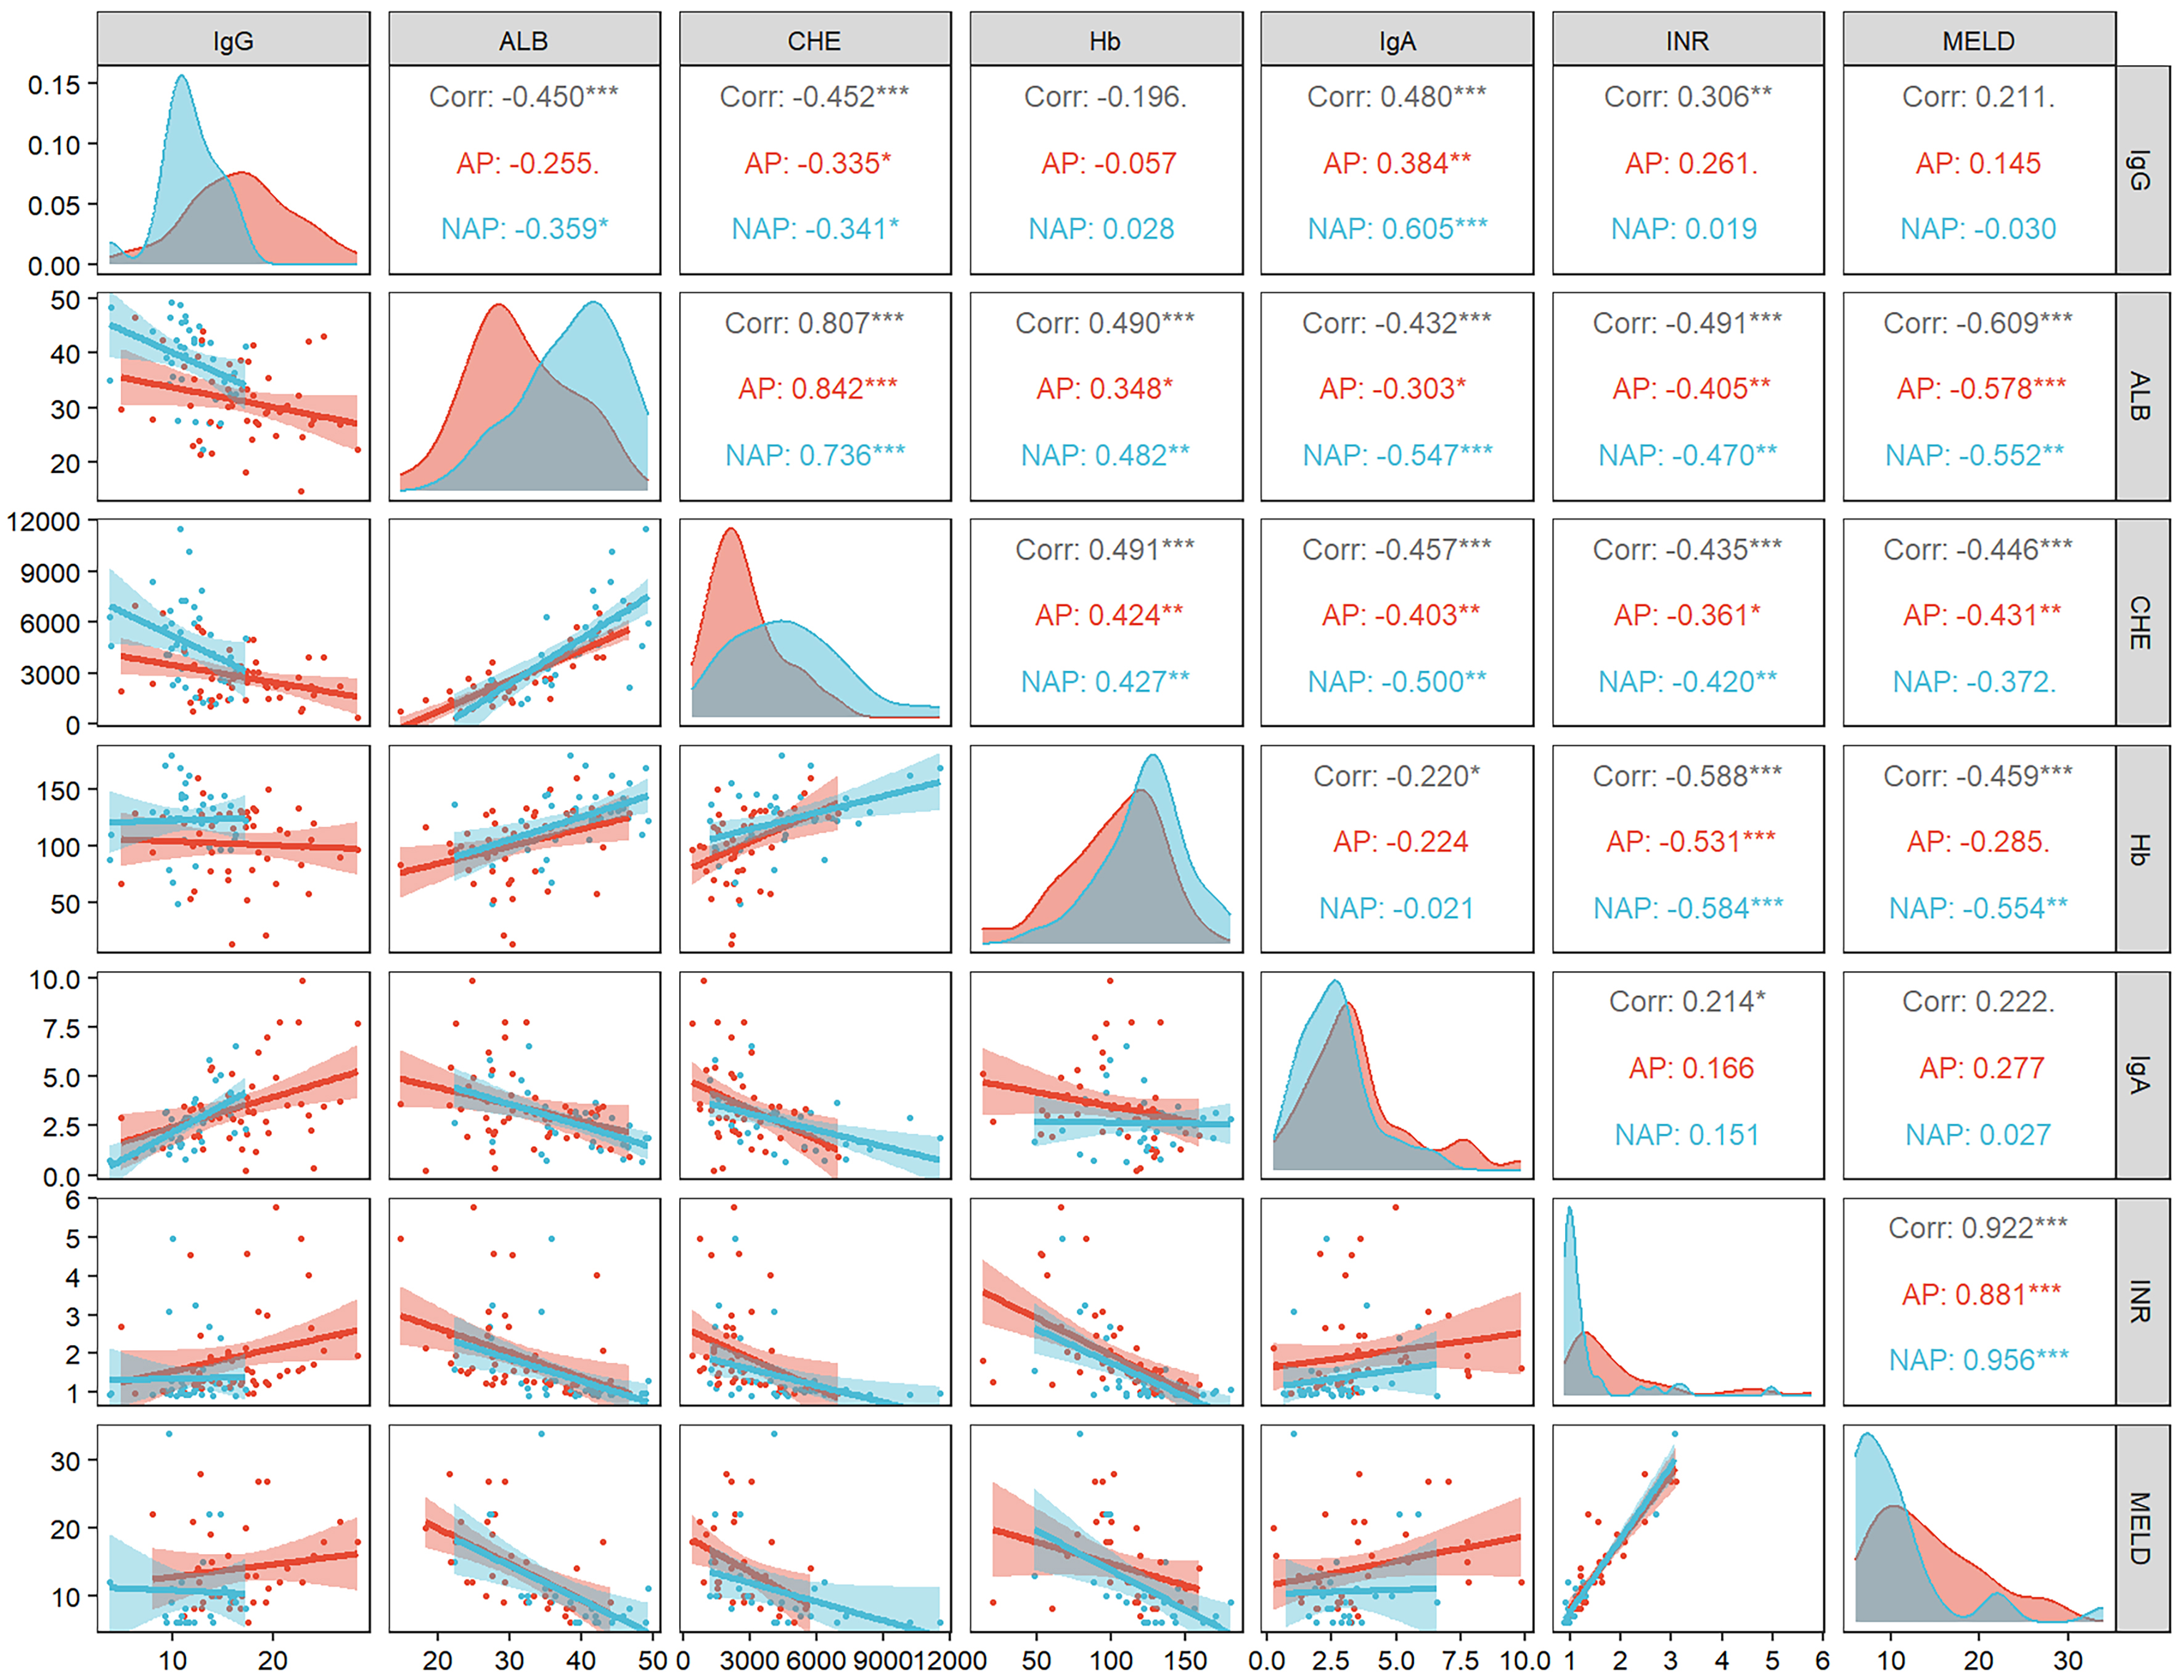
Figure 2. Correlation between IgG levels and liver function-related indicators. The number in the box is Spearman’s correlation coefficient (ρ). *P < 0.05; **P < 0.01; ***P < 0.001. Generated using R 4.3.0. AP: AP-WD group; NAP: NAP-WD group; IgG: Immunoglobulin G; ALB: albumin; CHE: cholinesterase; Hb: hemoglobin; IgA: immunoglobulin A; INR: international normalized ratio; MELD: model for end-stage liver disease; WD: Wilson’s disease.


