


fig2
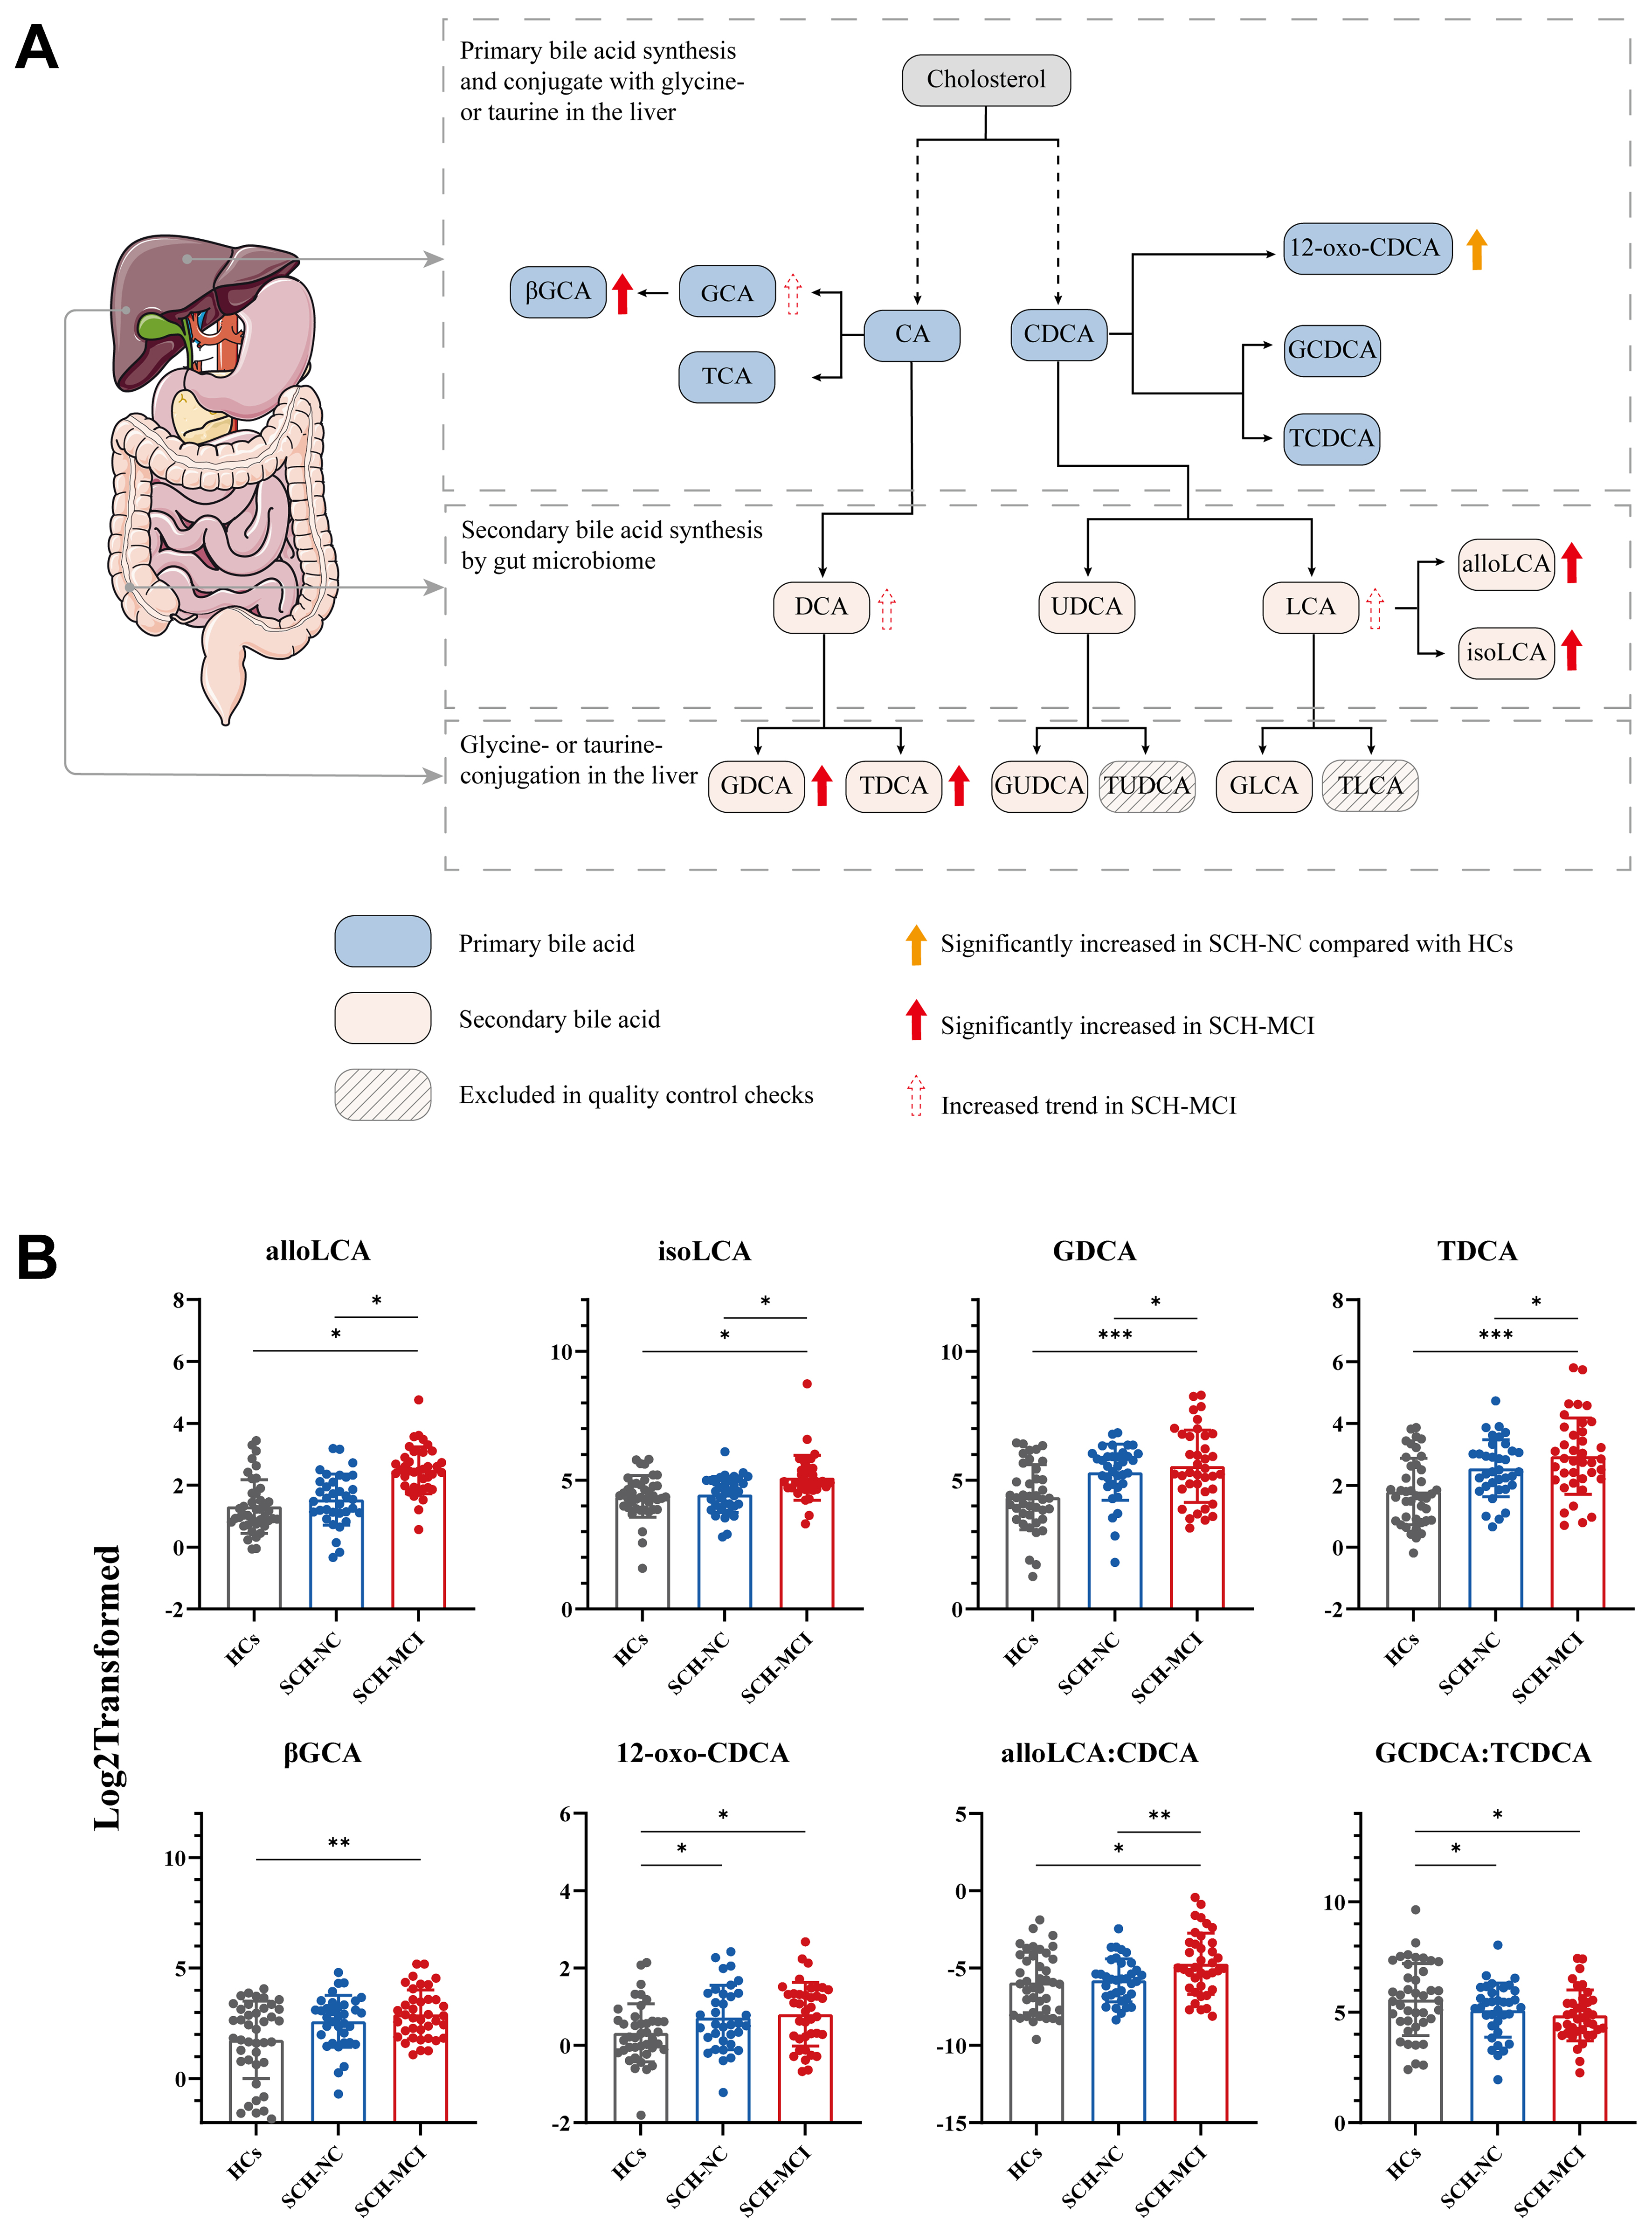
Figure 2. Comparison of alterations in plasma bile acid levels of HCs, SCH-NC, and SCH-MCI groups. (A) Bile acid synthesis pathway. The black dotted arrows indicate that the conversion of cholesterol to the primary bile acids (CA and CDCA) involves multiple enzymatic steps, rather than a direct process. The organ model shown was provided by Servier Medical Art (https://smart.servier.com), licensed under CC BY 4.0 (https://creativecommons.org/licenses/by/4.0/); (B) Inter-group differences in bile acid levels across the three groups. Data are presented mean SD. *P < 0.05, **P < 0.01, ***P < 0.001. ANOVA and the LSD post hoc test. alloLCA: Allolithocholic acid; CDCA: chenodeoxycholic acid; DCA: deoxycholic acid; GCDCA: glycochenodeoxycholic acid; GDCA: glycodeoxycholic acid; GLCA: glycolithocholic acid; GUDCA: glycoursodeoxycholic acid; HCs: healthy controls; isoLCA: isolithocholic acid; LCA: lithocholic acid; SCH-NC: subclinical hypothyroidism with normal cognition; SCH-MCI: subclinical hypothyroidism with mild cognitive impairment; TCDCA: taurochenodeoxycholic acid; TLCA: taurolithocholic acid; TUDCA: tauroursodeoxycholic acid; UDCA: ursodeoxycholic acid; βGCA: 3β-glycocholic acid; 12-oxo-CDCA: 12-oxochenodeoxycholic acid; LSD: least significant difference; CA: cholic acid.


