


Alterations in secondary bile acids in adult-onset subclinical hypothyroidism with mild cognitive impairment
 0
0 
Abstract
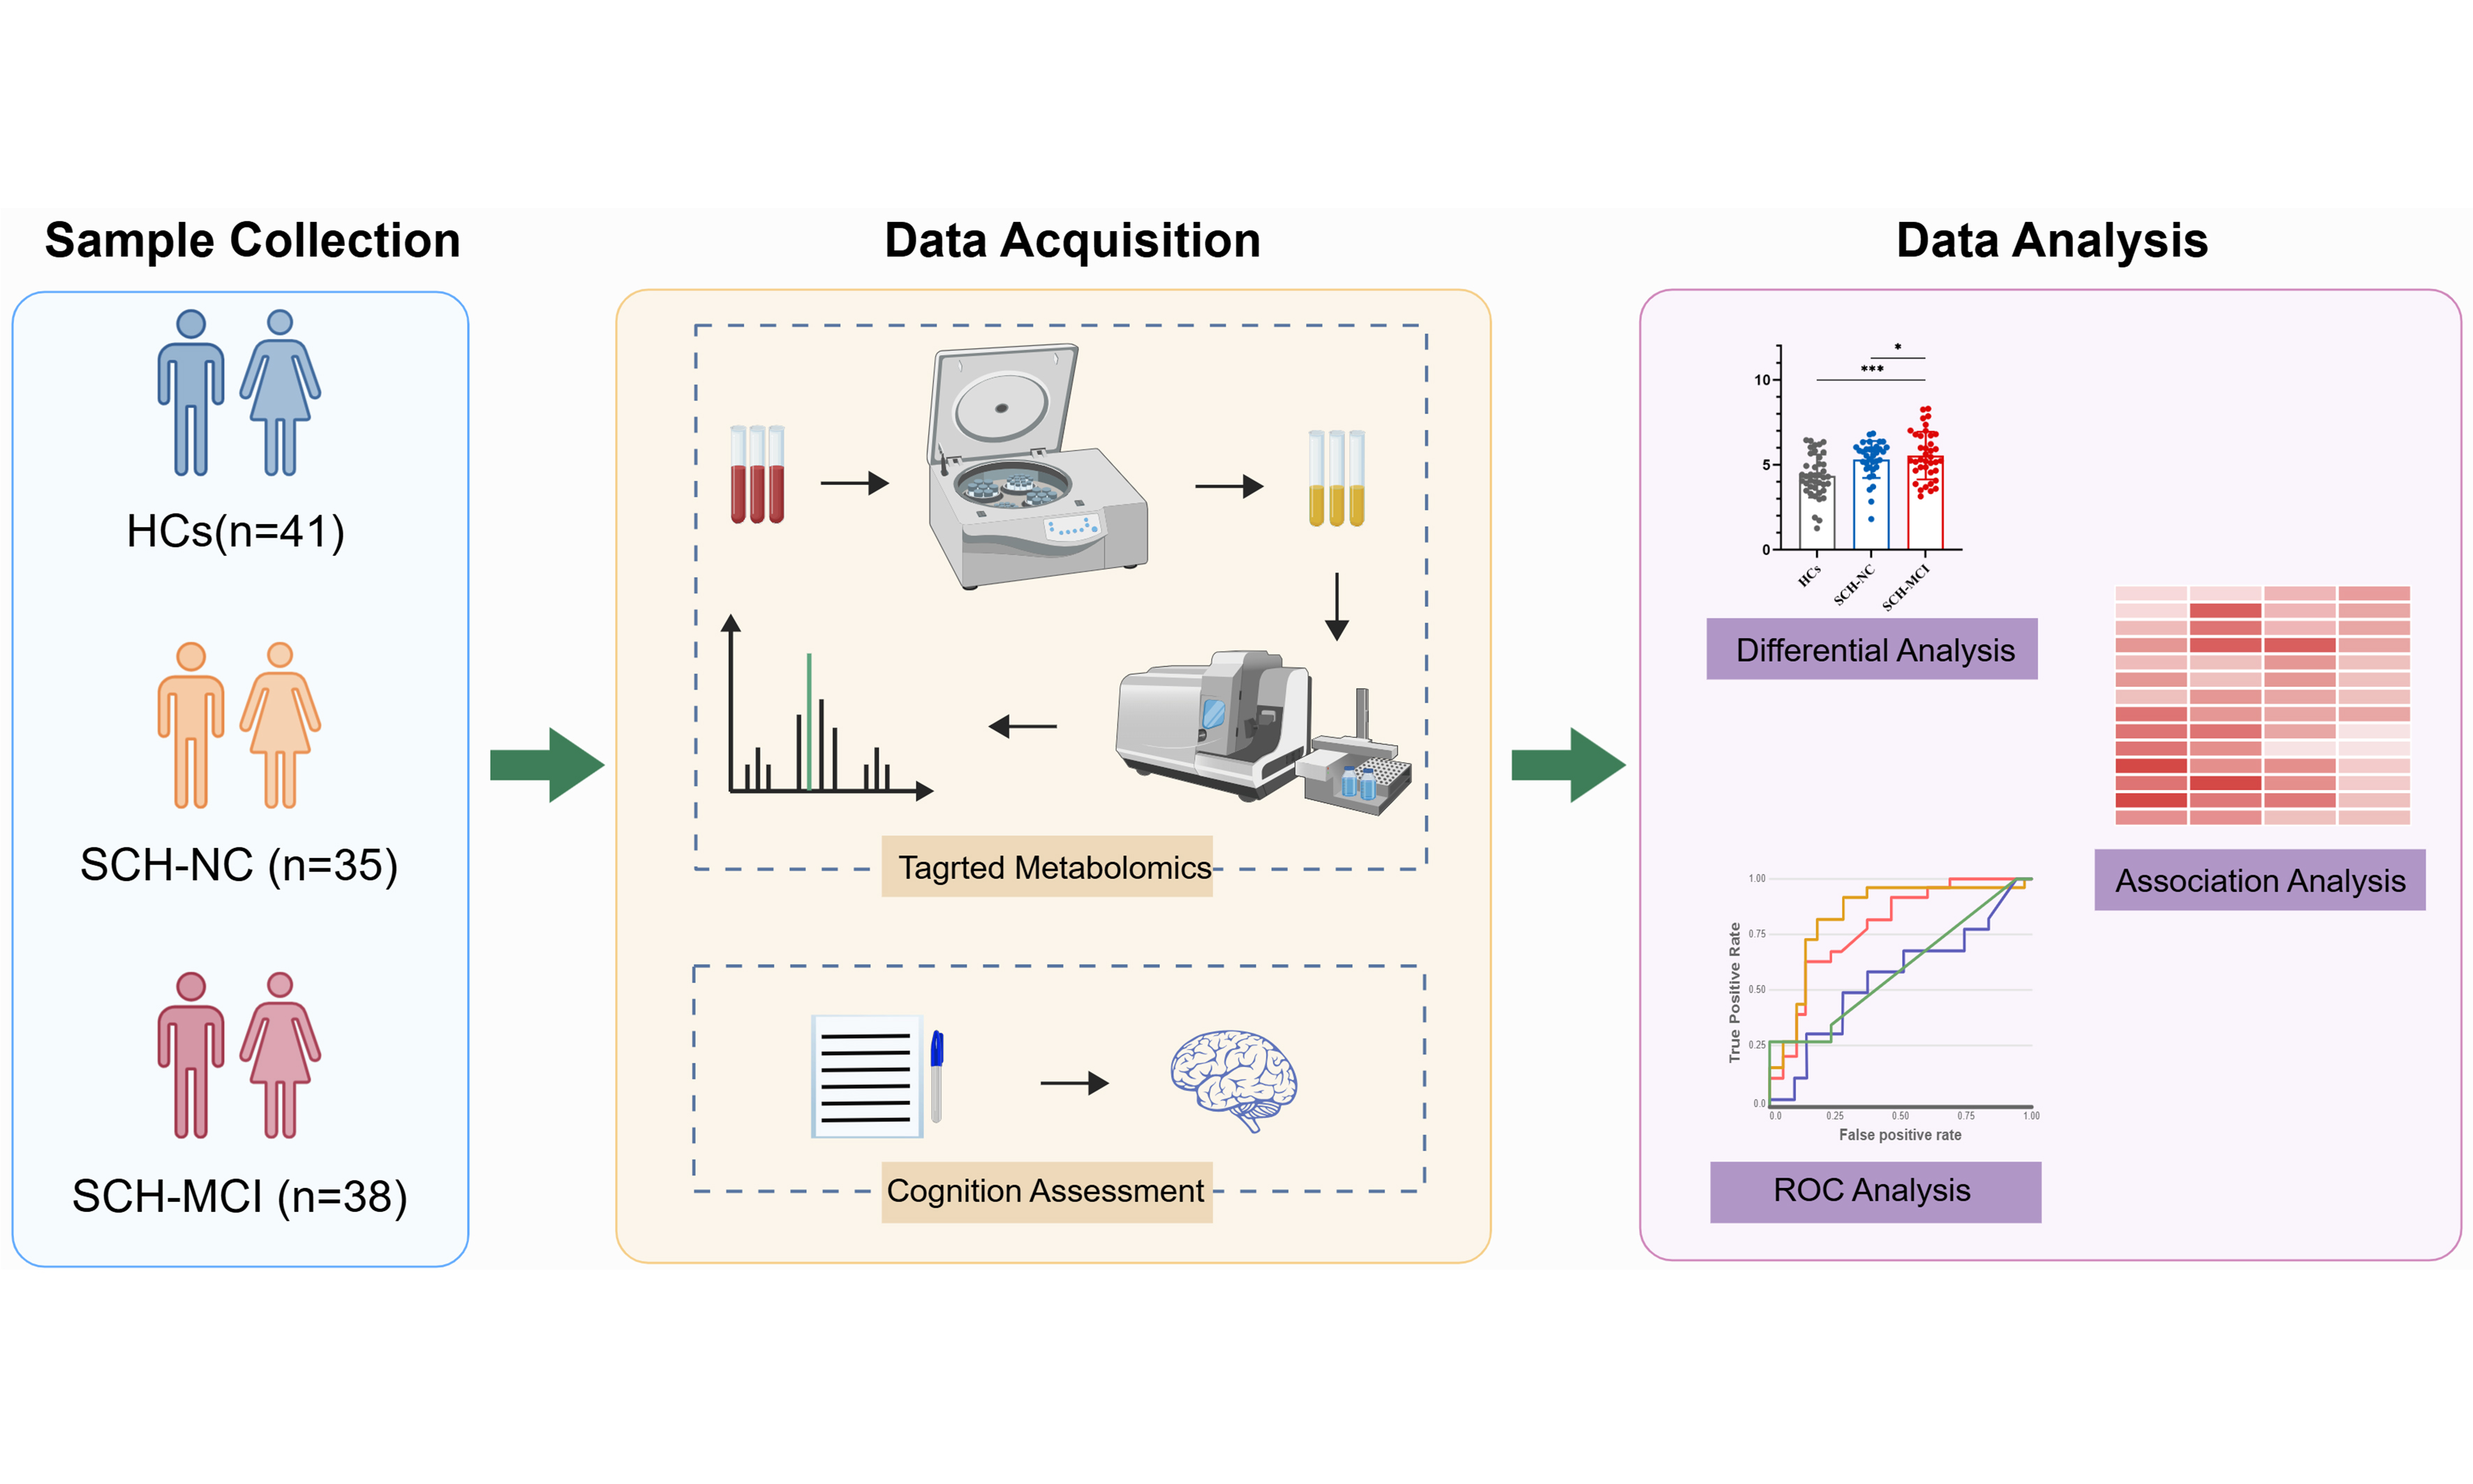
Aim: Subclinical hypothyroidism (SCH) may be associated with cognitive impairment, and disruptions in bile acid (BA) metabolism are implicated in cognitive impairment-related diseases. However, the role of BA metabolism in SCH-related mild cognitive impairment (MCI) is not well understood. This study aimed to evaluate plasma BA levels in SCH patients with and without MCI using targeted metabolomics to explore potential metabolic changes linked to cognitive impairment.
Methods: A cross-sectional observational study enrolled 38 newly diagnosed adult-onset primary SCH patients with MCI (SCH-MCI), 35 patients with normal cognition (SCH-NC), and 41 well-matched healthy controls (HCs). Cognitive function was assessed using the Montreal Cognitive Assessment (MoCA). Plasma BA levels were quantified using targeted metabolomics via liquid chromatography-tandem mass spectrometry. Analysis of variance was employed to identify differential BAs, while Spearman correlation analysis was used to evaluate relationships between differential BAs, thyroid function parameters and MoCA scores. Receiver operating characteristic (ROC) analysis was conducted to identify sensitive BA markers for distinguishing SCH-MCI from SCH-NC.
Results: SCH-MCI patients exhibited significantly elevated levels of allolithocholic acid (alloLCA), isolithocholic acid (isoLCA), glycodeoxycholic acid, taurodeoxycholic acid, and the ratio of alloLCA to chenodeoxycholic acid compared to SCH-NC patients. Negative correlations were found between alloLCA, isoLCA and MoCA scores. ROC analysis indicated that alloLCA and isoLCA could differentiate SCH-MCI from SCH-NC with high diagnostic accuracy.
Conclusion: Our study suggests that altered plasma secondary BA levels in SCH-MCI are negatively associated with cognitive function, highlighting the potential role of BA metabolism in SCH-related cognitive impairment.
Keywords
INTRODUCTION
Subclinical hypothyroidism (SCH) is considered the earliest stage of hypothyroidism, characterized by elevated serum thyroid-stimulating hormone (TSH) levels alongside normal free thyroxine (FT4) levels[1], and affects over 10% of the population[2]. SCH may be correlated with cognitive impairment, and patients may exhibit symptoms such as inattentiveness, short-term memory loss and reduced learning ability[3-6]. Additionally, serum TSH levels have been found to negatively correlate with cognitive function test scores[7]. A meta-analysis study further supported the relationship between cognitive decline and SCH patients younger than 75 years[8]. While cognitive decline of SCH is increasingly recognized, the underlying mechanisms remain poorly understood.
Recent research has begun to explore metabolic factors, including the role of bile acids (BAs) in cognitive dysfunction[9-11]. BAs, the end metabolites of cholesterol, are categorized into primary and secondary BAs and play significant roles in multiple physiological processes, including cholesterol conversion[12], energy metabolism[13], and regulation of gut microbiota[14]. Primary BAs, including cholic acid (CA) and chenodeoxycholic acid (CDCA), are synthesized from cholesterol in the liver via classical or alternative pathways. These primary BAs are then stored in the gallbladder and released into the intestine following food intake[15]. Secondary BAs are synthesized from primary BAs by gut microbiota through various biological processes[16]. Over the years, emerging studies have indicated a potential connection between altered BA metabolism and cognitive dysfunction diseases, such as mild cognitive impairment (MCI), Alzheimer’s disease, and Parkinson’s disease[17-21]. Notably, elevated levels of secondary BAs, such as deoxycholic acid (DCA) and lithocholic acid (LCA), have been observed in MCI and Alzheimer’s disease and are closely associated with cognitive decline[17,21,22]. Additionally, Chen et al. found that patients suffering from Parkinson’s disease had significantly higher glycodeoxycholic acid (GDCA) levels[23]. Increased concentrations of CA and CDCA were also detected in Parkinson’s disease patients with MCI[19].
BA metabolism disturbances have also been observed in SCH patients across several studies[24-26]. Recently, our metabolomics study revealed significant dysregulation in BA metabolic pathways, with a marked decrease in plasma CA levels in SCH patients compared to euthyroid controls[25]. Another cross-sectional study reported a significant reduction in total BA levels in SCH patients[26]. However, few studies have specifically investigated whether changes in BA metabolism contribute to cognitive impairment in SCH.
In this study, we included newly diagnosed, untreated SCH patients with and without MCI, as well as healthy controls (HCs), and employed targeted metabolomics to quantitatively determine plasma BA levels. We aimed to investigate alterations in BA levels between SCH patients with MCI and those without MCI, and to explore the relationship between altered BAs and cognitive function in SCH patients. Therefore, our investigation into whether changes in BA metabolism contribute to cognitive dysfunction in SCH could provide new insights into the underlying mechanisms.
METHODS
Participants
Participants were recruited from the outpatient department of the Endocrinology Department of Gansu Provincial Hospital between October 2019 and December 2023. The diagnosis of SCH was according to the Guidelines for Diagnosis and Management of Hypothyroidism in Adults (2017 Edition)[27]. In detail, SCH was diagnosed when TSH levels were above the reference range (0.35-4.94 mIU/L) in combination with FT4 levels within the normal reference range (9.01-19.05 pmol/L). Over the same period, HCs, matched for age, sex, and years of education, were also recruited from the surrounding communities.
All participants met the following criteria: (1) Age between 18 and 60 years; (2) A minimum of 6 years of education (to ensure participants could independently complete cognitive function assessments); and (3) Chinese Han ethnicity. The exclusion criteria were as follows: (1) Pregnancy or breastfeeding, or obesity [body mass index (BMI) ≥ 28 kg/m2]; (2) A history of neurological or psychiatric disorders; (3) Organic lesions of the central nervous system; (4) History of or current illness, especially known metabolic diseases (e.g., prediabetes, diabetes, hyperuricemia or gout, cardiovascular diseases or some other chronic diseases, such as gastrointestinal or hepatic diseases); (5) Autoimmune diseases except for thyroid autoimmune disease; (6) Cancers; and (7) History of current medications use (e.g. antithyroid drugs, levothyroxine, lipid medications, or corticosteroids). All subjects underwent magnetic resonance imaging scanning to exclude any cognitive impairment caused by anatomic abnormality. The study was approved by the Ethics Committee of the Gansu Provincial Hospital (Registration Numbers: 2019-196, 2023-500). Informed consent was obtained from all participants before the study.
Clinical and laboratory measurements
This study comprised 114 participants: 41 HCs, 35 patients with normal cognition (SCH-NC), and 38 patients with MCI (SCH-MCI). Clinical data were collected from all participants, including age, sex, years of education, body weight, and height. Fasting venous blood samples were obtained at 8:00 AM. Serum TSH, thyroxine (T4), triiodothyronine, FT4, and free triiodothyronine were measured using a chemiluminescent immunoassay based on magnetic particles (Abbott Laboratories, USA). All participants underwent at least two measurements of thyroid function (TSH, T4, and FT4) prior to cognitive assessment to confirm a stable diagnosis of SCH.
Cognitive assessment
Cognitive function was evaluated for included participants using the Montreal Cognitive Assessment Scale (MoCA; Beijing version; scores ranging from 0 to 30), with lower scores indicating poorer cognitive performance[28]. For participants with 12 or less than 12 years of education, their scores were adjusted by adding one point to reduce potential bias related to education level. A MoCA score of < 26 is considered MCI[29]. The assessment was conducted by two experienced physicians on the same day that the blood samples were collected. Based on the MoCA scores, SCH patients were classified into two groups: SCH patients with MCI (SCH-MCI, MoCA scores < 26) and SCH patients with normal cognition (SCH-NC, MoCA scores ≥ 26). All HCs had MoCA scores ≥ 26.
Sample preparation
Fasting blood samples were collected in ethylene diamine tetraacetic acid (EDTA)-coated tubes and plasma was immediately separated from the blood samples by centrifugation at 3,000 r/min for 6 min and stored at -80 °C for later analysis. A 50 μL plasma sample was extracted using 200 μL of a methanol/acetonitrile mixture. 10 μL of an internal standard mixed solution was added for quantification purposes. The sample was then placed at -20 °C for 10 min to precipitate proteins. Following this, the sample was centrifuged at 12,000 r/min for 10 min at 4 °C, and the supernatant was transferred to a clean plastic microtube. After centrifugation, the supernatant was concentrated using a concentrator. Subsequently, the sample was reconstituted in 100 μL of 50% methanol-water solution in preparation for analysis.
Quantification of BAs
Plasma BAs were identified using ultra-high performance liquid chromatography (UPLC, ExionLCTM AD, https://sciex.com.cn/) combined with tandem mass spectrometry (MS/MS, Applied Biosystems 6500 Triple Quadrupole, https://sciex.com.cn/). The gradient elution was applied and MS detection proceeded in negative mode. Multiple reaction monitor mode was used to enhance the sensitivity of BAs. Peak extraction and analysis were carried out using the quantitative module of Analyst V1.6.3, and MultiQuant V3.0.3 software was employed for the calculation of each analyte concentration. BAs were quantified by MetWare (http://www.metware.cn/) based on the AB Sciex QTRAP 6500 LC-MS/MS platform.
Statistical analysis
Normally distributed continuous variables were expressed as mean standard deviation and non-normally distributed continuous variables were expressed as median (upper and lower quartiles). Data with normal distribution were analyzed using analysis of variance (ANOVA) and the least significant difference (LSD) post hoc test was applied to detect intergroup differences. Non-normal distributed data were analyzed using the Kruskal-Wallis tests to evaluate differences. Chi-square test was used for categorical variables. BA concentrations among the three groups were compared using ANOVA, followed by LSD post hoc test. Spearman correlation analyses were conducted to examine the relationship among differential BA levels, laboratory variables and MoCA scores in SCH patients. Receiver operating characteristic (ROC) analysis was applied to assess the discriminant ability of differential BAs for SCH with or without MCI. P < 0.05 was considered statistically significant. R software (version 4.2.1) was used to perform all statistical analyses and graphical plotting.
RESULTS
Characteristics of the enrolled participants
A total of 77 newly diagnosed SCH patients and 42 HCs were initially recruited. Two SCH patients were excluded due to missing blood samples, and one HC and two SCH patients were excluded due to incomplete cognition assessment. Consequently, 41 HCs, 35 SCH-NC, and 38 SCH-MCI patients were included in this study [Figure 1]. There were no significant differences in clinical data, including age, sex, years of education, and BMI, across the three groups. Both the SCH-NC and SCH-MCI groups exhibited higher TSH levels and lower T4 and FT4 levels compared to the HCs. No significant differences were observed in the remaining laboratory variables.
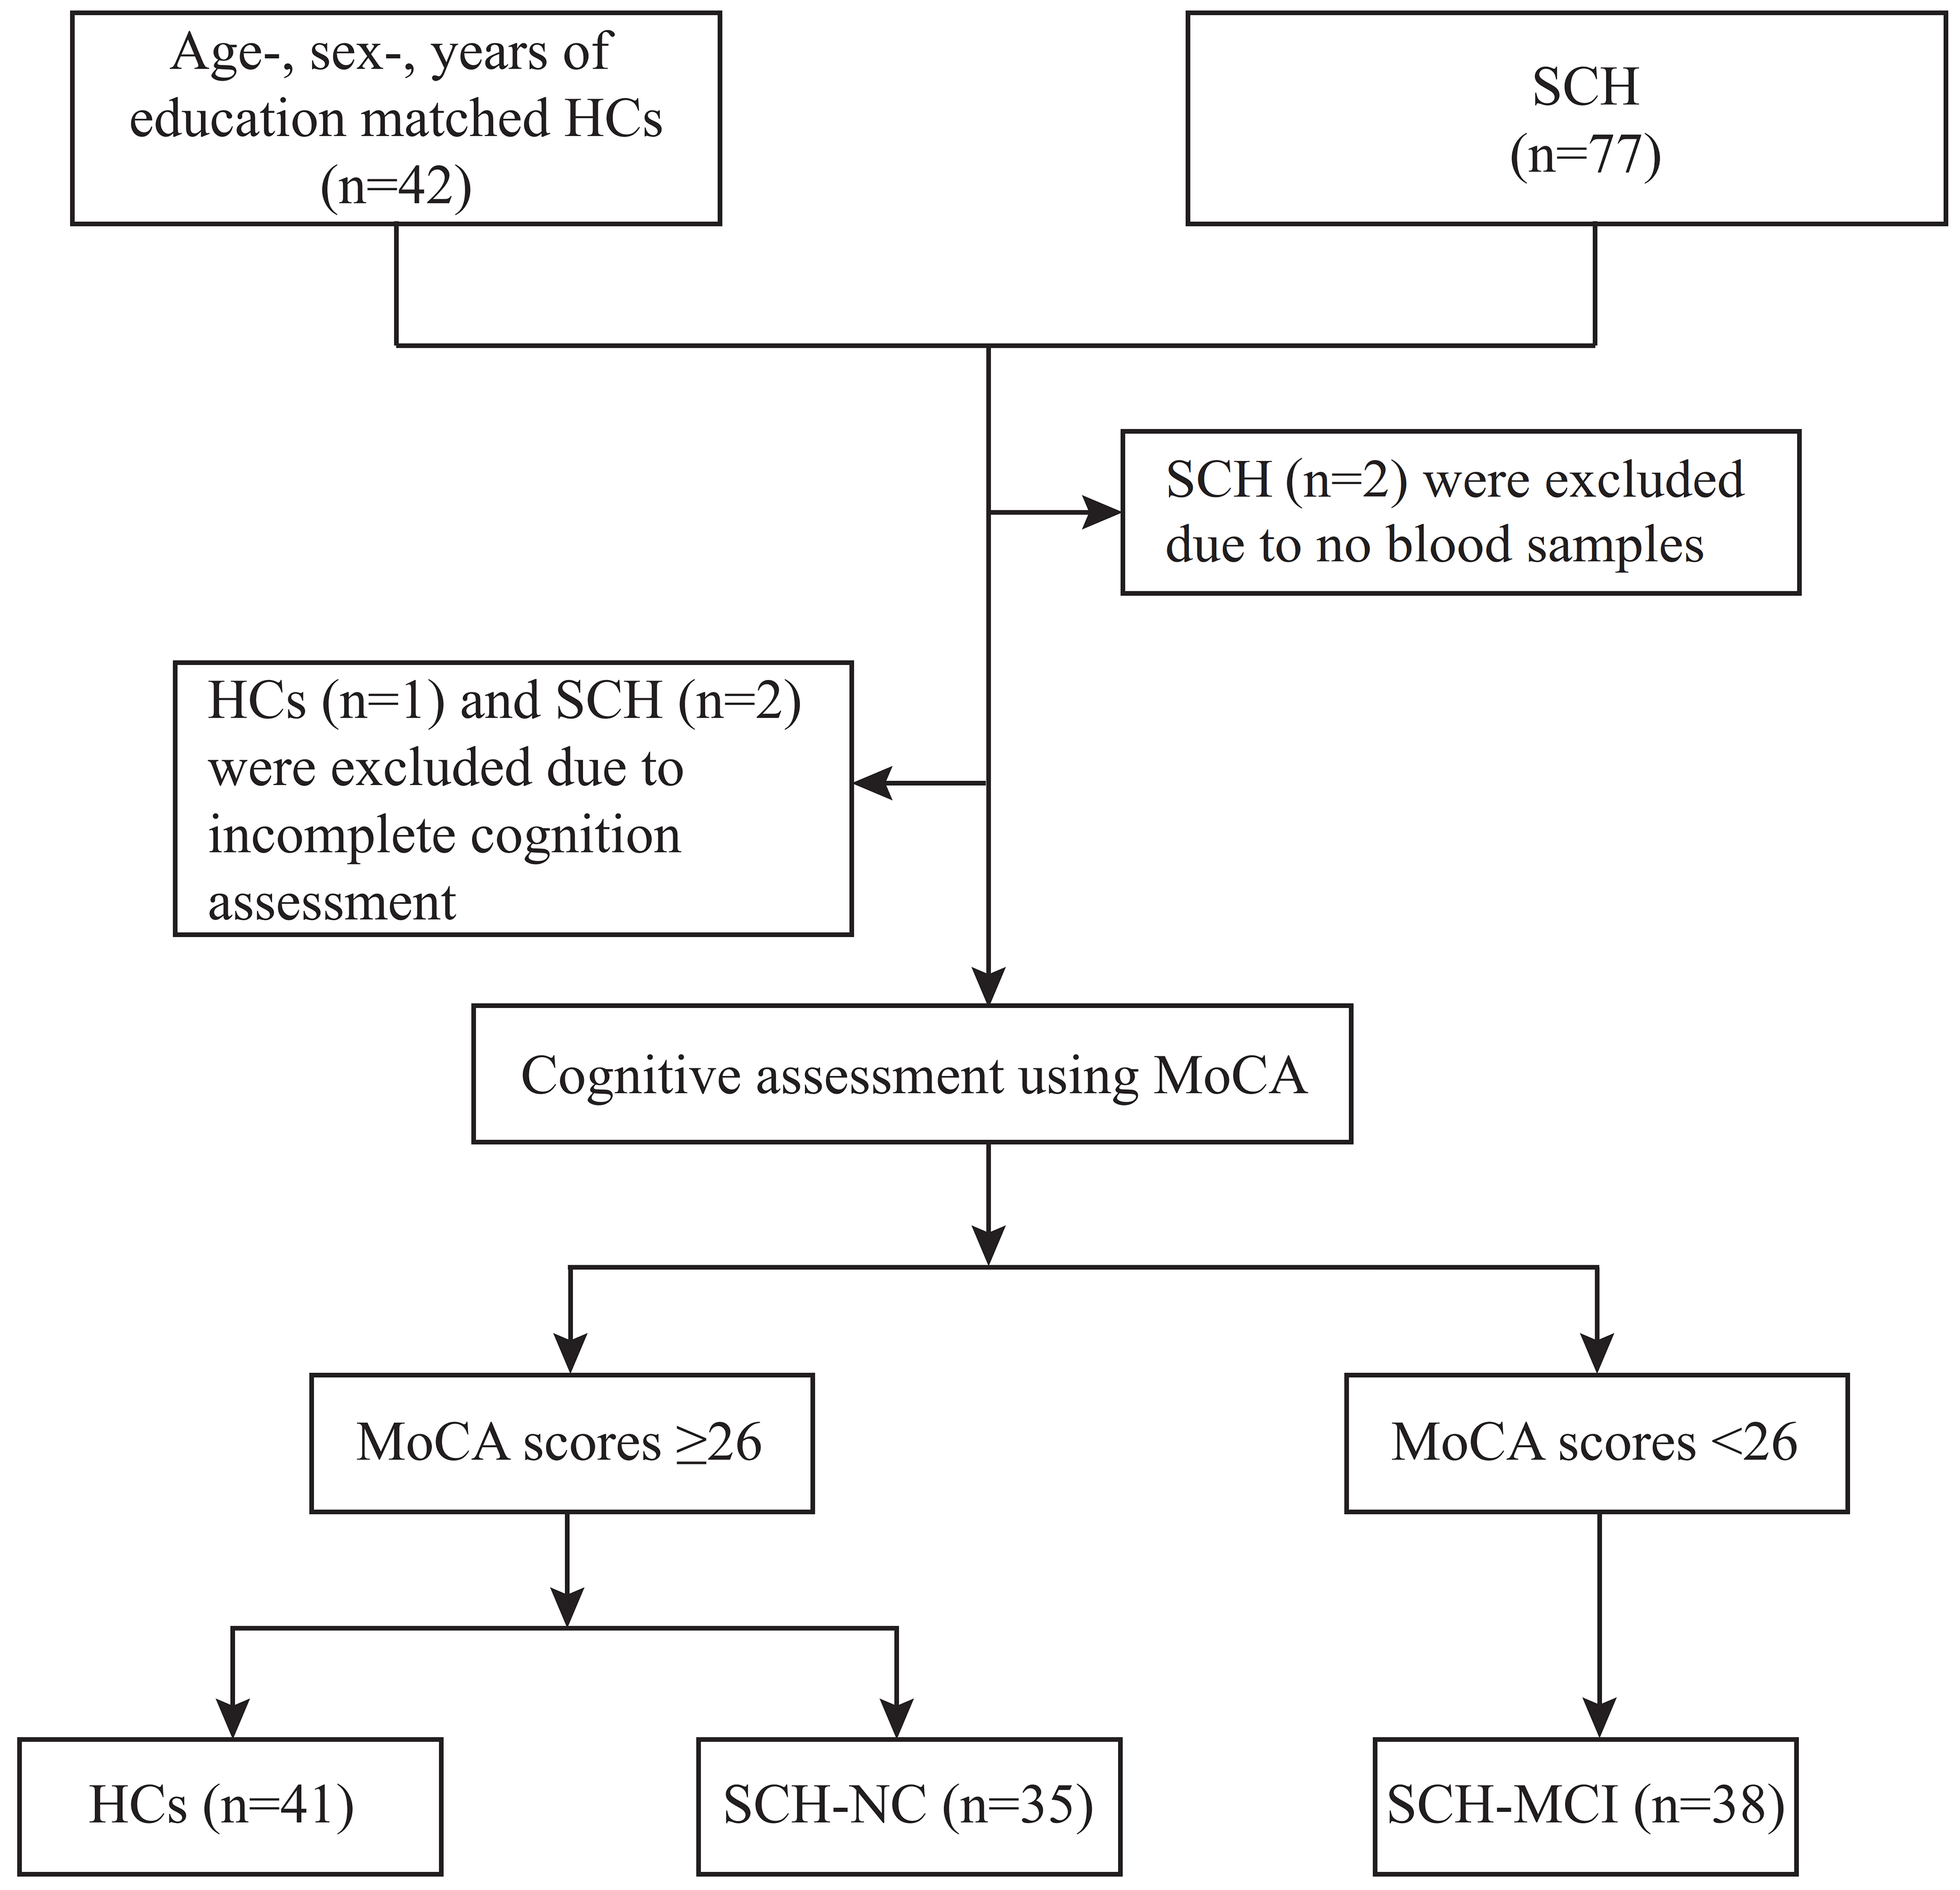
Figure 1. A Flowchart of subject selection. HCs: Healthy controls; MoCA: Montreal Cognitive Assessment Scale; SCH-NC: subclinical hypothyroidism with normal cognition; SCH-MCI: subclinical hypothyroidism with mild cognitive impairment.
Assessment of cognitive function
Cognitive assessment presented significant differences in MoCA scores across the three groups. The SCH-MCI group exhibited lower MoCA scores than both the HCs and SCH-NC groups, especially in visuospatial/executive function, naming, attention, language, abstraction, and delayed recall subitems [Table 1].
Baseline characteristics of HCs, SCH-NC, and SCH-MCI groups
| Characteristics | HCs (n = 41) | SCH-NC (n = 35) | SCH-MCI (n = 38) | Statistic values | P values |
| Clinical data | |||||
| Age, years | 39.44 ± 10.01 | 39.23 ± 9.91 | 41.45 ± 10.21 | 0.560 | 0.573 |
| Sex, n (%) | |||||
| Male | 10 (24.39) | 8 (22.86) | 8 (21.05) | 0.125 | 0.939 |
| Female | 31 (75.61) | 27 (77.14) | 30 (78.95) | ||
| Education, years | 14.41 ± 2.97 | 15.17 ± 1.87 | 14.37 ± 2.31 | 1.223 | 0.298 |
| BMI, kg/m2 | 23.67 (20.18, 25.34) | 21.91 (19.82, 23.59) | 22.37 (20.81, 24.22) | 1.737 | 0.419 |
| Laboratory measurements | |||||
| TSH, mIU/L | 1.91 (1.21, 2.58) | 11.51 (8.23, 21.07)a | 10.70 (8.49, 15.64)a | 78.219 | < 0.001 |
| T3, nmol/L | 1.57 ± 0.24 | 1.58 ± 0.23 | 1.53 ± 0.25 | 0.513 | 0.600 |
| T4, nmol/L | 97.18 ± 13.13 | 78.33 ± 18.20a | 79.50 ± 19.61a | 15.020 | < 0.001 |
| FT3, pmol/L | 4.67 ± 1.55 | 4.30 ± 0.67 | 4.33 ± 0.47 | 1.536 | 0.220 |
| FT4, pmol/L | 12.93 ± 1.93 | 10.94 ± 1.45a | 10.95 ± 2.15a | 14.580 | < 0.001 |
| MoCA | |||||
| Visuospatial/executive function | 4.59 ± 0.71 | 4.29 ± 0.79 | 3.24 ± 0.94a,b | 29.128 | < 0.001 |
| Naming | 2.98 ± 0.16 | 3.00 ± 0.00 | 2.71 ± 0.57a,b | 8.441 | < 0.001 |
| Attention | 5.83 ± 0.38 | 5.83 ± 0.38 | 5.05 ± 1.01a,b | 17.410 | < 0.001 |
| Language | 2.71 ± 0.51 | 2.74 ± 0.51 | 2.32 ± 0.70a,b | 6.293 | < 0.003 |
| Abstraction | 1.93 ± 0.26 | 1.89 ± 0.32 | 1.66 ± 0.53a,b | 5.312 | < 0.006 |
| Delayed recall | 3.59 ± 1.12 | 3.49 ± 1.09 | 2.21 ± 1.19a,b | 17.436 | < 0.001 |
| Orientation | 5.98 ± 0.16 | 6.00 ± 0.00 | 5.89 ± 0.31 | 2.756 | 0.068 |
| Total scores | 27.85 ± 1.42 | 27.63 ± 1.54 | 23.74 ± 1.64a,b | 87.076 | < 0.001 |
Comparison of plasma BA levels across three groups
After applying quality control (excluding metabolites with > 50% of measurements below the lower limit of detection), 47 BAs and their ratios were analyzed [Supplementary Tables 1 and 2]. We observed disturbance in BA metabolism in SCH patients with MCI [Figure 2A]. Six BAs and two BA ratios were significantly different across the three groups [Figure 2B]. After false discovery rate (FDR) correction, GDCA (q = 0.021) and taurodeoxycholic acid (TDCA) (q = 0.026) remained statistically significant [Supplementary Tables 1 and 2]. Compared to the HCs group, both SCH-NC and SCH-MCI groups had higher 12-oxochenodeoxycholic acid (12-oxo-CDCA) levels. Additionally, compared to the HCs group, the SCH-MCI group showed higher levels of allolithocholic acid (alloLCA, P = 0.014), isolithocholic acid (isoLCA, P = 0.016), GDCA (P < 0.001), TDCA (P < 0.001), and 3β-glycocholic acid (βGCA, P = 0.004). In particular, the SCH-MCI group showed higher levels of alloLCA (P = 0.026), isoLCA (P = 0.021), GDCA (P = 0.033), and TDCA (P = 0.031) compared with the SCH-NC group. No significant differences were found for other BA levels.
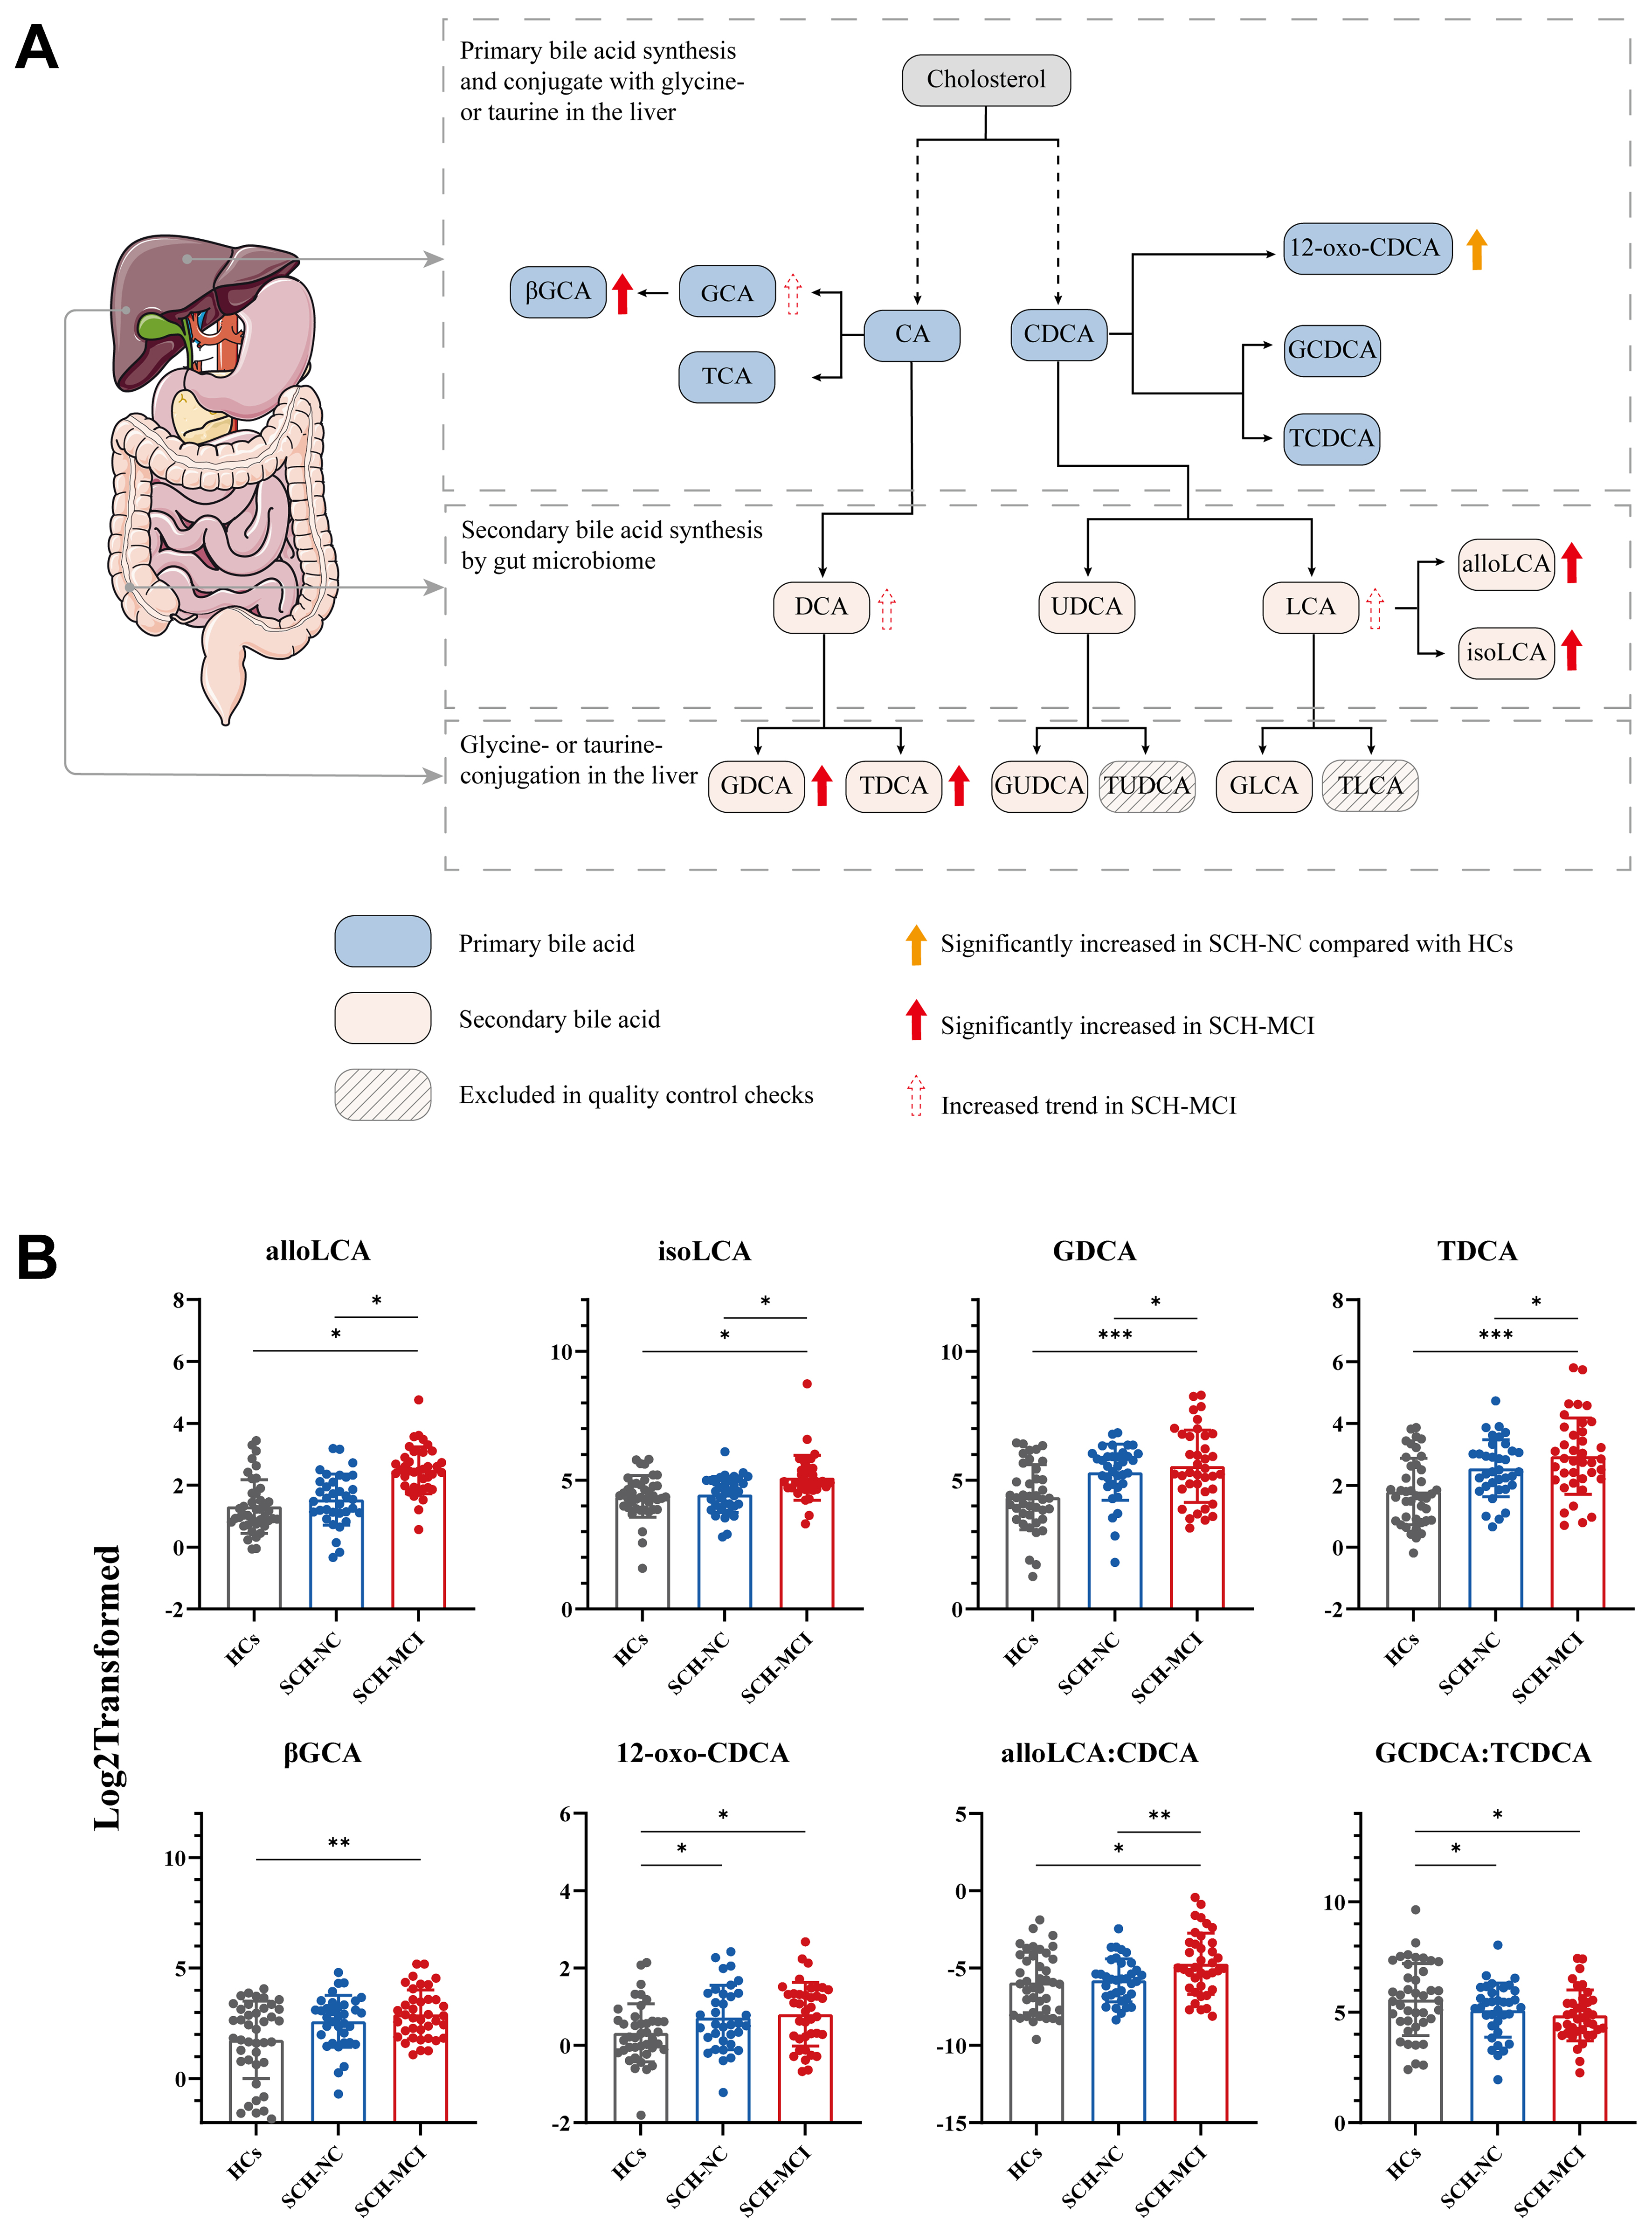
Figure 2. Comparison of alterations in plasma bile acid levels of HCs, SCH-NC, and SCH-MCI groups. (A) Bile acid synthesis pathway. The black dotted arrows indicate that the conversion of cholesterol to the primary bile acids (CA and CDCA) involves multiple enzymatic steps, rather than a direct process. The organ model shown was provided by Servier Medical Art (https://smart.servier.com), licensed under CC BY 4.0 (https://creativecommons.org/licenses/by/4.0/); (B) Inter-group differences in bile acid levels across the three groups. Data are presented mean SD. *P < 0.05, **P < 0.01, ***P < 0.001. ANOVA and the LSD post hoc test. alloLCA: Allolithocholic acid; CDCA: chenodeoxycholic acid; DCA: deoxycholic acid; GCDCA: glycochenodeoxycholic acid; GDCA: glycodeoxycholic acid; GLCA: glycolithocholic acid; GUDCA: glycoursodeoxycholic acid; HCs: healthy controls; isoLCA: isolithocholic acid; LCA: lithocholic acid; SCH-NC: subclinical hypothyroidism with normal cognition; SCH-MCI: subclinical hypothyroidism with mild cognitive impairment; TCDCA: taurochenodeoxycholic acid; TLCA: taurolithocholic acid; TUDCA: tauroursodeoxycholic acid; UDCA: ursodeoxycholic acid; βGCA: 3β-glycocholic acid; 12-oxo-CDCA: 12-oxochenodeoxycholic acid; LSD: least significant difference; CA: cholic acid.
Several BA ratios reflecting BA metabolism processes were calculated based on existing literature [Supplementary Table 2]. Compared with HCs, SCH-MCI patients exhibited significantly higher ratios of alloLCA: CDCA (P = 0.011) and glycochenodeoxycholic acid (GCDCA): taurochenodeoxycholic acid (TCDCA) (P = 0.014). Moreover, the alloLCA: CDCA ratio (P = 0.004) was increased in the SCH-MCI group than in the SCH-NC group [Figure 2B]. No significant differences were found in other BA ratios.
A post-hoc power analysis was performed for these altered BAs. The results showed effect sizes of 0.634, 0.415, 0.427, 0.45, 0.361 and 0.271 with statistical power values of 0.999, 0.981, 0.986, 0.992, 0.934 and 0.726 for alloLCA, isoLCA, GDCA, TDCA, βGCA and 12-oxo-CDCA, respectively. The power analysis results of altered BA ratios showed effect sizes of 0.302 and 0.253 with statistical power values of 0.820 and 0.662 [Table 2].
Post-hoc power analysis of BAs alterations among three groups
| BAs | HCs (mean SEM) | SCH-NC (mean SEM) | SCH-MCI (mean SEM) | Effect size (Cohen’s f ) | Power |
| alloLCA | 3.07 ± 0.36 | 3.36 ± 0.34 | 9.71 ± 3.32 | 0.634 | 0.999 |
| isoLCA | 24.02 ± 1.90 | 23.83 ± 2.00 | 45.35 ± 10.61 | 0.415 | 0.981 |
| GDCA | 29.10 ± 3.72 | 48.66 ± 4.69 | 74.03 ± 12.67 | 0.427 | 0.986 |
| TDCA | 4.59 ± 0.57 | 7.23 ± 0.85 | 11.26 ± 1.96 | 0.451 | 0.992 |
| βGCA | 5.72 ± 0.71 | 7.92 ± 1.02 | 10.09 ± 1.42 | 0.361 | 0.934 |
| 12-oxo-CDCA | 1.41 ± 0.13 | 1.98 ± 0.13 | 2.04 ± 0.20 | 0.271 | 0.726 |
| alloLCA: CDCA | 0.04 ± 0.01 | 0.03 ± 0.01 | 0.09 ± 0.03 | 0.302 | 0.820 |
| GCDCA: TCDCA | 89.25 ± 20.63 | 47.42 ± 7.65 | 40.56 ± 6.51 | 0.253 | 0.662 |
Associations between differential BAs and cognitive function
Correlation analysis was performed to investigate the potential associations of altered BAs, thyroid function parameters, and cognitive function. Spearman correlation analysis revealed no significant correlations between thyroid function parameters and cognitive assessment scores or altered BA levels [Figure 3 and Supplementary Tables 3 and 4].
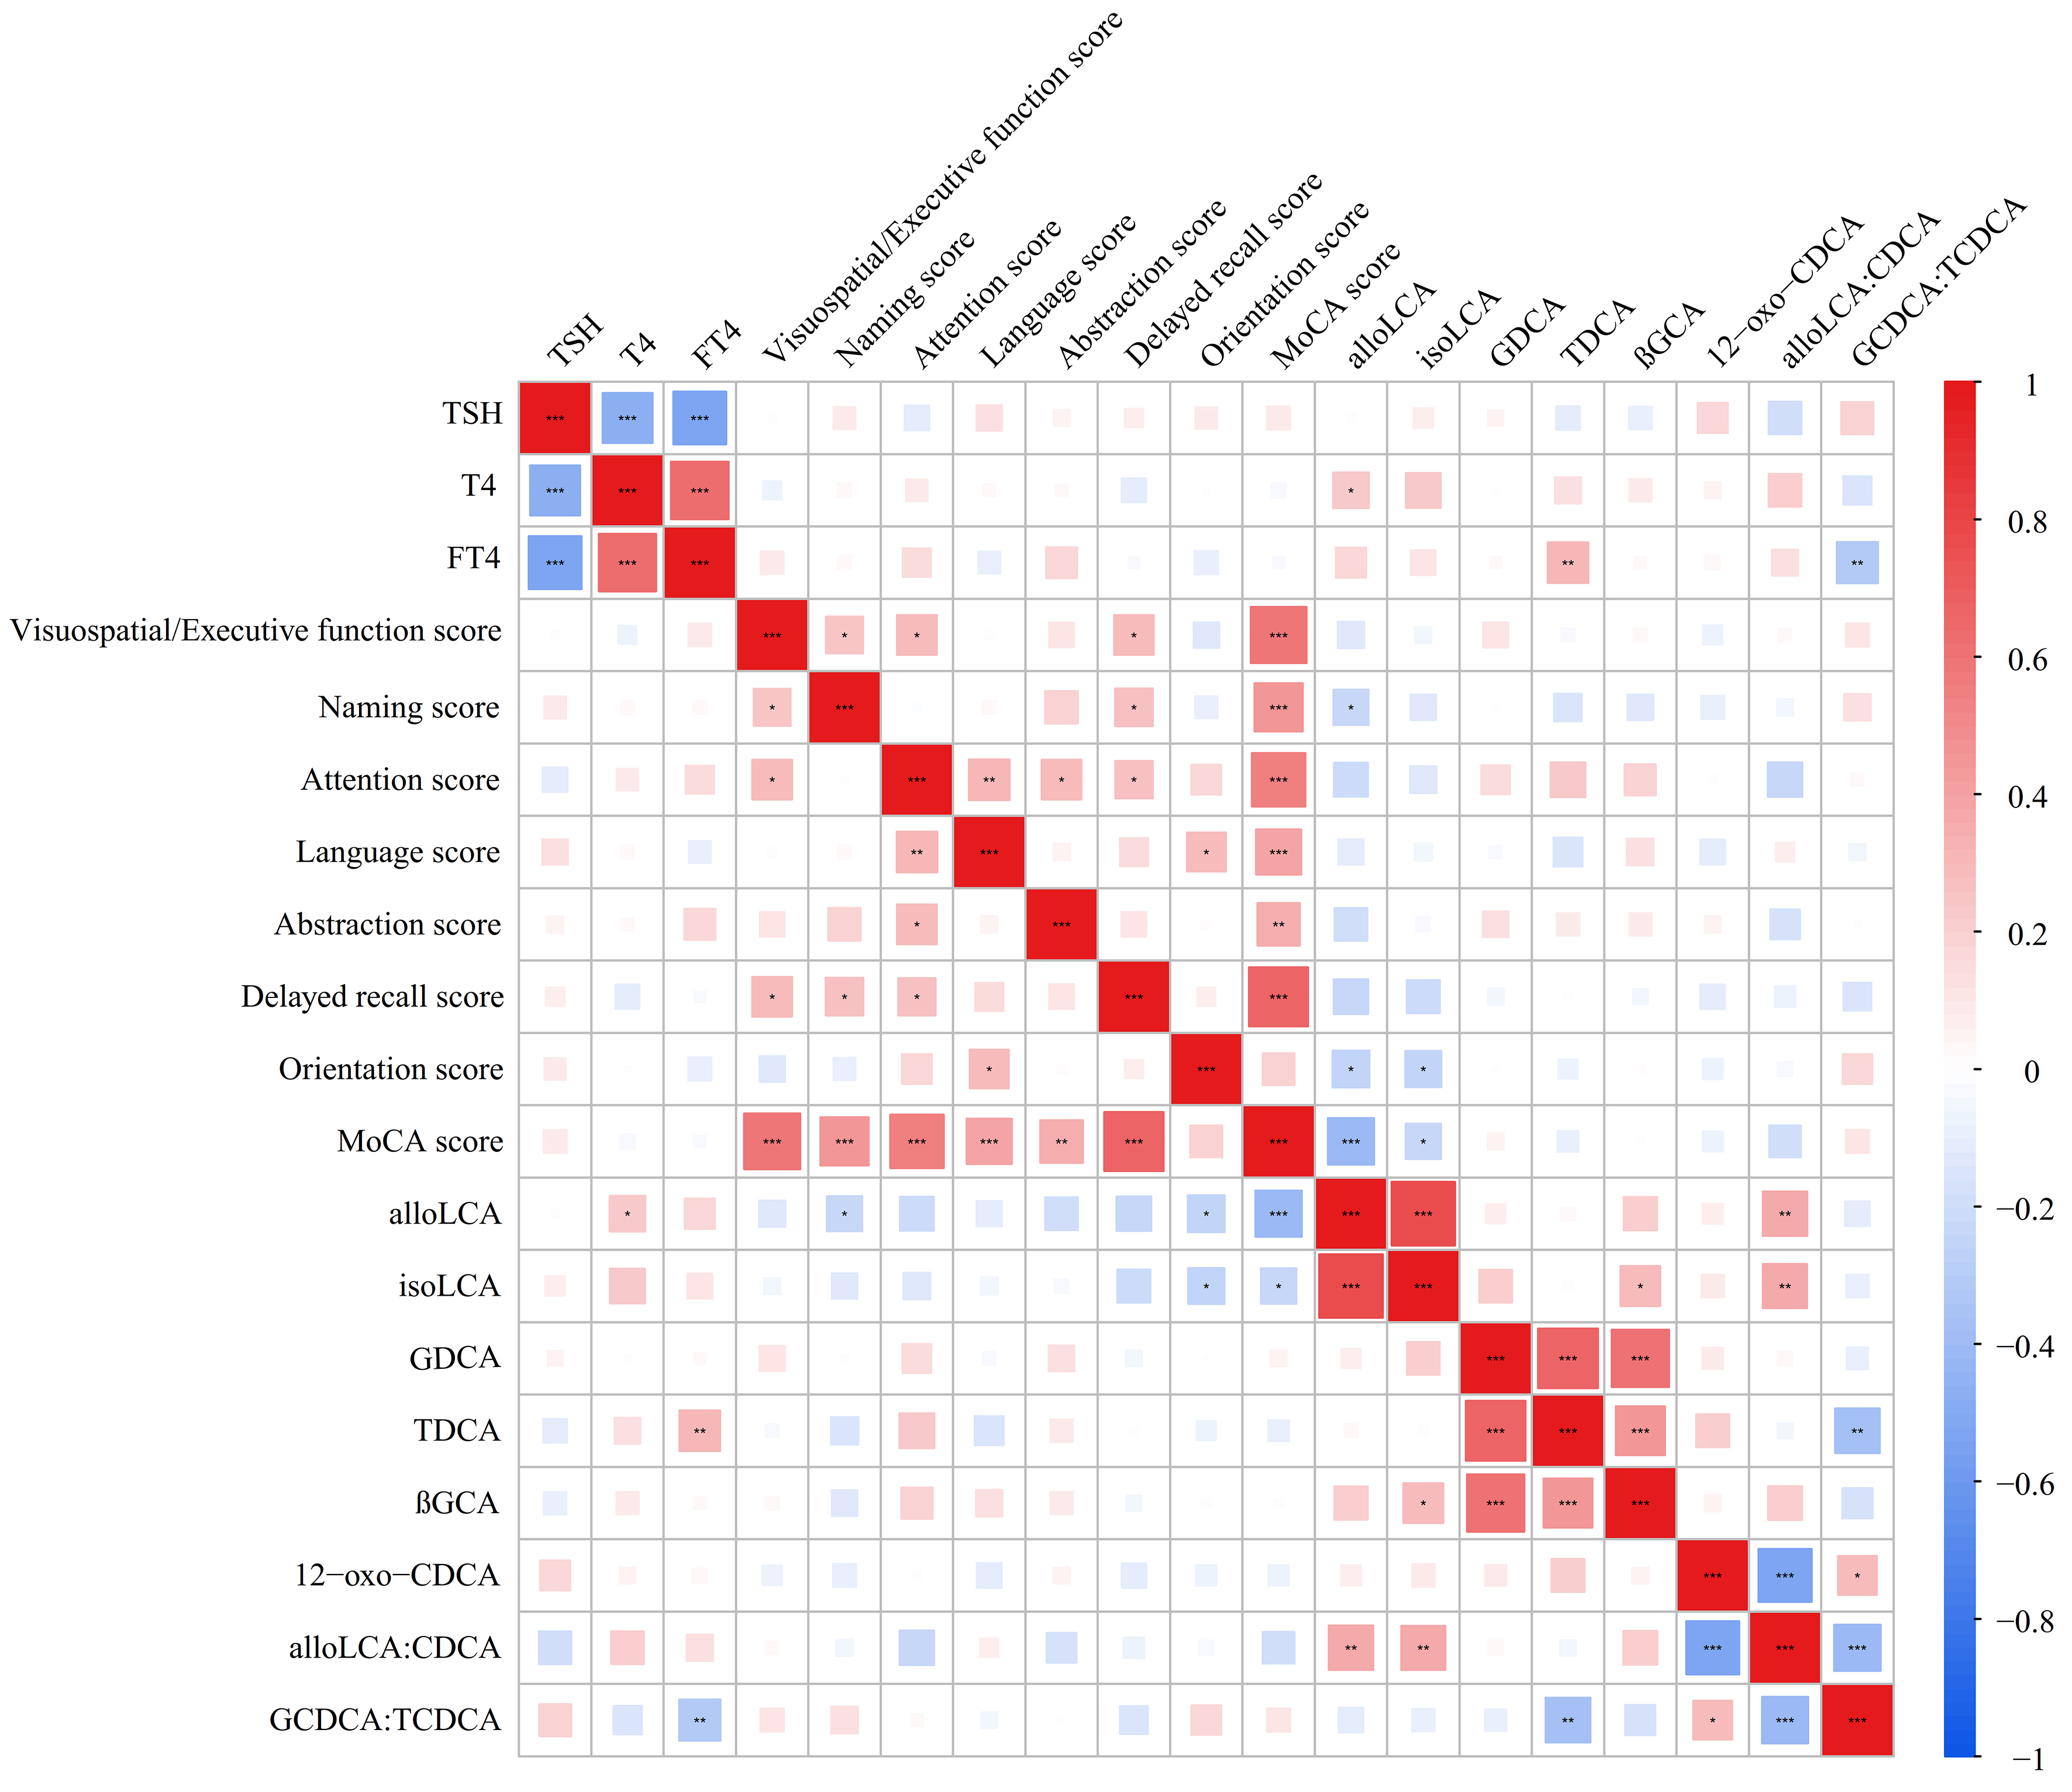
Figure 3. Correlations between plasma differential bile acid levels and laboratory variables, or MoCA scores. Spearman correlation analyses are used. Color-coded: reds indicate positive associations and blues indicate negative associations, with square size proportional to the absolute value of the correlation coefficient. *P < 0.05; **P < 0.01; ***P < 0.001. alloLCA: Allolithocholic acid; CDCA: chenodeoxycholic acid; FT4: thyroxine; GCDCA: glycochenodeoxycholic acid; GDCA: glycodeoxycholic acid; HCs: healthy controls; isoLCA: isolithocholic acid; MoCA: Montreal Cognitive Assessment Scale; T4: thyroxine; TCDCA: taurochenodeoxycholic acid; TSH: thyroid-stimulating hormone; βGCA: 3β-glycocholic acid; 12-oxo-CDCA: 12-oxochenodeoxycholic acid.
Correlation analysis between differential BA levels and cognitive test scores indicated that alloLCA was negatively correlated with the total MoCA score (Spearman correlation coefficient, r = -0.405, P <0.001) and its subitem scores, including naming (r = -0.233, P = 0.047) and orientation score (r = -0.257, P = 0.028). Similarly, isoLCA was negatively correlated with the total MoCA score (r = -0.237, P = 0.043) and its subitem scores of orientations (r = -0.246, P = 0.036). No significant correlations were observed between other BAs and MoCA scores [Figure 3 and Supplementary Table 5].
ROC analysis
The ROC curve was used to assess the diagnostic performance of BAs among HCs, SCH-NC, and SCH-MCI groups. Levels of 12-oxo-CDCA and the ratio of GCDCA to TCDCA differentiated SCH-NC from HCs, with AUCs of 0.636 and 0.581, respectively [Figure 4A]. To discriminate SCH-MCI from HCs, the AUCs of alloLCA, isoLCA, TDCA, GDCA, βGCA and 12-oxo-CDCA were 0.848, 0.760, 0.757, 0.728, 0.670 and 0.666. Additionally, the AUCs of BA ratios were 0.666 (alloLCA: CDCA) and 0.648 (GCDCA: TCDCA) [Figure 4B]. AlloLCA and isoLCA showed acceptable distinguishing abilities between SCH-MCI and SCH-NC with AUCs of 0.817 and 0.721, respectively. The AUCs of GDCA, TDCA and the ratio of alloLCA to CDCA were 0.520, 0.590 and 0.666, respectively, in distinguishing SCH-MCI from SCH-NC [Figure 4C]. Detailed ROC results are shown in Table 3.
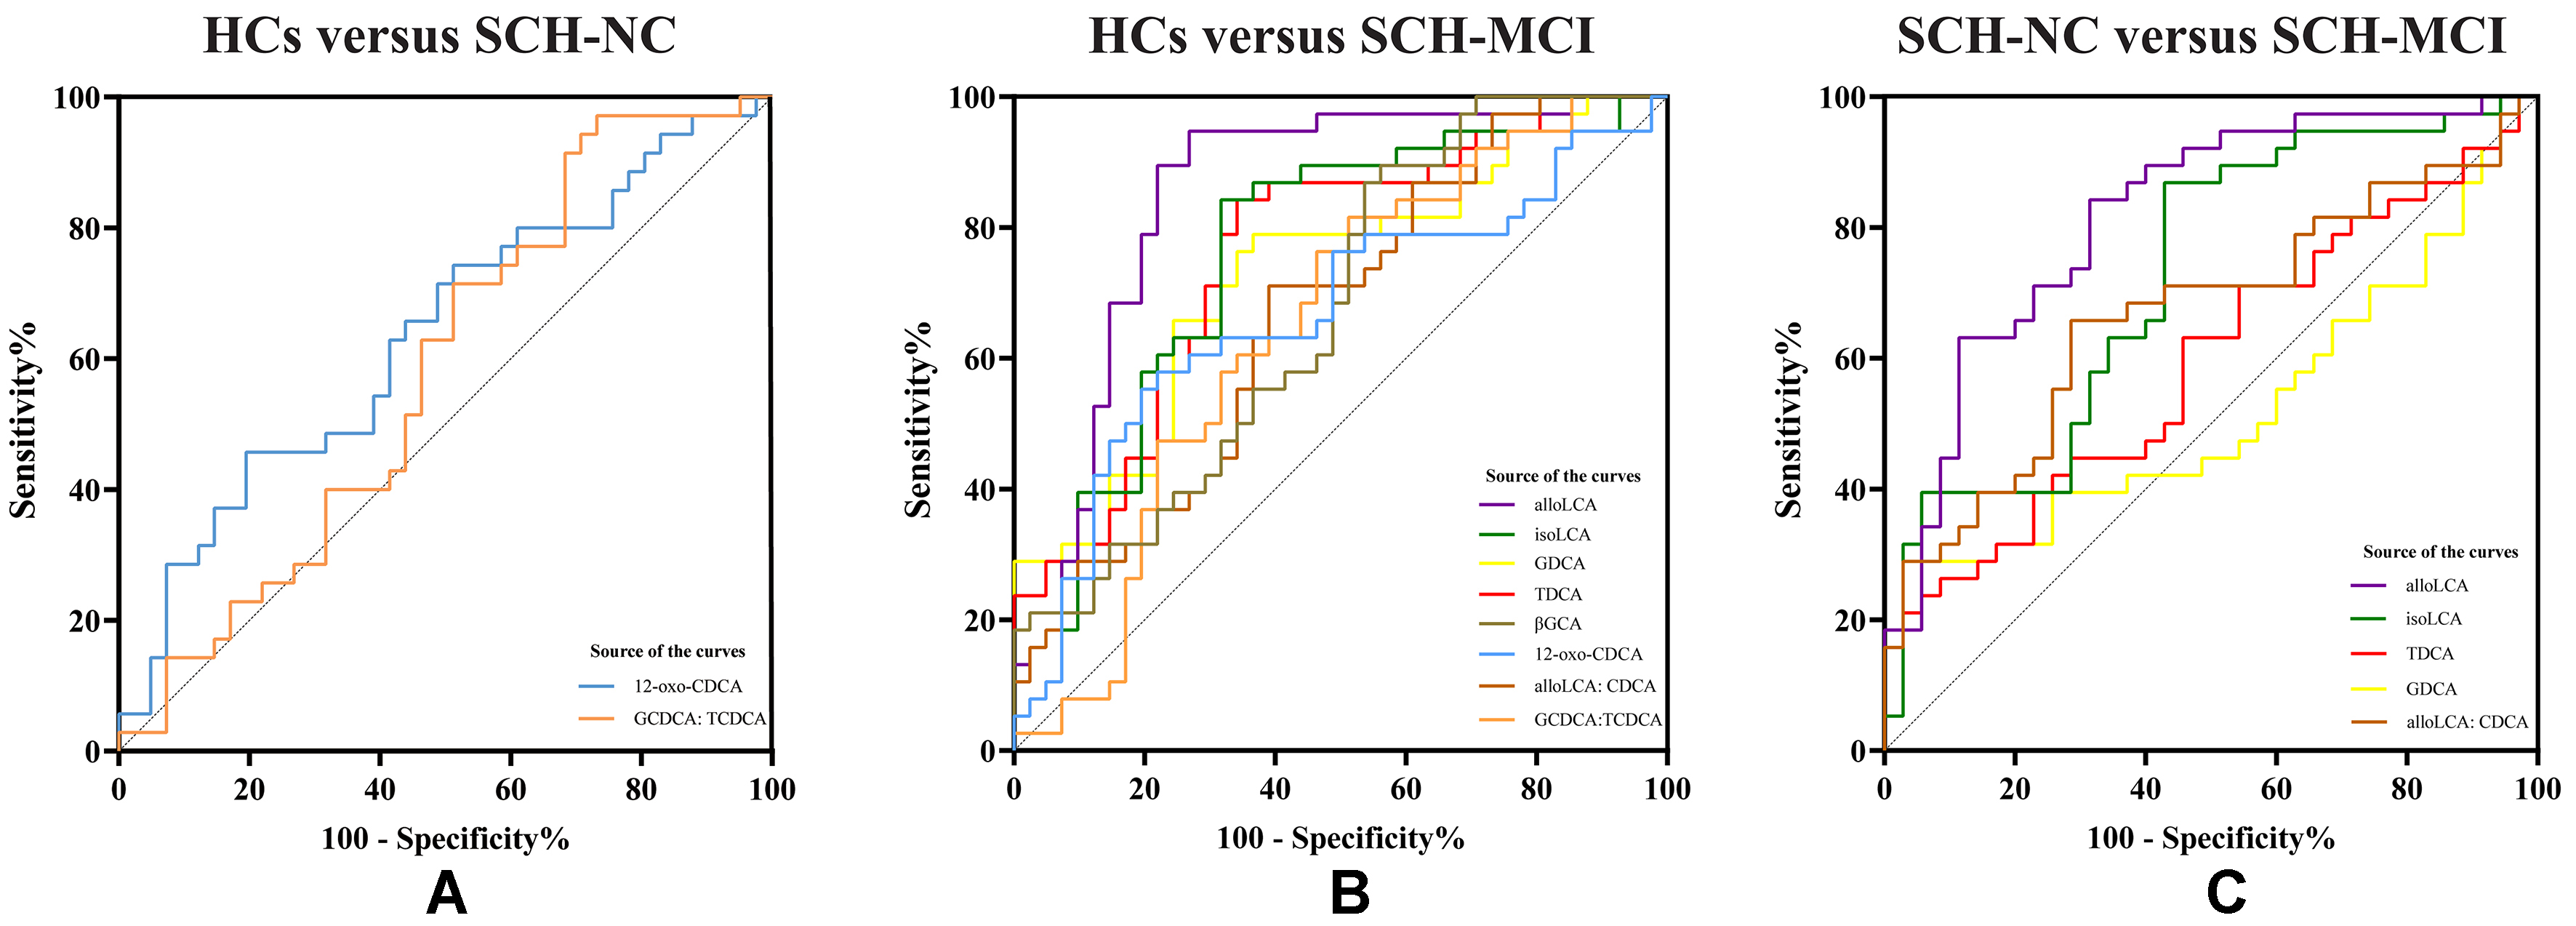
Figure 4. ROC curve analysis of differential BAs of HCs, SCH-NC and SCH-MCI groups. (A) The AUC of differential BAs between HCs and SCH-NC; (B) The AUC of differential BAs between HCs and SCH-MCI; (C) The AUC of differential BAs between SCH-NC and SCH-MCI. alloLCA: Allolithocholic acid; CDCA: chenodeoxycholic acid; GCDCA: glycochenodeoxycholic acid; GDCA: glycodeoxycholic acid; HCs: healthy controls; isoLCA: isolithocholic acid; SCH-NC: subclinical hypothyroidism with normal cognition; SCH-MCI: subclinical hypothyroidism with mild cognitive impairment; T4: thyroxine; TCDCA: taurochenodeoxycholic acid; βGCA: 3β-glycocholic acid; 12-oxo-CDCA: 12-oxochenodeoxycholic acid; ROC: receiver operating characteristic; Bas: bile acids; AUC: area under the curve.
ROC curve analysis based on significantly different BAs in HCs, SCH-NC, and SCH-MCI groups
| Variables | AUC | 95%CI | Cutoff values | Sensitivity (%) | Specificity (%) | P value |
| HCs vs. SCH-NC | ||||||
| 12-oxo-CDCA | 0.636 | (0.510, 0.761) | 1.696 | 45.7 | 80.5 | 0.043 |
| GCDCA: TCDCA | 0.581 | (0.452, 0.710) | 108.170 | 97.1 | 26.8 | 0.224 |
| HCs vs. SCH-MCI | ||||||
| alloLCA | 0.848 | (0.757, 0.939) | 2.857 | 94.7 | 73.2 | < 0.001 |
| isoLCA | 0.760 | (0.652, 0.868) | 24.781 | 84.2 | 68.3 | < 0.001 |
| TDCA | 0.757 | (0.650, 0.863) | 3.706 | 84.2 | 65.9 | < 0.001 |
| GDCA | 0.728 | (0.616, 0.840) | 22.470 | 78.9 | 63.4 | < 0.001 |
| βGCA | 0.670 | (0.552, 0.788) | 3.228 | 89.5 | 43.9 | 0.009 |
| 12-oxo-CDCA | 0.666 | (0.543, 0.789) | 1.585 | 57.9 | 78.1 | 0.011 |
| alloLCA: CDCA | 0.666 | (0.548, 0.785) | 0.020 | 71.1 | 61.0 | 0.011 |
| GCDCA: TCDCA | 0.648 | (0.526, 0.771) | 51.460 | 81.6 | 48.8 | 0.023 |
| SCH-NC vs. SCH-MCI | ||||||
| alloLCA | 0.817 | (0.718, 0.915) | 3.623 | 84.2 | 68.6 | < 0.001 |
| isoLCA | 0.721 | (0.603, 0.839) | 24.193 | 86.8 | 57.1 | 0.001 |
| TDCA | 0.590 | (0.459, 0.721) | 15.598 | 21.1 | 97.1 | 0.185 |
| GDCA | 0.520 | (0.384, 0.655) | 92.745 | 28.9 | 94.3 | 0.774 |
| alloLCA: CDCA | 0.666 | (0.541, 0.791) | 0.025 | 65.8 | 71.4 | 0.015 |
DISCUSSION
In our study, we investigated alterations in BA profiles using targeted metabolomics in SCH patients with and without MCI. Our results demonstrated that levels of alloLCA, isoLCA, GDCA, TDCA, and the ratio of alloLCA to CDCA were significantly increased in SCH-MCI patients compared to those in the SCH-NC group. Furthermore, both alloLCA and isoLCA displayed significantly negative correlations with MoCA scores, including the total scores and its subitems, naming and orientation scores. These findings suggest that the secondary BAs may be associated with cognitive impairment in SCH patients and may serve as important biomarkers for the early recognition of SCH with cognitive dysfunction.
In this study, we found that the levels of alloLCA and isoLCA were elevated, while LCA showed only a nonsignificant trend toward an increase in SCH-MCI compared to SCH-NC patients. It is worth noting that alloLCA and isoLCA have better predictive power in distinguishing SCH with or without MCI. Correlation analysis further revealed that increased alloLCA and isoLCA are strongly associated with cognitive decline. AlloLCA and isoLCA, derivatives of secondary BA LCA, play an important role in immune response and inflammation regulation[30,31]. Although no significant difference was observed in our study, this might be due to the limited sample size. It may become significant with a larger cohort. A study using untargeted metabolomics analysis found that secondary BA metabolism pathways were affected in MCI patients[32]. Besides, significantly elevated levels of LCA and its derivatives have also been reported in major depression and Alzheimer’s disease[21,33].
LCA is synthesized from primary BA CDCA, through the action of 7α-dehydroxylase in the gut. Then, LCA is further modified by gut microbes using hydroxysteroid dehydrogenases to transform into alloLCA and isoLCA[34-37]. Previous studies have found that this process is disrupted in a variety of neuropsychiatric disorders[17,33,38]. Borkowski et al. demonstrated negative associations of episodic memory and global cognition with the ratios of secondary BA to primary BA, including DCA: CA and LCA: CDCA[9]. Similarly, our study also found the ratio of alloLCA to CDCA was significantly elevated in SCH-MCI, which suggests altered activity of bacterial 7α-dehydroxylases leading to excess production of secondary BAs[17]. Research has reported that elevated circulating levels of LCA are associated with a reduced mitochondrial membrane potential, suggesting that LCA may induce cellular dysfunction by impacting mitochondrial energy metabolism[39]. In addition, LCA is a high-affinity ligand for farnesoid X receptor (FXR), and high LCA levels may aggravate cellular inflammatory damage via FXR-activated signaling pathways[40]. Consequently, we hypothesize that LCA and its derivatives may disrupt mitochondrial energy metabolism or induce cellular inflammatory damage, potentially associated with impaired cognitive function. Although there are currently limited studies focusing on the role of alloLCA and isoLCA, our findings may contribute to paying attention to the potential roles of LCA derivatives in SCH-related cognitive dysfunction. We anticipate that these biomarkers could serve as early warning indicators of cognitive decline risk in patients with SCH, as adjuncts to cognitive assessments (e.g., MoCA), and as potential tools for monitoring treatment response.
Additionally, our study also found that plasma levels of GDCA (P < 0.05) and TDCA (P < 0.05) were significantly higher in the SCH-MCI patients than those in the SCH-NC group. These findings are consistent with prior studies that have reported similar alterations in GDCA and TDCA levels in cognitively impaired diseases[17,21-22]. One study linked statistically significant increases in plasma GDCA and TDCA levels to MCI and Alzheimer’s disease[17]. A previous prospective cohort study indicated that GDCA is associated with cognitive decline[41], and higher TDCA concentrations were correlated with decreased hippocampal volume, a brain region critical for cognitive function[18]. GDCA and TDCA, produced by the conjugation of DCA with glycine or taurine by gut microbes[38], are hydrophobic and cytotoxic[42-44] and may induce necroptosis and increase apoptosis[17,45]. Elevated concentrations of circulating BAs with cytotoxic properties alter the permeability of the blood-brain barrier and accumulate in the brain, resulting in neuroinflammation[46] and leading to cognitive impairment. GDCA and TDCA may activate M2 receptors in the brain, potentially affecting cognition function, memory, and learning ability[38]. Additionally, elevated levels of GDCA and TDCA are associated with decreased overall brain glucose metabolism[18]. Individuals with reduced glucose metabolism in the brain were more than five times more likely to develop MCI[47]. However, our study did not identify a significant correlation between GDCA, TDCA, and cognitive function in SCH patients, indicating a need for further exploration.
BA metabolism disorders have been implicated in various neurological diseases. Interestingly, we observed no significant correlations between thyroid function parameters and BA levels or MoCA scores in our study. The absence of correlation between thyroid function parameters and BA levels or MoCA scores in patients with SCH suggests that alterations in BA metabolism may not be driven independently by thyroid hormone deficiency. Previous studies have found that alterations in BA levels are correlated with changes in the composition and abundance of gut microbiota[48,49]. Studies on SCH have shown that SCH patients exhibit gut microbiota dysfunction compared to HCs[50,51]. Therefore, we hypothesize that one possible explanation for the cognitive impairment observed in SCH patients is that alterations in gut microbiota may lead to BA metabolism disorders, which may further affect brain functions and may be related to cognitive decline. However, our study did not establish a direct link between gut microbiota and cognitive impairment in SCH, and this relationship warrants further investigation in future studies.
To our knowledge, this is the first study to connect alterations in BA metabolism, using targeted metabolomics, with SCH-related cognitive dysfunction. Our findings indicate that SCH patients with MCI exhibit increased secondary BAs, which may serve as early biomarkers for cognitive decline in SCH. These altered secondary BAs provide new insights for understanding potential mechanisms of cognitive impairment in SCH. However, this study has several limitations. Firstly, given the exploratory nature of this initial investigation, we also discuss metabolites that showed group differences (P < 0.05) but did not survive FDR correction, with the understanding that these findings are hypothesis-generating and require validation in larger, independent cohorts. Secondly, it does not establish a causality between cognitive impairment and altered BA levels in SCH because of the cross-sectional study. Subsequent longitudinal or interventional studies are needed to confirm the mechanism and investigate if targeting BA improves cognitive function. Thirdly, the sample size was relatively small due to strict inclusion criteria, and larger studies and multi-center data are needed to verify our findings. Fourthly, fecal samples were not analyzed to investigate changes in gut microbiota in our study. Future research could integrate microbiome and metabolomics analyses of fecal samples with blood metabolomics to provide a more comprehensive understanding of exploring microbiota-related activity changes in BA production. Fifthly, some potential confounders affecting BA metabolism and cognition, including dietary patterns, physical activity, sleep quality, detailed medication use and inflammatory markers, were not assessed in this study. Future research will further incorporate these indicators and conduct a comprehensive assessment.
In conclusion, this study indicates that alterations of BA profile, especially alloLCA and isoLCA, may be associated with cognitive impairment in SCH patients. Differential BAs were successfully identified as potential biomarkers for discriminating between SCH patients with and without MCI. These findings contribute to understanding the role of BA metabolism in SCH with MCI and may provide new insights into investigating the potential mechanism of cognitive dysfunction in SCH.
DECLARATIONS
Acknowledgments
We thank all collaborators for their patience and cooperation throughout the study, as well as all participants whose contributions formed the basis of this research. The graphical abstract was created using BioGDP.com (https://www.biogdp.com).
Authors’ contributions
Writing - original draft, writing-review and editing and formal analysis: Li X
Writing - review and editing: Shao F
Conceptualization: Zhao L
Writing - editing: Sun C
Study idea and design: Gao C, Tian L
Availability of data and materials
Some or all datasets generated during and/or analyzed during the current study are not publicly available but are available from the corresponding author upon reasonable request.
AI and AI-assisted tools statement
During the preparation of this manuscript, the AI tool DeepSeek (version 2, released 2024-05-06) was used solely for language editing. The tool did not influence the study design, data collection, analysis, interpretation, or the scientific content of the work. All authors take full responsibility for the accuracy, integrity, and final content of the manuscript.
Financial support and sponsorship
This work was supported by the National Natural Science Foundation of China (No. 82470829), the Natural Science Foundation of Gansu Province (22JR5RA648), and the Sichuan Science and Technology Bureau (2021YJ0564).
Conflicts of interest
All authors declare that there are no conflicts of interest.
Ethical approval and consent to participate
The study was approved by the Ethics Committee of the Gansu Provincial Hospital (Registration Numbers: 2019-196, 2023-500). Informed consent was obtained from all participants before the study.
Consent for publication
Not applicable.
Copyright
© The Author(s) 2026.
Supplementary Materials
REFERENCES
1. Chaker L, Razvi S, Bensenor IM, Azizi F, Pearce EN, Peeters RP. Hypothyroidism. Nat Rev Dis Primers. 2022;8:30.
2. Taylor PN, Albrecht D, Scholz A, et al. Global epidemiology of hyperthyroidism and hypothyroidism. Nat Rev Endocrinol. 2018;14:301-16.
3. Yin J, Xie L, Luo D, et al. Changes of structural and functional attention control networks in subclinical hypothyroidism. Front Behav Neurosci. 2021;15:725908.
4. Samuels MH, Bernstein LJ. Brain fog in hypothyroidism: what is it, how is it measured, and what can be done about it. Thyroid. 2022;32:752-63.
5. Yin JJ, Liao LM, Luo DX, et al. Spatial working memory impairment in subclinical hypothyroidism: an FMRI study. Neuroendocrinology. 2013;97:260-70.
6. Zhang T, Zhao L, Chen C, et al. Structural and functional alterations of hippocampal subfields in patients with adult-onset primary hypothyroidism. J Clin Endocrinol Metab. 2024;109:1707-17.
7. Beydoun MA, Beydoun HA, Rostant OS, et al. Thyroid hormones are associated with longitudinal cognitive change in an urban adult population. Neurobiol Aging. 2015;36:3056-66.
8. Pasqualetti G, Pagano G, Rengo G, Ferrara N, Monzani F. Subclinical hypothyroidism and cognitive impairment: systematic review and meta-analysis. J Clin Endocrinol Metab. 2015;100:4240-8.
9. Borkowski K, Taha AY, Pedersen TL, et al. Serum metabolomic biomarkers of perceptual speed in cognitively normal and mildly impaired subjects with fasting state stratification. Sci Rep. 2021;11:18964.
10. Gómez-Pascual A, Naccache T, Xu J, et al. Paired plasma lipidomics and proteomics analysis in the conversion from mild cognitive impairment to Alzheimer’s disease. Comput Biol Med. 2024;176:108588.
11. Wang S, Xu C, Liu H, et al. Connecting the gut microbiota and neurodegenerative diseases: the role of bile acids. Mol Neurobiol. 2023;60:4618-40.
12. Xing C, Huang X, Wang D, et al. Roles of bile acids signaling in neuromodulation under physiological and pathological conditions. Cell Biosci. 2023;13:106.
14. Winston JA, Theriot CM. Diversification of host bile acids by members of the gut microbiota. Gut Microbes. 2020;11:158-71.
15. Collins SL, Stine JG, Bisanz JE, Okafor CD, Patterson AD. Bile acids and the gut microbiota: metabolic interactions and impacts on disease. Nat Rev Microbiol. 2023;21:236-47.
16. McMillin M, DeMorrow S. Effects of bile acids on neurological function and disease. FASEB J. 2016;30:3658-68.
17. MahmoudianDehkordi S, Arnold M, Nho K, et al.; Alzheimer’s Disease Neuroimaging Initiative and the Alzheimer Disease Metabolomics Consortium. Altered bile acid profile associates with cognitive impairment in Alzheimer’s disease-An emerging role for gut microbiome. Alzheimers Dement. 2019;15:76-92.
18. Nho K, Kueider-Paisley A, MahmoudianDehkordi S, et al.; Alzheimer’s Disease Neuroimaging Initiative and the Alzheimer Disease Metabolomics Consortium. Altered bile acid profile in mild cognitive impairment and Alzheimer’s disease: relationship to neuroimaging and CSF biomarkers. Alzheimers Dement. 2019;15:232-44.
19. Nie K, Li Y, Zhang J, et al. Distinct bile acid signature in Parkinson’s disease with mild cognitive impairment. Front Neurol. 2022;13:897867.
20. Ren Z, Zhao L, Zhao M, et al. Increased intestinal bile acid absorption contributes to age-related cognitive impairment. Cell Rep Med. 2024;5:101543.
21. Marksteiner J, Blasko I, Kemmler G, Koal T, Humpel C. Bile acid quantification of 20 plasma metabolites identifies lithocholic acid as a putative biomarker in Alzheimer’s disease. Metabolomics. 2018;14:1.
22. Olazarán J, Gil-de-Gómez L, Rodríguez-Martín A, et al. A blood-based, 7-metabolite signature for the early diagnosis of Alzheimer’s disease. J Alzheimers Dis. 2015;45:1157-73.
23. Chen SJ, Chen CC, Liao HY, et al. Alteration of gut microbial metabolites in the systemic circulation of patients with Parkinson’s disease. J Parkinsons Dis. 2022;12:1219-30.
24. Li J, Xu Y, Cai Y, et al. Association of differential metabolites with small intestinal microflora and maternal outcomes in subclinical hypothyroidism during pregnancy. Front Cell Infect Microbiol. 2021;11:779659.
25. Shao F, Li R, Guo Q, et al. Plasma metabolomics reveals systemic metabolic alterations of subclinical and clinical hypothyroidism. J Clin Endocrinol Metab. 2022;108:13-25.
26. Song Y, Zhao M, Zhang H, et al. Thyroid-stimulating hormone levels are inversely associated with serum total bile acid levels: a cross-sectional study. Endocr Pract. 2016;22:420-6.
27. Endocrinology CSo. Guidelines for diagnosis and management of hypothyroidism in adults. Chin J Endocrinol Metab. 2017;33:167-80.
28. Yu J, Li J, Huang X. The Beijing version of the Montreal Cognitive Assessment as a brief screening tool for mild cognitive impairment: a community-based study. BMC Psychiatry. 2012;12:156.
29. Nasreddine ZS, Phillips NA, Bédirian V, et al. The Montreal Cognitive Assessment, MoCA: a brief screening tool for mild cognitive impairment. J Am Geriatr Soc. 2005;53:695-9.
30. Hang S, Paik D, Yao L, et al. Bile acid metabolites control TH17 and Treg cell differentiation. Nature. 2019;576:143-8.
31. Cai J, Sun L, Gonzalez FJ. Gut microbiota-derived bile acids in intestinal immunity, inflammation, and tumorigenesis. Cell Host Microbe. 2022;30:289-300.
32. Shao Y, Ouyang Y, Li T, et al. Alteration of metabolic profile and potential biomarkers in the plasma of Alzheimer’s disease. Aging Dis. 2020;11:1459-70.
33. MahmoudianDehkordi S, Bhattacharyya S, Brydges CR, et al. Gut microbiome-linked metabolites in the pathobiology of major depression with or without anxiety-a role for bile acids. Front Neurosci. 2022;16:937906.
34. Chiang JYL, Ferrell JM. Bile acids as metabolic regulators and nutrient sensors. Annu Rev Nutr. 2019;39:175-200.
35. Yang R, Qian L. Research on gut microbiota-derived secondary bile acids in cancer progression. Integr Cancer Ther. 2022;21:15347354221114100.
36. Lee JW, Cowley ES, Wolf PG, et al. Formation of secondary allo-bile acids by novel enzymes from gut Firmicutes. Gut Microbes. 2022;14:2132903.
37. Ridlon JM, Gaskins HR. Another renaissance for bile acid gastrointestinal microbiology. Nat Rev Gastroenterol Hepatol. 2024;21:348-64.
38. Kiriyama Y, Nochi H. The biosynthesis, signaling, and neurological functions of bile acids. Biomolecules. 2019;9:232.
39. Rolo AP, Oliveira PJ, Moreno AJ, Palmeira CM. Bile acids affect liver mitochondrial bioenergetics: possible relevance for cholestasis therapy. Toxicol Sci. 2000;57:177-85.
40. Xu Z, Huang G, Gong W, et al. FXR ligands protect against hepatocellular inflammation via SOCS3 induction. Cell Signal. 2012;24:1658-64.
41. Low DY, Lefèvre-Arbogast S, González-Domínguez R, et al. Diet-related metabolites associated with cognitive decline revealed by untargeted metabolomics in a prospective cohort. Mol Nutr Food Res. 2019;63:e1900177.
42. Lamireau T, Zoltowska M, Levy E, et al. Effects of bile acids on biliary epithelial cells: proliferation, cytotoxicity, and cytokine secretion. Life Sci. 2003;72:1401-11.
43. Xie G, Wang X, Jiang R, et al. Dysregulated bile acid signaling contributes to the neurological impairment in murine models of acute and chronic liver failure. EBioMedicine. 2018;37:294-306.
44. Baloni P, Funk CC, Yan J, et al.; Alzheimer’s Disease Metabolomics Consortium. Metabolic network analysis reveals altered bile acid synthesis and metabolism in Alzheimer’s disease. Cell Rep Med 2020;1:100138. Available from: https://scholar.google.com/scholar?q=Metabolic+network+analysis+reveals+altered+bile+acid+synthesis+and+metabolism+in+Alzheimer%E2%80%99s+disease&hl=zh-CN&as_sdt=0&as_vis=1&oi=scholart. [Last accessed on 30 Mar 2026].
45. Oizumi K, Sekine S, Fukagai M, Susukida T, Ito K. Identification of bile acids responsible for inhibiting the bile salt export pump, leading to bile acid accumulation and cell toxicity in rat hepatocytes. J Pharm Sci. 2017;106:2412-9.
46. Chen ML, Takeda K, Sundrud MS. Emerging roles of bile acids in mucosal immunity and inflammation. Mucosal Immunol. 2019;12:851-61.
47. Krell-Roesch J, Syrjanen JA, Vassilaki M, et al. Brain regional glucose metabolism, neuropsychiatric symptoms, and the risk of incident mild cognitive impairment: the Mayo clinic study of aging. Am J Geriatr Psychiatry. 2021;29:179-91.
48. Qian Y, Yang X, Xu S, et al. Gut metagenomics-derived genes as potential biomarkers of Parkinson’s disease. Brain. 2020;143:2474-89.
49. Olasunkanmi OI, Zheng L, Zheng P. Gut-brain axis in health and brain disease. Chin Med J. 2026;139:799-827.
50. Liu S, An Y, Cao B, Sun R, Ke J, Zhao D. The composition of gut microbiota in patients bearing Hashimoto’s thyroiditis with euthyroidism and hypothyroidism. Int J Endocrinol. 2020;2020:5036959.
Cite This Article
How to Cite
Download Citation
Export Citation File:
Type of Import
Tips on Downloading Citation
Citation Manager File Format
Type of Import
Direct Import: When the Direct Import option is selected (the default state), a dialogue box will give you the option to Save or Open the downloaded citation data. Choosing Open will either launch your citation manager or give you a choice of applications with which to use the metadata. The Save option saves the file locally for later use.
Indirect Import: When the Indirect Import option is selected, the metadata is displayed and may be copied and pasted as needed.
About This Article
Copyright

Data & Comments
Data
0


Comments
Comments must be written in English. Spam, offensive content, impersonation, and private information will not be permitted. If any comment is reported and identified as inappropriate content by OAE staff, the comment will be removed without notice. If you have any queries or need any help, please contact us at support@oaepublish.com.