


fig4
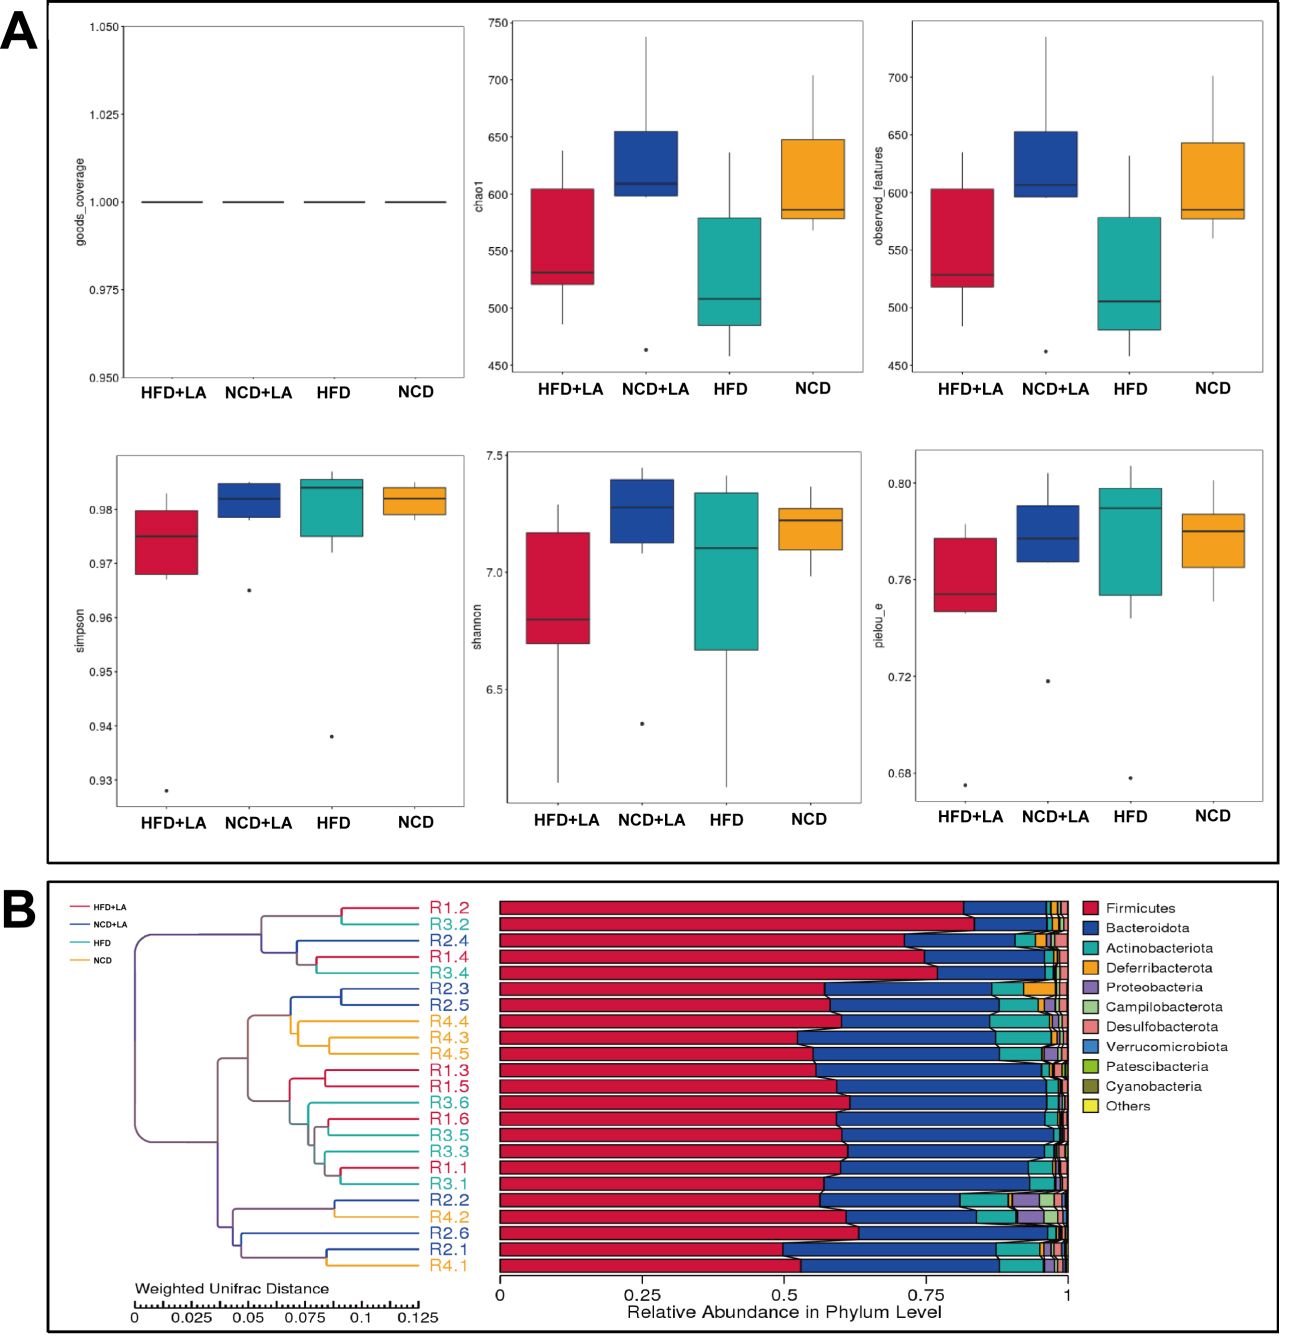
Figure 4. Alpha analysis and beta analysis of gut microbiota in mice. A: Goods-coverage, Chao1, observed-features, Simpson, Shannon and Pielou’s E obtained by alpha analysis of gut microbiota in mice; B: UPGMA clustering tree based on weighted Unifrac distance. (n = 5-6 for each group). NCD: Normal chow diet; HFD: high-fat diet; LA: L-arabinose; UPGMA: unweighted pair-group method with arithmetic mean.


