


fig3
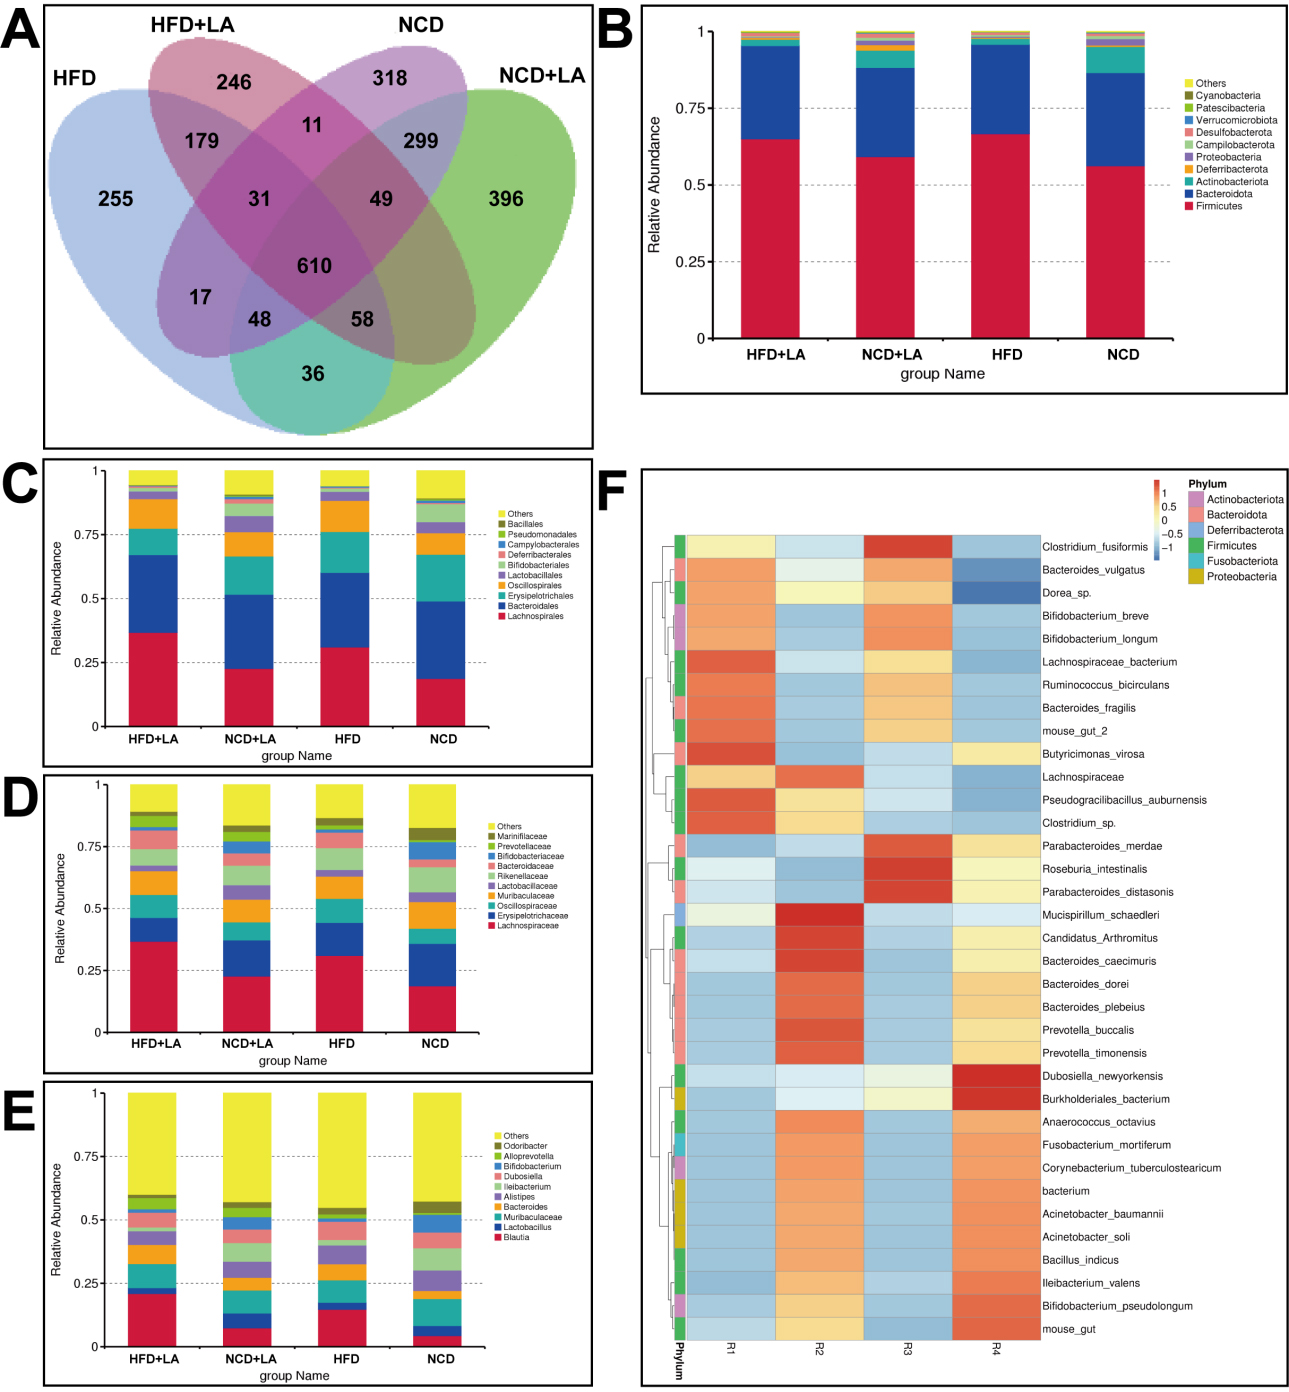
Figure 3. Characteristics of gut microbiota in mice. (A) Venn diagram of characteristic sequences of mice in each group; (B) the top ten microbial populations in each group at the phyla level; (C) at the family level; (D) at the genus level; (E) at the species level; (F) a heatmap of the top 35 strains with total abundance at the taxonomic level. (n = 5-6 for each group). NCD: Normal chow diet; HFD: high-fat diet; LA: L-arabinose.


