


Quantification of the absolute abundance of the jejunal mucosa-associated microbiota of pigs using spike-in control
 0
0 
Abstract
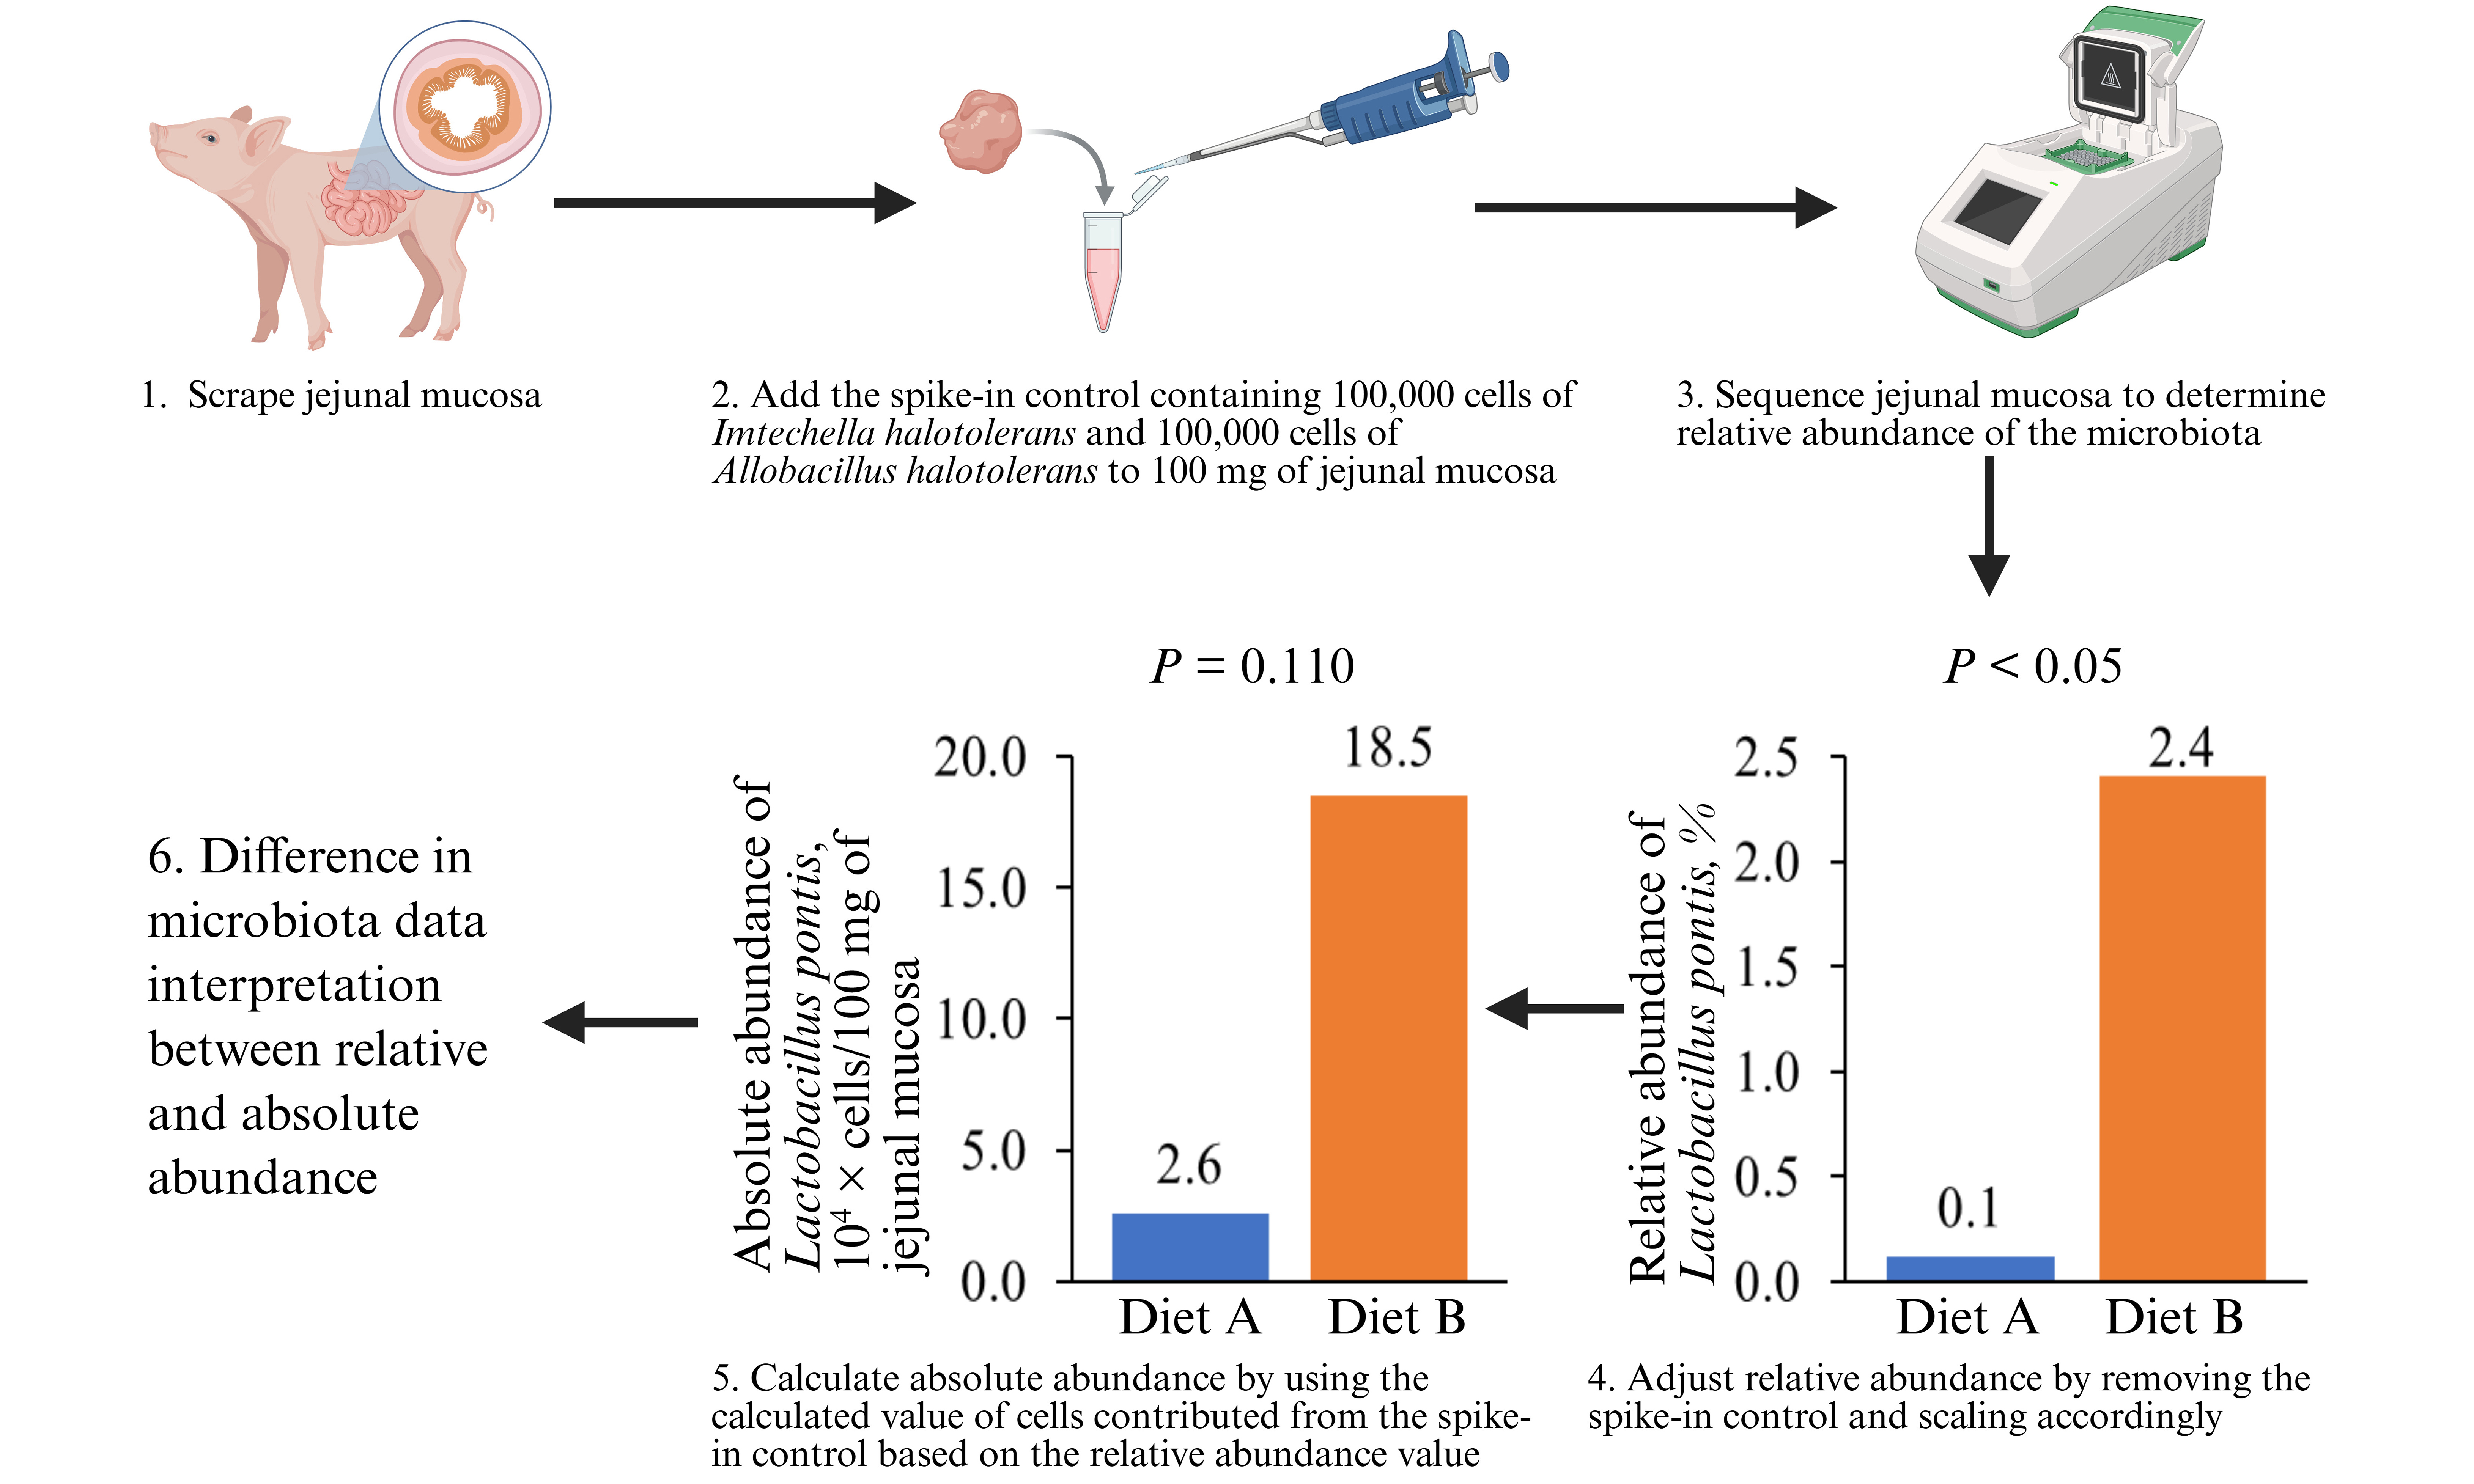
The objective was to quantify the absolute abundance of the jejunal mucosa-associated microbiota in pigs and develop a standardized spike-in control protocol. The spike-in control, containing bacteria that are Gram-negative (Imtechella halotolerans) and Gram-positive (Allobacillus halotolerans), was diluted 100 times and 10 μL (100,000 bacterial cells of each species) was added to 100 mg of porcine jejunal mucosa samples. The relative abundance of the jejunal mucosa-associated microbiota differed between the diet groups, whereas no difference was observed in their absolute abundance. In conclusion, the spike-in control containing 100,000 cells of Imtechella halotolerans and Allobacillus halotolerans can be used to quantify the absolute abundance of microbiota in 100 mg of pig jejunal mucosa.
Keywords
INTRODUCTION
Intestinal health is essential for enhancing the health of pigs, and is influenced by the intestinal microbiota[1-3]. The intestinal microbiota can be classified as luminal and mucosa-associated, with different compositions due to the intestinal oxygen
Relative abundance is commonly utilized to compare microbial composition between different groups to test hypotheses or draw conclusions[7-9]. However, when interpreting relative abundance, the relative abundance of a taxon depends on that of the other taxa[10,11]. In contrast, absolute abundance of one taxon is independent of other taxa, potentially reducing bias[12,13]. Quantifying the absolute abundance allows for comparisons across different studies and overcomes limitations of individual studies[14,15]. One method to measure the absolute abundance is the spike-in method[10,14,16]. This method utilizes a spike-in control (bacterial cells or DNA), which is foreign to the microbiota composition of the target species[16,17]. When added to unknown samples, the absolute abundance of other microbiota can be quantified by combining their relative abundances with the known cell counts of the spike-in control, and technical bias starting from DNA extraction can be corrected[18,19].
The spike-in method has been applied to quantify the absolute abundance of microbiota in human feces[20], soil[21], and food[22]. Currently, the working range of spike-in control has not been determined for the intestinal mucosa-associated microbiota of pigs. The proportion of spike-in control relative to total microbiota should be optimized because a low proportion may result in an undetectable spike-in, whereas an excessively high proportion may hinder identification of the target microbial communities[21,23]. The spike-in control levels used for fecal samples should not be directly applied to mucosal samples because the mucosa typically has a lower bacterial load[24]. Therefore, the objective was to quantify the absolute abundance of jejunal mucosa-associated microbiota in pigs and develop a standardized spike-in protocol.
SAMPLE PREPARATION, SPIKE-IN CONTROL, AND ANALYSIS
Animal procedures were approved by the Animal Care and Use Committee (approval No.: 25-371) of North Carolina State University (Raleigh, NC, USA). Fourteen pigs (initial body weight = 6.7 ± 0.3 kg) were assigned different diets (Diet A and Diet B) meeting nutrient requirements[25] using a randomized complete block design, with initial body weight and sex as blocking factors. Individually housed pigs were euthanized at 12.8 kg. Collected jejunal mucosa samples were frozen at -80 °C and stored prior to portioning into sections weighing 100 mg ± 10 mg. Sections were transferred to a 2 mL tube (Greiner Bio-One GmbH, Kremsmünster, Austria) containing 1 mL of DNA/RNA Shield (#R1100-250, Zymo Research, Irvine, CA, USA). Samples were thawed for 20 minutes, before vortexing for 20 seconds. During sample thawing, ZymoBIOMICS Spike-in Control I (#D6320, Zymo Research, Irvine, CA, USA), stored at -80 °C, was thawed and diluted 100 times using nuclease-free water (#10977015, Thermo Fisher Scientific, Waltham, MA, USA). Then, 10 μL of the 100-fold diluted spike-in control was added to each prepared sample, and this concentration was determined based on preliminary results [Supplementary Table 1]. The total number of cells and 16S copies of the spike-in control are already known [Supplementary Table 2].
QUANTIFYING THE ABSOLUTE ABUNDANCE OF THE JEJUNAL MUCOSA-ASSOCIATED MICROBIOTA AT THE FAMILY, GENUS, AND SPECIES LEVELS
Samples were analyzed using 16S ribosomal RNA (rRNA) sequencing (Supplementary information). The known amount of added spike-in control was calculated. The total number of 16S copies derived from the spike-in control was calculated by dividing the actual spike-in control volume added (10 μL) by the standard value of 20 μL [26], accounting for the 100-fold dilution (0.1 μL). This value is then multiplied by the 16S copy number provided by Zymo Research to determine the total 16S copies of the spike-in control added per sample[26]. This value remained constant across all samples, assuming a consistent laboratory technique. The number of 16S copies of the spike-in control per sample was calculated for each unique spike-in control species. In this case, the values for Imtechella halotolerans and Allobacillus halotolerans were 300,000 and 700,000 16S copies, respectively. Considering that Imtechella halotolerans and Allobacillus halotolerans contain 3 and 7 16S copies per genome, respectively, this corresponds to the addition of 100,000 bacterial cells of each spike-in control species.
Next, the total 16S copies per sample were determined using relative abundance data. Using the constant derived from the previous step and the relative abundance of the corresponding spike-in control species, the total 16S copies were calculated as[26]:
If a sample had a relative abundance of Imtechella halotolerans and Allobacillus halotolerans of 1% and 3%, respectively [Supplementary Figure 1], the 16S copies per sample can be calculated as follows[26]:
This calculation is performed for each sample, accounting for variation in the relative abundance of each spike-in control species. The resulting number of 16S copies per sample was then divided by an average number of 16S copies per bacterial genome, 5 copies, as is generally accepted for mixed bacterial populations, to estimate total cell count[27]. If complete genome data are available, species-specific corrections can be applied instead of assuming a mean of five copies per genome. Estimated cell counts derived from Imtechella halotolerans and Allobacillus halotolerans may differ due to variation in spike-in recovery and 16S copies per genome. Therefore, the final estimated cell count per sample may be calculated as the average of both spike-in control-based estimates[26]:
To obtain the final adjusted cell count per sample, the spike-in control cell count for each species was subtracted from the corresponding average estimated cell count. The cell count of each spike-in control species can be calculated using the relative abundance data and average estimated cell count:
Subtracting the cell count of each spike-in control species results in a final adjusted cell count for this sample[26]:
The relative abundance of the spike-in control species should also be removed from the relative abundance data and the remaining relative abundance values should be scaled to 100%. For example, the relative abundance of Lactobacillus delbrueckii is 45% in the initial sample, including the spike-in control species [Supplementary Figure 1]. After removal of the spike-in control species, the relative abundance of all species was multiplied by a factor of 1.042 (100 ÷ 96), accounting for the removal of the 4% relative abundance of the spike-in control. The adjusted relative abundance of Lactobacillus delbrueckii is 46.88% [Supplementary Figure 1]. The absolute abundance of Lactobacillus delbrueckii is calculated as follows[26]:
The same procedure can be applied at the family and genus levels. Imtechella halotolerans belongs to the genus Lactobacillus and the family Lactobacillaceae. Allobacillus halotolerans belongs to the genus Allobacillus and the family Bacillaceae.
QUANTIFYING THE ABSOLUTE ABUNDANCE OF THE JEJUNAL MUCOSA-ASSOCIATED MICROBIOTA AT THE PHYLUM LEVEL
The spike-in control species will be within the same phyla as native species; however, their contribution can be inferred from family, genus, or species levels as relative abundance remains constant across taxonomic levels. The relative abundance of each spike-in control species should be removed from the corresponding phylum before estimating absolute abundance at the phylum level. Imtechella halotolerans and Allobacillus halotolerans are of the phyla Bacteroidota and Bacillota, respectively. For example, if a sample contained a relative abundance of 1% Imtechella halotolerans at the species level, its relative abundance at the phylum level would also be 1%. Therefore, if the relative abundance of Bacteroidota in the same sample was 50%, the relative abundance of 1% can be subtracted, and the relative abundance must again be scaled to 100% after removal of the spike-in control. In this case, the resulting relative abundance (49%) will also be multiplied by 1.042, for a final relative abundance of Bacteroidota at 51.06% [Supplementary Figure 2].
The relative abundance of the remaining phyla should be scaled to 100%. The corrected relative abundance of each phylum can be multiplied by the total cell count to determine absolute abundance at the phylum level. In this case, the absolute abundance of the Bacteroidota phylum is calculated as follows[26]:
STATISTICAL ANALYSIS
PROC MIXED in SAS 9.4 (SAS Institute, Cary, NC, USA) was used to compare the relative and absolute abundance of the jejunal mucosa-associated microbiota in pigs fed two diets (Diet A and Diet B). The statistical model was a mixed model, with diet as a fixed effect and initial body weight and sex as random effects. The significance and tendency were declared at P < 0.05 and 0.05 ≤ P < 0.10, respectively.
RESULTS
Fourteen jejunal mucosa samples were analyzed; more than 50,000 sequencing reads were obtained per sample, and the total number of high-quality sequences exceeded 700,000. Differences were not observed in the relative abundance of the spike-in control between dietary groups [Supplementary Table 3]. The sum of the relative abundance of the spike-in control was 4.4% in Diet A and 3.8% in Diet B. Diet B tended to increase (P = 0.056) the relative abundance of Lactobacillus delbrueckii and increased (P < 0.05) the relative abundance of Lactobacillus pontis, whereas it tended to reduce the relative abundance of Bifidobacterium thermacidophilum (P = 0.098) compared with the Diet A group [Table 1]. In contrast, differences in the absolute abundance were not observed [Table 2].
Relative abundance (%) of the jejunal mucosa-associated microbiota at the species level of pigs fed two different experimental diets1
| Diet A | Diet B | Pooled SEM | P-value | |
| Helicobacter rappini | 11.45 | 6.74 | 3.59 | 0.295 |
| Bifidobacterium dentium | 5.03 | 6.45 | 1.92 | 0.611 |
| Lactobacillus delbrueckii | 2.38 | 6.50 | 1.34 | 0.056 |
| Prevotella copri | 3.62 | 1.87 | 1.48 | 0.422 |
| Lactobacillus mucosae | 1.54 | 2.77 | 0.67 | 0.207 |
| Bifidobacterium thermacidophilum | 5.99 | 1.93 | 1.57 | 0.098 |
| Helicobacter equorum | 0.02 | 0.04 | 0.02 | 0.443 |
| Olsenella profusa | 2.54 | 2.87 | 1.77 | 0.830 |
| Lactobacillus pontis | 0.12 | 2.41 | 0.76 | 0.011 |
| Bifidobacterium boum | 0.86 | 2.60 | 0.70 | 0.108 |
| Blautia wexlerae | 0.81 | 1.11 | 0.43 | 0.595 |
| Mitsuokella multacida | 0.80 | 1.19 | 0.53 | 0.611 |
| Staphylococcus carnosus | 0.08 | 0.11 | 0.07 | 0.746 |
| Weissella cibaria | 0.28 | 0.19 | 0.28 | 0.736 |
| Lactobacillus johnsonii | 0.49 | 1.99 | 1.42 | 0.358 |
| Faecalibacterium prausnitzii | 0.47 | 0.38 | 0.16 | 0.712 |
| Others | 63.65 | 61.00 | 3.97 | 0.628 |
Absolute abundance (cells × 104/ 100 mg of jejunal mucosa) of the jejunal mucosa-associated microbiota at the species level of pigs fed two different experimental diets1
| Diet A | Diet B | Pooled SEM | P-value | |
| Helicobacter rappini | 75.2 | 33.3 | 24.8 | 0.260 |
| Bifidobacterium dentium | 25.5 | 37.5 | 12.4 | 0.507 |
| Lactobacillus delbrueckii | 39.7 | 64.0 | 28.9 | 0.565 |
| Prevotella copri | 97.8 | 19.8 | 60.6 | 0.375 |
| Lactobacillus mucosae | 21.9 | 19.2 | 15.0 | 0.852 |
| Bifidobacterium thermacidophilum | 41.6 | 15.7 | 18.6 | 0.267 |
| Helicobacter equorum | 0.7 | 0.3 | 0.5 | 0.633 |
| Olsenella profusa | 14.4 | 23.9 | 11.9 | 0.501 |
| Lactobacillus pontis | 2.6 | 18.5 | 10.4 | 0.110 |
| Bifidobacterium boum | 9.8 | 18.8 | 7.7 | 0.342 |
| Blautia wexlerae | 22.0 | 9.4 | 14.7 | 0.552 |
| Mitsuokella multacida | 13.8 | 11.2 | 8.2 | 0.828 |
| Staphylococcus carnosus | 0.7 | 0.4 | 0.4 | 0.688 |
| Weissella cibaria | 1.1 | 2.5 | 2.2 | 0.552 |
| Lactobacillus johnsonii | 17.0 | 14.4 | 17.7 | 0.880 |
| Faecalibacterium prausnitzii | 9.9 | 3.4 | 5.7 | 0.438 |
| Others | 750.1 | 474.5 | 323.9 | 0.527 |
| Total | 1146.1 | 769.4 | 470.5 | 0.540 |
DISCUSSION
Quantifying the absolute abundance enables correlation or regression analyses linking microbes with intestinal health parameters[28,29]. The approach can be further strengthened through meta-analysis, which overcomes the limitations of individual studies. However, quantifying the absolute abundance would be affected by variation in extraction efficiency, PCR amplification bias, 16S rRNA gene copy number heterogeneity, and taxonomic misclassification, highlighting the need for caution during analysis[21,30]. Because the jejunal mucosa typically has a lower bacterial load than feces[24], factors such as host DNA contamination, low-biomass effects, index hopping, and reagent-derived background signals should be considered, and an appropriate spike-in control with high recovery in low-biomass environments should be selected[31].
CONCLUSION
The spike-in control containing 100,000 cells of Imtechella halotolerans and Allobacillus halotolerans can be used to quantify the absolute abundance of microbiota in 100 mg of pig jejunal mucosa. The interpretation of microbiota data can be different depending on whether relative or absolute abundance is evaluated.
DECLARATIONS
Acknowledgments
The Graphical Abstract was created using BioRender (Sung, J., 2026; https://biorender.com/0y1sp5m).
Authors’ contributions
Conceptualization of the manuscript: Kim SW
Lab work and statistical analysis: Sung JY, Choi H, Gormley AR
Writing of the manuscript: Sung JY, Choi H, Gormley AR, Kim SW
Figure: Sung JY, Choi H, Gormley AR
Review and editing of the manuscript: Sung JY, Choi H, Gormley AR, Kim SW
Availability of data and materials
Raw sequencing data have been deposited in the National Center for Biotechnology Information (NCBI) Sequence Read Archive (SRA) under the accession number PRJNA1429549.
AI and AI-assisted tools statement
Not applicable.
Financial support and sponsorship
This work was supported by the North Carolina Agricultural Foundation (Raleigh, NC, USA) and USDA-NIFA Hatch (Washington, DC, USA). The Real Pork Scholars Fellowship (National Pork Board, Des Moines, IA) provided support for Gormley AR.
Conflicts of interest
Kim SW is the Senior Editor of the journal Microbiome Research Reports. Kim SW was not involved in any steps of the editorial process, including reviewers' selection, manuscript handling, and decision-making. The other authors declare that there are no conflicts of interest.
Ethical approval and consent to participate
All animal procedures were approved by the Animal Care and Use Committee (Approval No.: 25-371) of North Carolina State University (Raleigh, NC, USA). Pigs were housed and handled in accordance with institutional guidelines for the care and use of animals.
Consent for publication
Not applicable.
Copyright
© The Author(s) 2026.
Supplementary Materials
REFERENCES
1. Snoeck V, Verfaillie T, Verdonck F, Goddeeris BM, Cox E. The jejunal Peyer’s patches are the major inductive sites of the F4-specific immune response following intestinal immunisation of pigs with F4 (K88) fimbriae. Vaccine. 2006;24:3812-20.
2. Cera KR, Mahan DC, Cross RF, Reinhart GA, Whitmoyer RE. Effect of age, weaning and postweaning diet on small intestinal growth and jejunal morphology in young swine. J Anim Sci. 1988;66:574-84.
3. Mowat AM, Agace WW. Regional specialization within the intestinal immune system. Nat Rev Immunol. 2014;14:667-85.
4. Duarte ME, Kim SW. Significance of mucosa-associated microbiota and its impacts on intestinal health of pigs challenged with F18+ E. coli. Pathogens. 2022;1:589.
5. Adhikari B, Kim SW, Kwon YM. Characterization of microbiota associated with digesta and mucosa in different regions of gastrointestinal tract of nursery pigs. Int J Mol Sci. 2019;20:1630.
6. Davenport M, Poles J, Leung JM, et al. Metabolic alterations to the mucosal microbiota in inflammatory bowel disease. Inflamm Bowel Dis. 2014;20:723-31.
7. Gormley AR, Duarte ME, Deng Z, Kim SW. Saccharomyces yeast postbiotics mitigate mucosal damages from F18+ Escherichia coli challenges by positively balancing the mucosal microbiota in the jejunum of young pigs. Anim Microbiome. 2024;6:73.
8. De Rodas B, Youmans BP, Danzeisen JL, Tran H, Johnson TJ. Microbiome profiling of commercial pigs from farrow to finish. J Anim Sci. 2018;96:1778-94.
9. McCormack UM, Curião T, Buzoianu SG, et al. Exploring a possible link between the intestinal microbiota and feed efficiency in pigs. Appl Environ Microbiol. 2017;83:e00380-17.
10. Zaramela LS, Tjuanta M, Moyne O, Neal M, Zengler K. synDNA-a synthetic DNA spike-in method for absolute quantification of shotgun metagenomic sequencing. mSystems. 2022;7:e0044722.
11. Bruijning M, Ayroles JF, Henry LP, Koskella B, Meyer KM, Metcalf CJE. Relative abundance data can misrepresent heritability of the microbiome. Microbiome. 2023;11:222.
12. Aitchison J. The statistical analysis of compositional data. J R Stat Soc Ser B (Stat Methodol). 1982;44:139-60.
13. Maghini DG, Dvorak M, Dahlen A, et al. Quantifying bias introduced by sample collection in relative and absolute microbiome measurements. Nat Biotechnol. 2024;42:328-38.
14. Wang S, Healy D, Patangia D, et al. Assessment of absolute abundance in mother-infant gut microbiome using marine-sourced bacterial DNA spike-in and comparison with conventional quantification methods. Microbiome Res Rep. 2025;4:23.
15. Seiler CL, Kiflen M, Stefanolo JP, et al. Probiotics for celiac disease: a systematic review and meta-analysis of randomized controlled trials. Am J Gastroenterol. 2020;115:1584-95.
16. Stämmler F, Gläsner J, Hiergeist A, et al. Adjusting microbiome profiles for differences in microbial load by spike-in bacteria. Microbiome. 2016;4:28.
17. Odom AR, Faits T, Castro-Nallar E, Crandall KA, Johnson WE. Metagenomic profiling pipelines improve taxonomic classification for 16S amplicon sequencing data. Sci Rep. 2023;13:13957.
18. Oshiro M, Nakamura K, Tashiro Y. Challenge of validation in whole-cell spike-in amplicon sequencing to comprehensively quantify food lactic acid bacteriota. Biosci. Biotechnol. Biochem. 2025;89:294-303.
19. Tourlousse DM, Yoshiike S, Ohashi A, Matsukura S, Noda N, Sekiguchi Y. Synthetic spike-in standards for high-throughput 16S rRNA gene amplicon sequencing. Nucleic Acids Res. 2017;45:e23.
20. Rao C, Coyte KZ, Bainter W, Geha RS, Martin CR, Rakoff-Nahoum S. Multi-kingdom ecological drivers of microbiota assembly in preterm infants. Nature. 2021;591:633-8.
21. Tkacz A, Hortala M, Poole PS. Absolute quantitation of microbiota abundance in environmental samples. Microbiome. 2018;6:110.
22. Kallastu A, Malv E, Aro V, et al. Absolute quantification of viable bacteria abundances in food by next-generation sequencing: quantitative NGS of viable microbes. Curr Res Food Sci. 2023;6:100443.
23. Chen K, Hu Z, Xia Z, Zhao D, Li W, Tyler JK. The overlooked fact: fundamental need for spike-in control for virtually all genome-wide analyses. Mol Cell Biol. 2015;36:662-7.
24. Lyra A, Forssten S, Rolny P, et al. Comparison of bacterial quantities in left and right colon biopsies and faeces. World J Gastroenterol. 2012;18:4404-11.
26. Zymo Research. Instruction Manual: ZymoBIOMICS™ Spike-in Control I (High Microbial Load). Ver. 1.1.5. Available from https://files.zymoresearch.com/protocols/_d6320_zymobiomics_spike-in_control_i.pdf. [accessed 16 March 2026].
27. Pan P, Gu Y, Sun DL, Wu QL, Zhou NY. Microbial diversity biased estimation caused by intragenomic heterogeneity and interspecific conservation of 16S rRNA genes. Appl Environ Microbiol. 2023;89:e0210822.
28. Barlow JT, Bogatyrev SR, Ismagilov RF. A quantitative sequencing framework for absolute abundance measurements of mucosal and lumenal microbial communities. Nat Commun. 2020;11:2590.
29. Yao H, Lu S, Williams BA, Flanagan BM, Gidley MJ, Mikkelsen D. Absolute abundance values reveal microbial shifts and co-occurrence patterns during gut microbiota fermentation of dietary fibres in vitro. Food Hydrocolloids. 2022;127:107422.
30. Bonk F, Popp D, Harms H, Centler F. PCR-based quantification of taxa-specific abundances in microbial communities: quantifying and avoiding common pitfalls. J Microbiol Methods. 2018;153:139-47.
Cite This Article
How to Cite
Download Citation
Export Citation File:
Type of Import
Tips on Downloading Citation
Citation Manager File Format
Type of Import
Direct Import: When the Direct Import option is selected (the default state), a dialogue box will give you the option to Save or Open the downloaded citation data. Choosing Open will either launch your citation manager or give you a choice of applications with which to use the metadata. The Save option saves the file locally for later use.
Indirect Import: When the Indirect Import option is selected, the metadata is displayed and may be copied and pasted as needed.
About This Article
Copyright

Data & Comments
Data
0


Comments
Comments must be written in English. Spam, offensive content, impersonation, and private information will not be permitted. If any comment is reported and identified as inappropriate content by OAE staff, the comment will be removed without notice. If you have any queries or need any help, please contact us at support@oaepublish.com.