


The coupling relationships among the crystal structure, electronic structure, and physical properties of PrMn2Ge2 during its magnetic transition
 0
0 Abstract
Magnetic phase transitions govern the performance frontier of spintronic technologies, yet their microscopic origins in complex intermetallics remain elusive. Here, we resolve this challenge through a combined Physical Property Measurement System (PPMS), in situ X-ray diffraction (XRD), and Maximum Entropy Method (MEM) study of PrMn2Ge2, revealing that thermally driven electron transfer from Ge-4p to Mn-3d orbitals serves as the dominant mechanism for its sequential transitions: canted ferromagnetic (Fmc, 330 K) → conical magnetic order (Fmiab). Crucially, this directional charge migration first enhances Mn-Ge covalency, thereby driving lattice contraction; this amplified covalency subsequently strengthens Mn-Mn exchange interactions, inducing magnetic reorganization; finally, the resultant electron depletion at Pr sites weakens 4f spin chirality, consequently suppressing topological transport. We thereby propose an electron-lattice-magnetism triple-coupling theory. Building directly on our discovery of electron-transfer-driven phase transitions, this framework establishes
Keywords
INTRODUCTION
Controllable magnetic transition technology has become increasingly important for advancing magnetic materials in applications such as data storage[1], thermal energy storage[2], and magnetic refrigeration[3-5]. These transitions can generate critical functionalities including superconductivity, ferroelectricity, and changes in magnetic or crystallographic structures, making them central to material performance[6,7]. When external conditions change, magnetic states respond accordingly. Temperature is a primary factor driving magnetic phase transitions, as it disrupts the balance between internal interactions and thermal fluctuations, altering system symmetry.
Ternary intermetallic compounds RT2X2 (R = rare earth, T = transition metal, X = Ge, Si) exhibit unique chemical coordination environments that enable distinctive magnetic transitions. Notably, compounds with light rare earth elements (La, Ce, Pr, Nd) can host magnetic skyrmions, considered highly promising for magnetic storage. Additionally, their incommensurate magnetic structures enrich available magnetic states, offering new possibilities for transition-based devices.
Compared to LaMn2Ge2[8] and CeMn2Ge2[9,10], PrMn2Ge2 and NdMn2Ge2 exhibit more complex magnetic transitions due to Pr and Nd’s magnetic properties[11,12]. NdMn2Ge2 undergoes a transition to the Fmiab state at Tsr = 214 K, far below room temperature, limiting its practical applicability[12]. In contrast, PrMn2Ge2 displays multiple magnetic states. The Fmiab state emerges near 280 K, and its magnetic skyrmions remain stable from 90-310 K-both ranges approaching room temperature[13-15]. These characteristics make PrMn2Ge2 particularly promising for developing room-temperature magnetic transition devices. Its broad magnetic state temperature range also renders it ideal for investigating the mechanisms underlying different magnetic phase formations.
Previous neutron scattering studies revealed that PrMn2Ge2 (TC = 330 K) adopts an easy-axis canted ferromagnetic structure (Φ≈60°), transitioning below 250 K to a conical magnetic structure (Φ≈60°) on the Mn sublattice[11]. Perturbed angular correlation (PAC) and magnetization measurements further characterized its magnetic properties[16]. Figure 1 summarizes the temperature-dependent magnetic structures. As temperature decreases, PrMn2Ge2 undergoes sequential magnetic phase transitions: at the Néel temperature (TN = 415 K), it transitions from a paramagnetic (PM) to a collinear antiferromagnetic (AFM) state; near the Curie temperature (TC≈330 K), it evolves into a canted ferromagnetic state (Fmc). Upon further cooling to the spin-reorientation temperature (Tsr≈280 K), an intralayer antiferromagnetic state emerges while conical ferromagnetic order (Fmiab) persists along the c-axis. The Fmiab structure remains stable after magnetic ordering initiates in the Pr sublattice below TC(Pr)≈40 K. At this time, the antiferromagnetic component within the Mn sublattice coexists with the conical ferromagnetic state along the c-axis and the ferromagnetic order of the Pr sublattice along the c-axis, forming a mixed magnetic structure of Fmiab + FMPr[13-15]. The conical ferromagnetic state of PrMn2Ge2 near room temperature allows its magnetic domains to arrange into a stable magnetic skyrmion state[17]. This magnetic state has broad application potential in spintronic devices[18], quantum computing[19], and future low-power information technology devices[20]. The Topological Hall Effect (THE) is considered an important criterion for determining whether a magnetic material has a skyrmion magnetic structure[17].
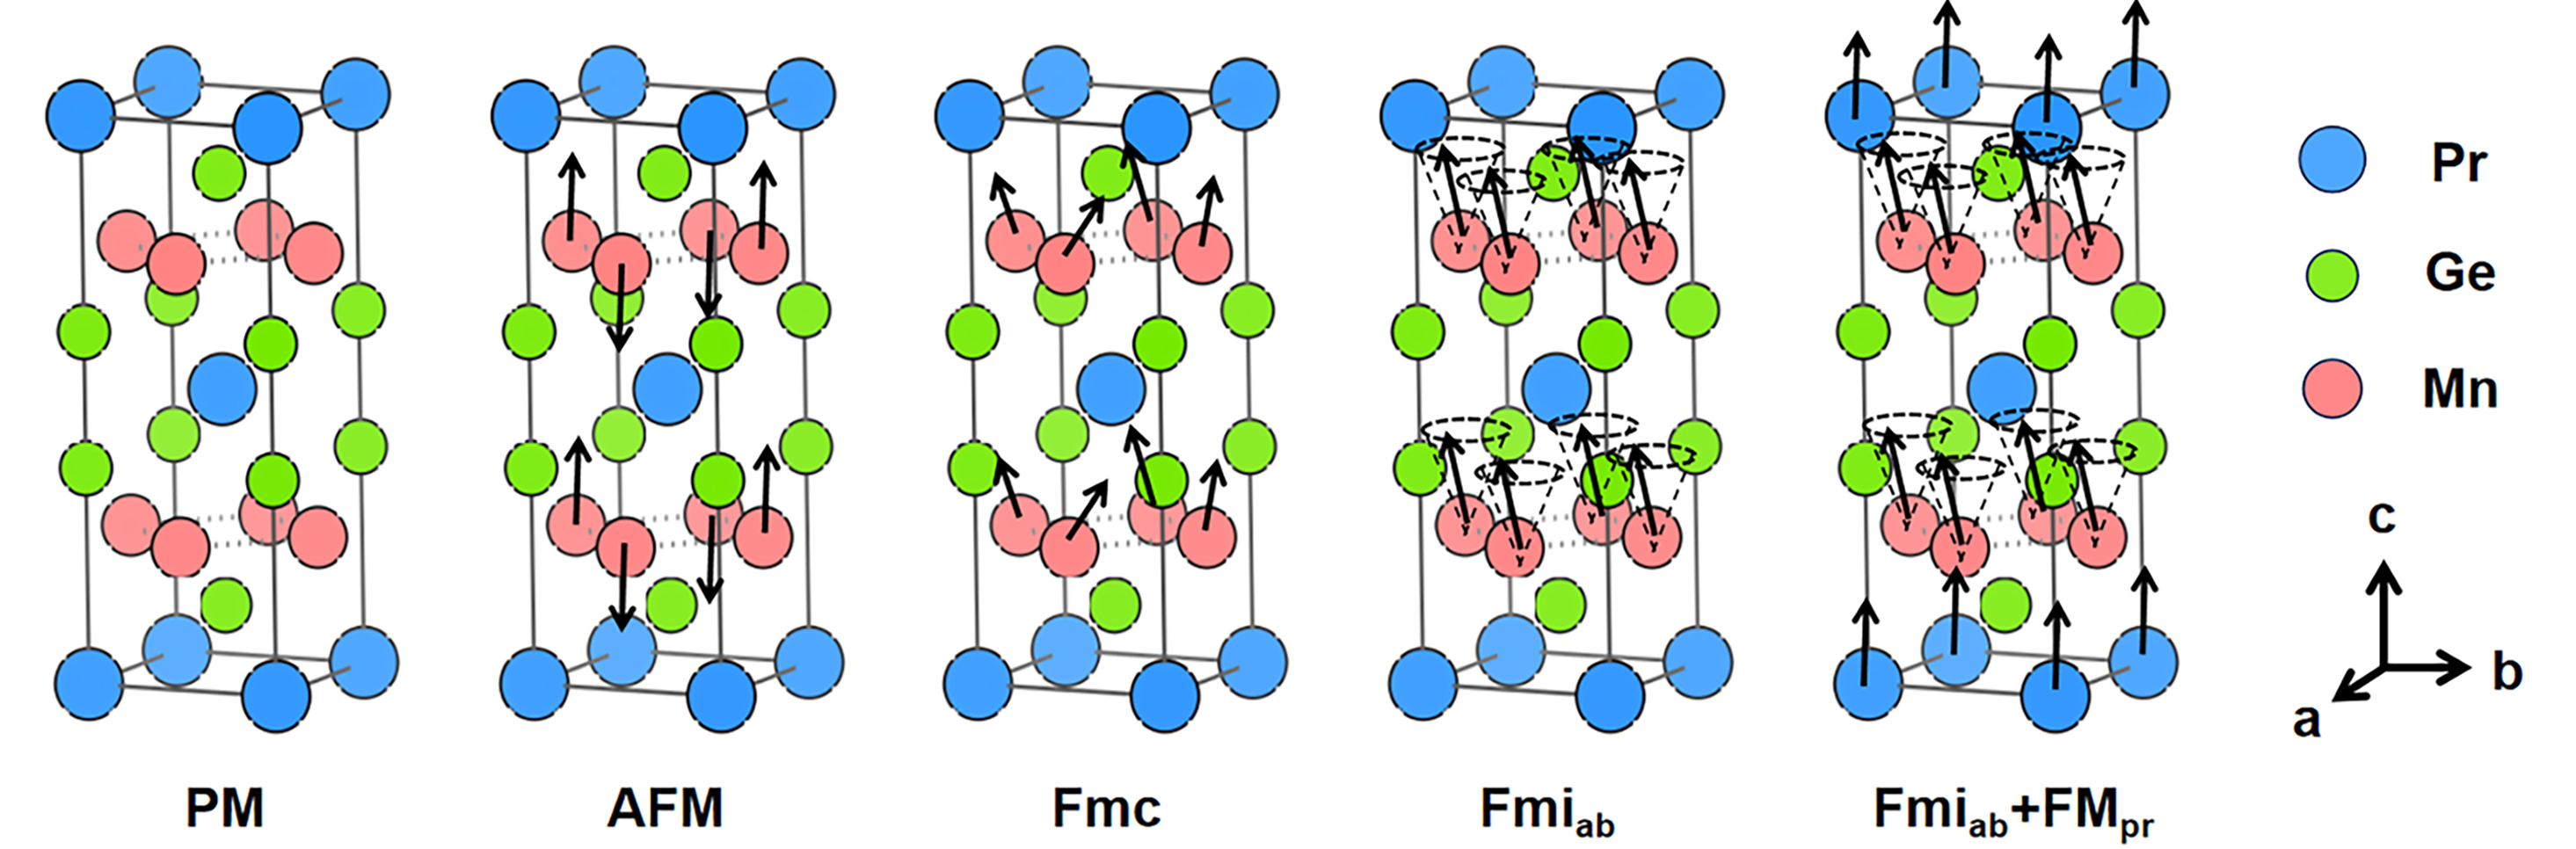
Figure 1. Polycrystal and magnetic structures of PrMn2Ge2 at different temperatures. PM: Paramagnetic; AFM: antiferromagnetic; Fmc: canted ferromagnetic; Fmiab: conical ferromagnetic order.
Previous studies establish that multiple magnetic transitions in these compounds fundamentally originate from reorganization within the manganese sublattice. Crucially, near room temperature, this sublattice undergoes an AFM-to-Fmc transition[21,22], where the magnetic state evolution exhibits strong dependence on Mn-Mn bonding distances-particularly within the crystallographic ab-plane[23,24]. Consequently,
The versatility of MEM in resolving electronic drivers of phase behavior is well-demonstrated: Pavithra et al. revealed that Fe doping converts SnS2’s bonding from ionic to covalent, explaining the reduced bandgap and enhanced semiconducting properties[26]; Li et al. revealed significant charge accumulation between O atoms in the B2O2 ring of KZnB3O6[27]; furthermore, Kuroiwa et al. definitively pinpointed the intrinsic origins of PbTiO3’s ferroelectricity using MEM analysis[28].
Building upon this foundation, our work pioneers an electron-motion perspective for magnetic transitions. We uniquely integrate electron flow trajectories during transitions with concurrent lattice constant variations and macroscopic property changes. This tripartite approach not only delivers unprecedented mechanistic insights into transition physics but also establishes a rational framework for designing magnetic skyrmion materials. Ultimately, our methodology provides a direct pathway to artificially induce and precisely control skyrmion states for spintronic and low-power computing applications.
This study synthesized PrMn2Ge2 polycrystals via induction-melting with spark plasma sintering (SPS). The material’s magnetic transition temperatures were determined from magnetization-temperature (M-T) curves and corroborated by temperature-dependent hysteresis loops. Notably, field-derivative analysis of these loops revealed signatures of the THE-a finding conclusively validated through experimental and calculated Hall resistivity data showing significant topological Hall signals. To establish structure-property relationships across phase transitions, temperature-dependent in situ XRD was employed to track structural evolution. Rietveld refinement of these diffraction patterns yielded precise lattice parameters and electron density distributions, enabling direct quantification of interatomic electron migration during magnetic transformations. By integrating lattice constant measurements, electron density assessments, and magnetic property tests near the magnetic transition temperature, we analyzed the direction of electron flow in
MATERIALS AND METHODS
Sample preparation
In a highly pure argon environment, praseodymium (Pr, 99.9%), manganese (Mn, 99.99%), and germanium (Ge, 99.99%) were loaded into an alumina (Al2O3) crucible in stoichiometric proportions. All elements were purchased from Shanghai Macklin Biochemical Co., Ltd. (Shanghai, China). During the melting process, the loss of manganese could affect the elemental ratio; therefore, an additional 5%-10% Mn was added. To improve the internal uniformity of the material and increase its purity, the crucible was placed into an induction melting furnace (CYKY-IMC-500, Cheng Yue, Zhengzhou, China) and remelted at least three times. The obtained ingot sample was subsequently removed for ball milling (Shanghai Huayan Instrument Equipment Co., Ltd., Shanghai, China). The resulting powder sample was placed into a spark plasma sintering (SPS) furnace (DR. Sinter SPS-3.2-MV, Sumitomo Coal Mining Co., Ltd., Tokyo, Japan). The residual pressure is 8-10 Pa, and the temperature rises to 1,233 K at the rate of 60-70 K/min; while the pressure rises to 9.4 kN, the sintering pressure is 30 MPa, and then the heat is kept for about 10 min under the conditions of 1,233 (±5) K.
Magnetic and transport measurements
Magnetization measurements were performed using a Physical Property Measurement System (PPMS-14LH, Quantum Design, San Diego, CA, USA). Following sample preparation, where bulk specimens were polished into uniformly thin platelets (3.6 × 1.8 × 0.13 mm3) to ensure that the thickness was negligible compared to lateral dimensions, we employed the standard six-electrode configuration for simultaneous acquisition of longitudinal resistivity (ρxx) and Hall resistivity (ρxy). Employing this six-electrode configuration, we measured magnetotransport properties under isothermal conditions between 160-310 K, applying magnetic fields up to 5 T with a constant 5,000 μA excitation current.
Subsequent analysis involved linear fitting of high-field ρxy data to extract two key parameters: the normal Hall coefficient (R0) from the zero-field intercept, and the field-independent coefficient SA from the slope, which represents the slope of the line and is independent of the magnetic field. Thereafter, the total Hall Effect (HE) minus the Normal Hall Effect (NHE) and the Anomalous Hall Effect (AHE) are employed to compute the topological Hall resistivity[29]. More detailed measurement and calculation methods are provided in Supplementary Figure 1 and Supplementary Equations 1-3.
Electron density calculation
Following powder preparation via bulk sample grinding, temperature-dependent structural evolution was characterized using a Bruker D8 (The D8 Advances powder XRD equipment produced by the German Bruker company) diffractometer equipped with a variable-temperature stage. Measurements employed Cu-Kα2 radiation, 2θ = 10°-144°, a 0.1 mm slit, and a step interval of 0.02°, ensuring optimal signal-to-noise ratios. Critically, Rietveld refinement implemented in Topas software minimized residuals through least-squares optimization of structural parameters, thereby extracting temperature-resolved lattice constants, bond lengths, atomic coordinates, and anisotropic displacement parameters. The refined method and results are presented in the Supplementary Materials.
To probe electronic reorganization mechanisms, we subsequently applied the MEM-a Bayesian probability approach that determines the most probable electron density distribution consistent with experimental structure factors while maximizing configurational entropy. Unlike conventional Fourier methods, MEM overcomes phase limitations by iteratively optimizing the probability functional. This formalism enables robust charge density mapping even with incomplete or noisy diffraction data, as implemented via the RainbowMEM-1.2.4 software’s MEM module. Consequently, we derived high-fidelity 3D electron density distributions across phase transitions, enabling direct visualization of interatomic charge migration during magnetic transformations. The software can be obtained by sending an email to
RESULTS AND DISCUSSION
The field-dependent magnetization (M-H) of PrMn2Ge2 [Figure 2A] reveals a systematic reduction in saturation magnetization upon cooling, indicating the development of magnetic frustration or competing exchange interactions at low temperatures. Concomitantly, a sharp ferromagnetic response emerges at
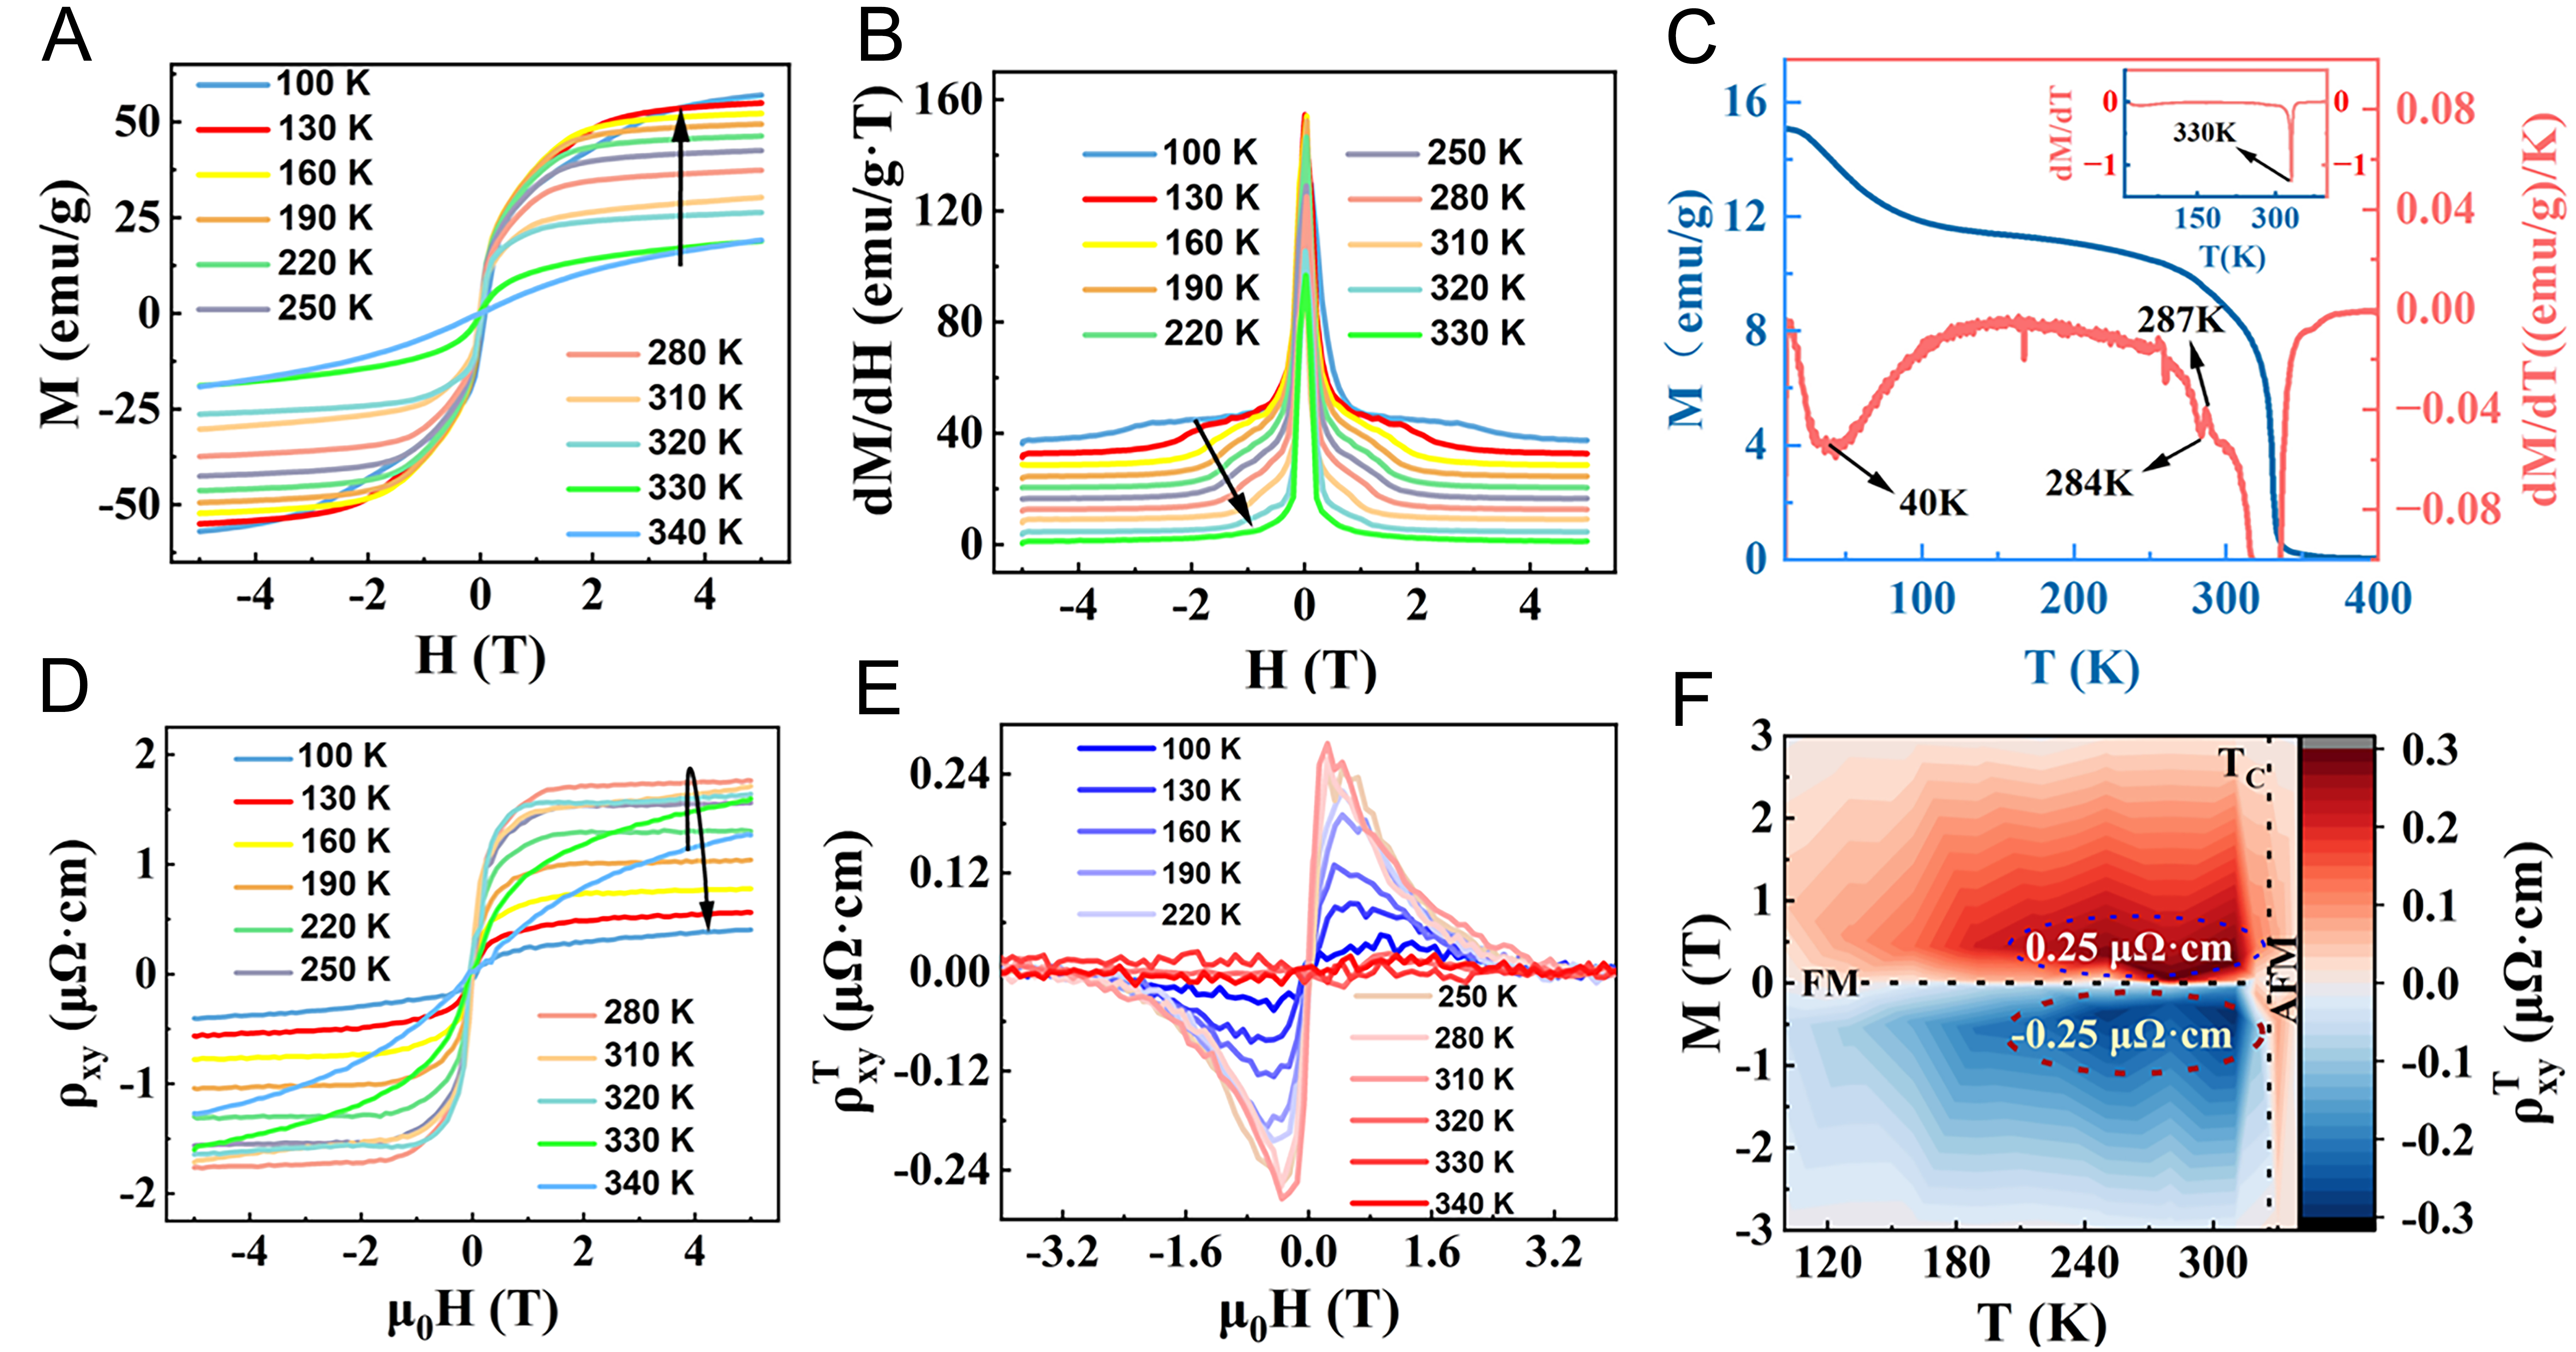
Figure 2. (A) Magnetic hysteresis loop at different temperatures; (B) first derivative analysis of M with respect to H at various temperatures; (C) temperature dependence of magnetization (blue), enlarged view of dM/dT-T (red; the insets indicate the whole dM/dT-T curves; (D) magnetic field dependence of some representative Hall resistivities (ρxy) at different temperatures; (E) temperature-influenced characterization of the THE intensity in response to applied magnetic field variations; (F) magnetic phase diagram of PrMn2Ge2. THE: Topological Hall effect.
Further insight emerges from the derivative dM/dH analysis [Figure 2B]: A persistent low-field peak
The temperature-dependent magnetization (M-T) of PrMn2Ge2 under B // c (0.05 T) reveals complex magnetic phase transitions, as evidenced by sharp anomalies in both M-T and dM/dT curves [Figure 2C]. Most prominently, the dominant peak at 330 K in dM/dT signifies the paramagnetic-to-ferromagnetic transition of the Mn sublattice, establishing the bulk Curie temperature (TC = 330 K). Subsequently, a bifurcated spin-reorientation transition (Fmc → Fmiab) occurs between 287 K and 284 K (Tsr), reflecting a two-step process that implies strong magnetocrystalline anisotropy and potential decoupling of Mn spin subsystems. Notably, the narrow 3 K separation of these transitions points to significant spin-lattice coupling or competing exchange interactions. Meanwhile, the dM/dT feature at 260 K is not an independent transition but rather thermal hysteresis from the 284 K event, confirming the first-order nature of the reorientation. At lower temperatures, the distinct 40 K transition corresponds to ferromagnetic ordering of the Pr3+ moments [TC(Pr)], thereby highlighting the dual-sublattice magnetism characteristic of rare-earth intermetallics.
We measured the electrical transport properties of PrMn2Ge2 using a Physical Property Measurement System (PPMS). Figure 2D presents the magnetic field dependence of the Hall resistivity (ρxy) at various temperatures. As temperature increases, ρxy rises, peaks at 280 K, and subsequently decreases. This feature coincides with the Fmc → Fmiab magnetic transition occurring near this temperature. By processing the Hall resistivity data obtained at various temperatures, we obtained the corresponding topological Hall resistivity ρTxy, shown in Figure 2E. ρTxy exhibits an increasing trend with temperature, reaching a maximum value of 0.27 μΩ cm at 310 K. Notably, above 220 K, the temperature dependence of ρTxy weakens significantly, stabilizing around 0.25 μΩ cm.
Utilizing these results, we constructed the magnetic phase diagram of PrMn2Ge2, displayed in Figure 2F. Analysis of the phase diagram confirms a THE signature within the temperature range of 100 K to 320 K. The intensity of the THE, quantified by ρTxy, increases with temperature, reaching a maximum around
Structural characterization via Rietveld refinement confirmed that the polycrystalline PrMn2Ge2 ingot crystallizes in the body-centered tetragonal ThCr2Si2-type structure (space group I4/mmm). The measured XRD pattern, along with the corresponding Rietveld refinement profile, is presented in Figure 3. Refinement yielded excellent agreement factors (Rp = 3.07%), and the derived structural parameters are summarized in Table 1.
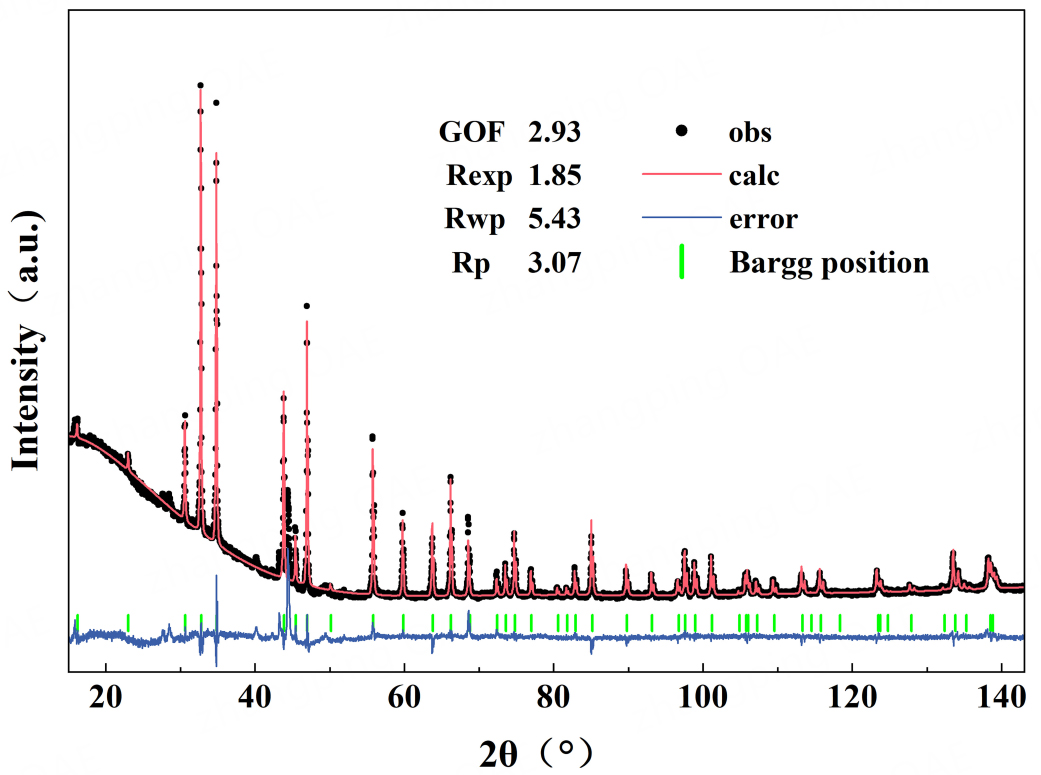
Figure 3. Rietveld refinement of the powder X-ray diffraction pattern.
Crystal and structure parameters of PrMn2Ge2 polycrystalline samples at 300 K
| Atom | x | y | z | Occ | U | site |
| Pr | 0 | 0 | 0 | 1 | 1.233 | 2a |
| Mn | 0 | 0.25 | 0.5 | 1 | 1.670 | 4d |
| Ge | 0 | 0 | 0.3826 (4) | 1 | 1.427 | 4e |
Notably, the refinement identified a minor secondary phase, evidenced by a low-intensity peak at 44.4° absent in the standard PrMn2Ge2 reference (PDF card: 01-072-8961). This peak aligns with the dominant
To probe potential structural modifications accompanying the magnetic phase transitions, we performed in situ temperature-dependent XRD measurements. The collected diffraction patterns [Supplementary Figure 2] reveal no emergence of new Bragg reflections across the measured temperature range (100 K to 320 K), indicating the preservation of the tetragonal I4/mmm structure throughout. However, a detailed analysis of peak positions unveiled systematic shifts, the nature of which varied significantly with diffraction angle. Specifically, we focused on the temperature evolution of representative low-angle [e.g., (1 1 0)] and
Diffraction angles (2θ) for (hkl) planes at selected temperatures
| T (K) 2θ (°) (hkl) | (1 1 0) | (0 0 4) | (1 1 2) | (2 2 0) | (2 2 2) | (0 0 8) |
| 335 | 30.569 | 32.703 | 34.781 | 63.697 | 66.153 | 68.520 |
| 327 | 30.578 | 32.697 | 34.779 | 63.699 | 66.157 | 68.530 |
| 325 | 30.579 | 32.705 | 34.781 | 63.694 | 66.159 | 68.530 |
| 323 | 30.579 | 32.708 | 34.784 | 63.699 | 66.161 | 68.53 |
| 321 | 30.578 | 32.699 | 34.783 | 63.698 | 66.162 | 68.532 |
| 316 | 30.578 | 32.707 | 34.782 | 63.697 | 66.167 | 68.541 |
| 300 | 30.58 | 32.712 | 34.79 | 63.695 | 66.171 | 68.549 |
| 290 | 30.579 | 32.715 | 34.798 | 63.699 | 66.175 | 68.553 |
| 287 | 30.586 | 32.712 | 34.922 | 63.701 | 66.167 | 68.568 |
| 284 | 30.583 | 32.714 | 34.792 | 63.703 | 66.172 | 68.567 |
| 281 | 30.584 | 32.709 | 34.800 | 63.702 | 66.179 | 68.567 |
| 279 | 30.588 | 32.713 | 34.800 | 63.701 | 66.179 | 68.562 |
| 277 | 30.565 | 32.715 | 34.785 | 63.701 | 66.354 | 68.554 |
By fitting the diffraction curves obtained at various temperatures, the lattice states of the compounds at those temperatures were deduced. Then, we can obtain the lattice constants, bond lengths, atomic occupancies, and average thermal vibration levels of the atoms within the crystal. The results of X-ray refinement at different temperatures are provided in Supplementary Table 1.
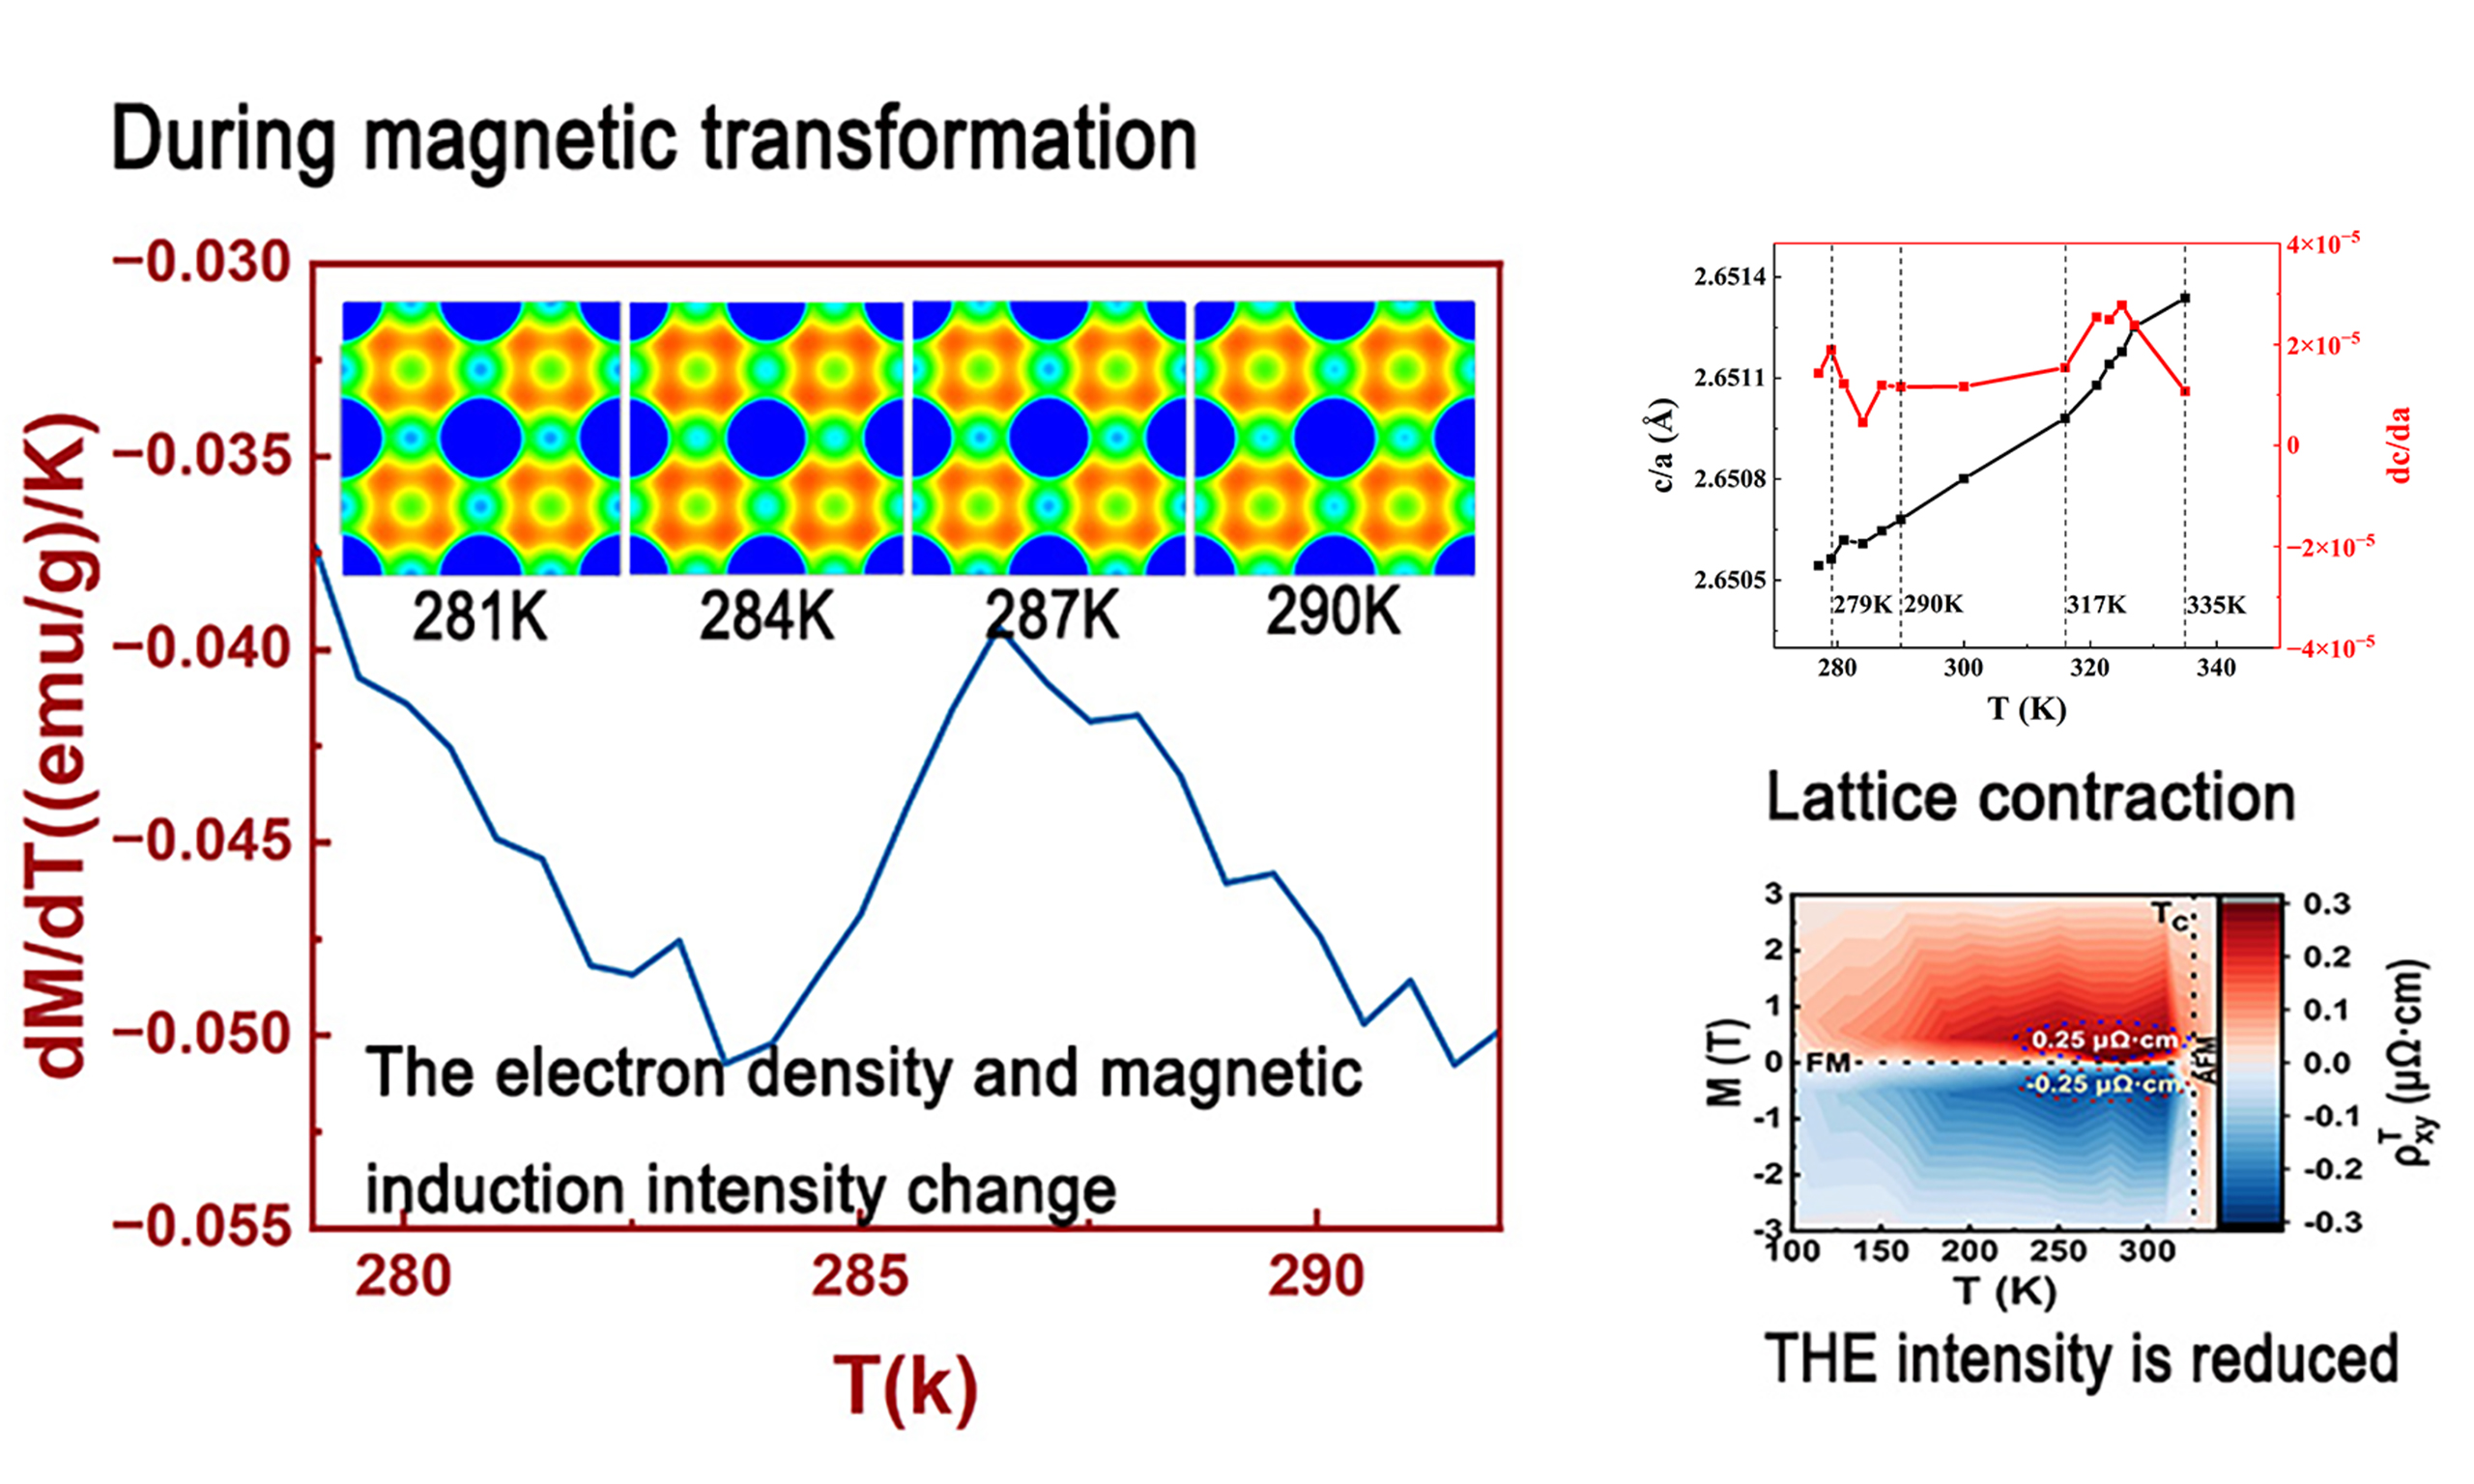
During the magnetic phase transition, lattice constants generally follow thermal contraction behavior as temperature decreases. However, a distinct anomaly emerges near the magnetic transition temperature (TC). As the temperature approaches TC from above, interlayer ferromagnetic ordering of the Mn moments develops. This onset of magnetic order correlates with a deviation in the lattice parameter evolution, as evidenced in Figure 4A and B. Both the a-axis and c-axis lattice constants exhibit a decrease with cooling (with the trends for daMn-Mn and dcMn-Mn mirroring those of a and c, respectively).
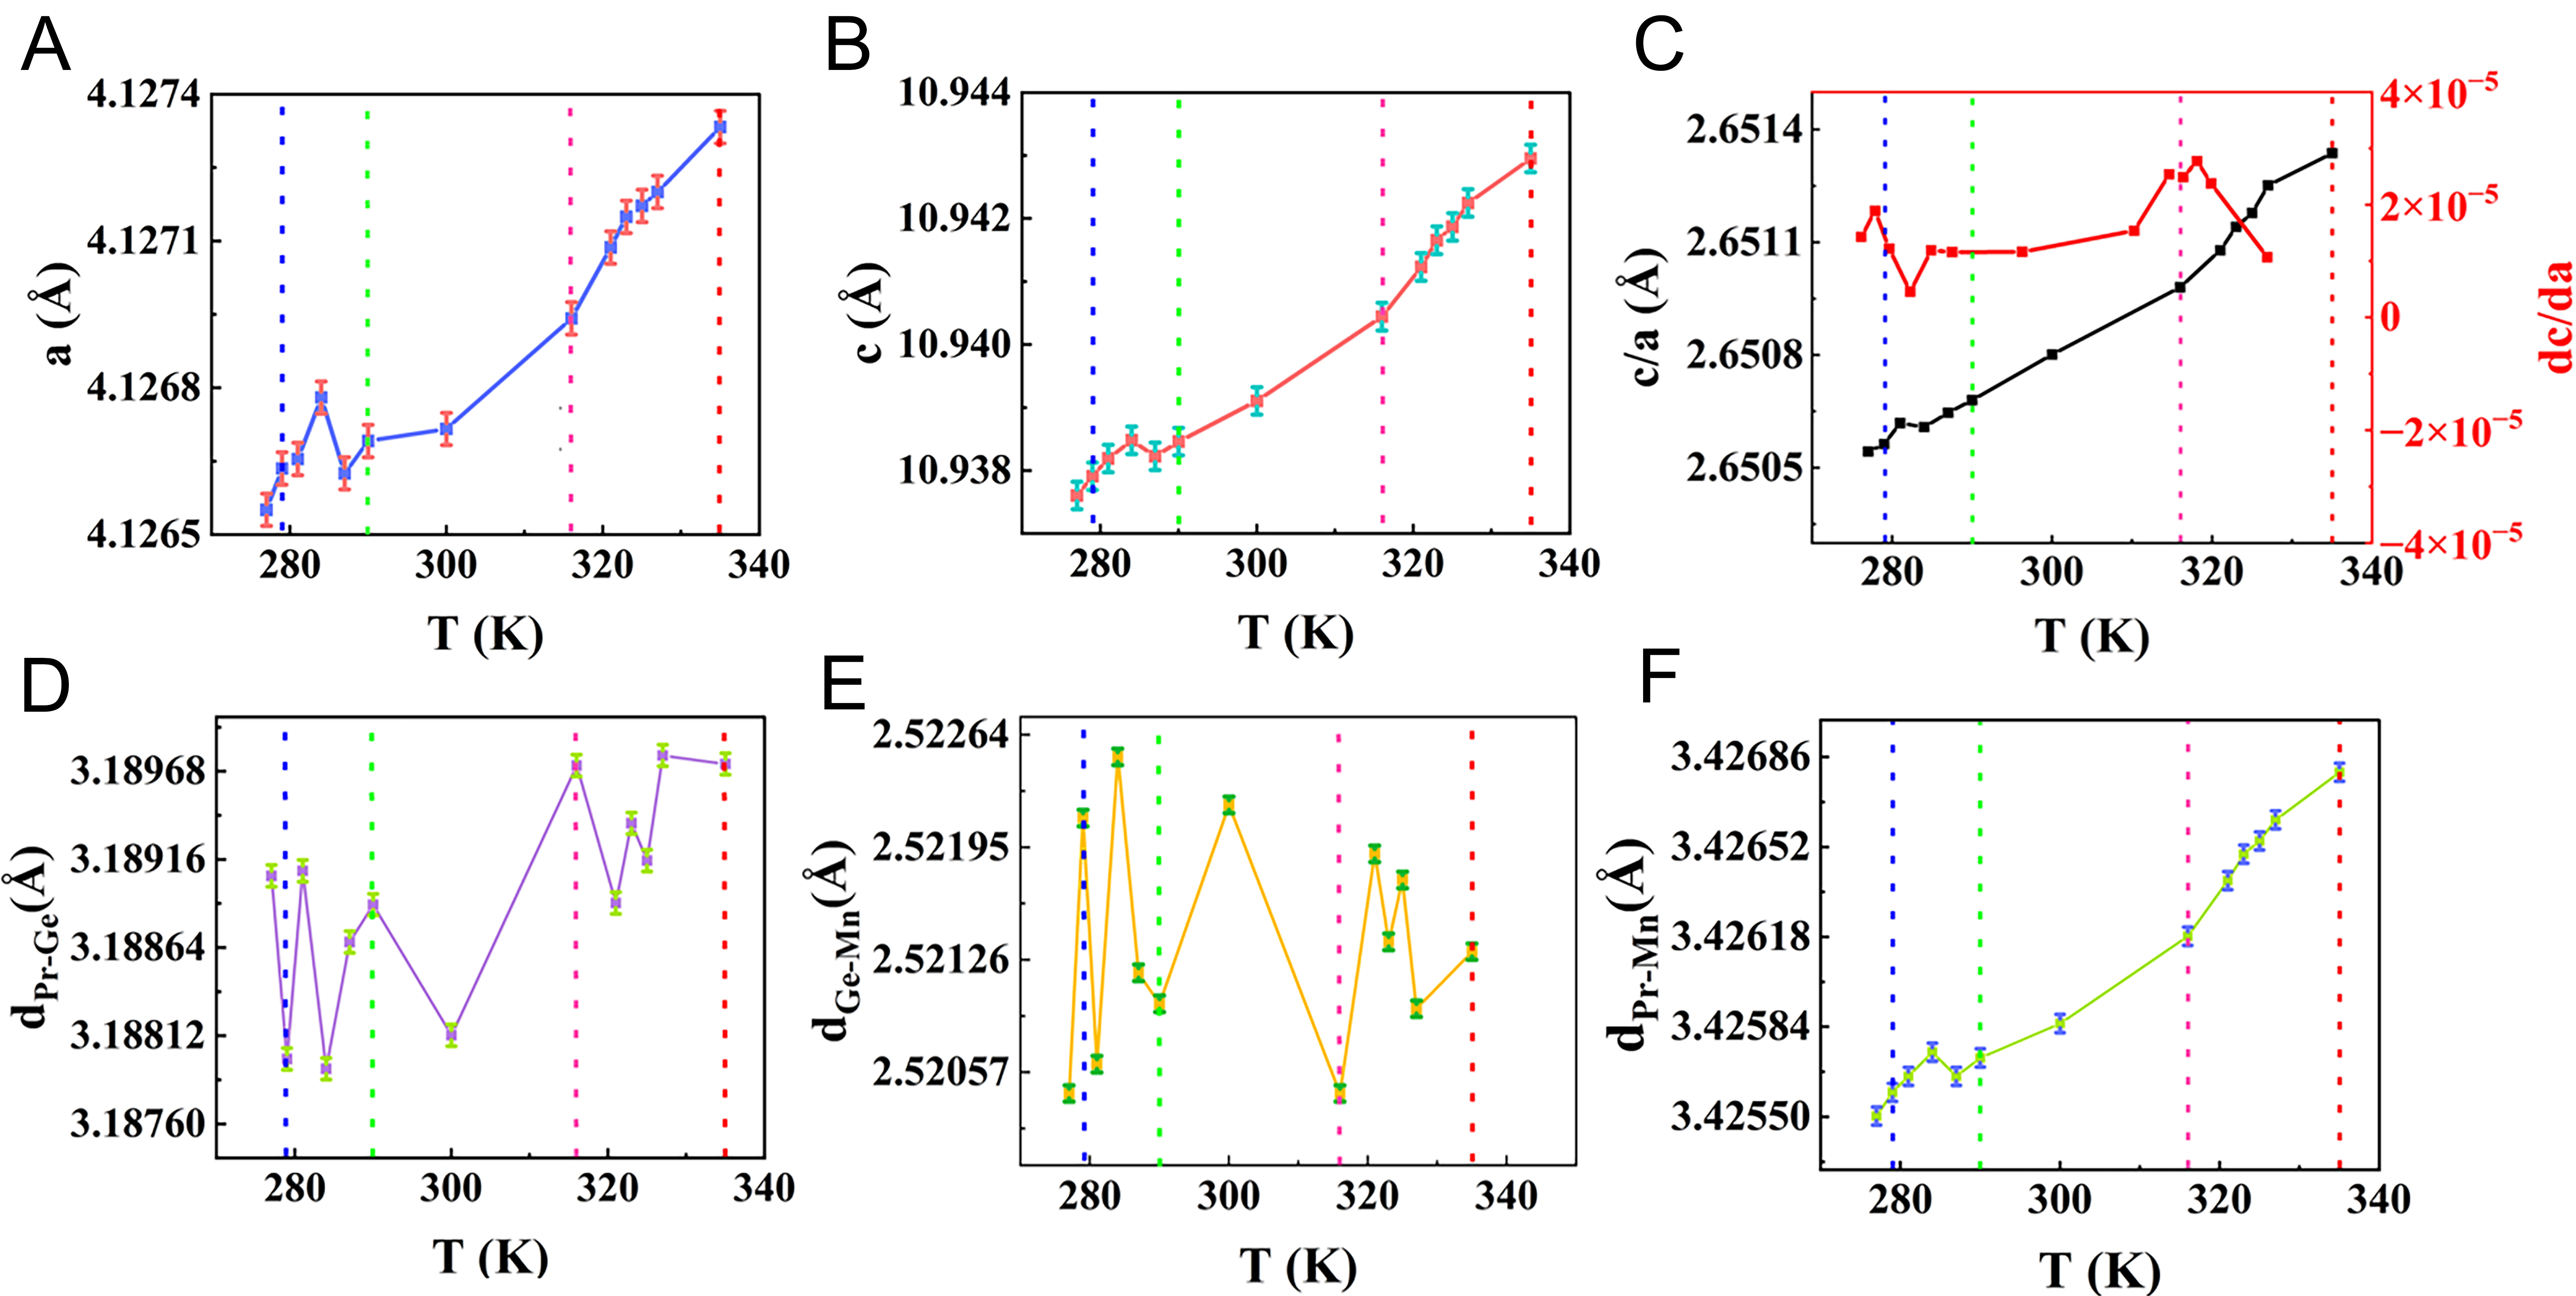
Figure 4. The variation in the lattice constant with temperature and the red, pink, green, and blue dotted lines correspond to the temperature points of 335, 317, 290 and 274 K, respectively. (A) the lattice constant a; (B) the lattice constant c; (C) the ratio of c-a (black) and the derivative of c-a (red) at different temperatures; (D) the distance between Pr-Ge along the c-axis; (E) the distance between adjacent Ge-Mn; (F) the distance between adjacent Pr-Mn.
To quantitatively characterize the lattice response, we calculated the c/a ratio and performed a
Upon cooling to the spin-reorientation temperature TSR, antiferromagnetic ordering emerges within the Mn sublattices. Concurrently, both lattice parameters a and c exhibit further contraction beyond their behavior near TSR [Figure 4A and B]. Notably, anomalous lattice dynamics manifest near TSR, characterized by
At 284 K, where the first derivative of the magnetization curve [Figure 2C] displays a discontinuity, both a and c reach their maxima. This coincides with the onset of accelerated change in the c/a ratio (red curve, Figure 4C) observed at 287 K - a temperature corresponding to the peak in the M-T curve [Figure 2C].
While the Pr-Ge bond length dPr-Ge [Figure 4D] shows irregular behavior, its c-axis component displays an anticorrelation with dGe-Mn [Figure 4E]. Contrastingly, dPr-Mn [Figure 4F] follows the thermal evolution of lattice parameter c without oscillatory features. This suggests dynamic displacement of Ge atoms along the Pr-Mn axis. The specific lattice constants and interatomic distance values are shown in Table 3.
Temperature dependence of lattice constants and interatomic distances
| T (K) | a (Å) | c (Å) | c/a (Å) | dcPr-Ge (Å) | dcGe-Mn (Å) | dPr-Mn (Å) |
| 335 | 4.12733 | 10.94295 | 2.65134 | 3.18972 | 2.52131 | 3.42680 |
| 327 | 4.12720 | 10.94225 | 2.65125 | 3.18977 | 2.52096 | 3.42662 |
| 325 | 4.12717 | 10.94187 | 2.65118 | 3.18915 | 2.52175 | 3.42654 |
| 323 | 4.12715 | 10.94165 | 2.65114 | 3.18937 | 2.52137 | 3.42649 |
| 321 | 4.12709 | 10.94123 | 2.65108 | 3.18890 | 2.52191 | 3.42639 |
| 316 | 4.12694 | 10.94044 | 2.65098 | 3.18971 | 2.52044 | 3.42618 |
| 300 | 4.12673 | 10.93900 | 2.65080 | 3.18812 | 2.52221 | 3.42585 |
| 290 | 4.12668 | 10.93851 | 2.65068 | 3.18889 | 2.52099 | 3.42572 |
| 287 | 4.12663 | 10.93823 | 2.65064 | 3.18867 | 2.52118 | 3.42565 |
| 284 | 4.12678 | 10.93848 | 2.65061 | 3.18792 | 2.52250 | 3.42574 |
| 281 | 4.12665 | 10.93819 | 2.65062 | 3.18909 | 2.52062 | 3.42565 |
| 279 | 4.12664 | 10.93791 | 2.65056 | 3.18798 | 2.52213 | 3.42559 |
| 277 | 4.12655 | 10.93760 | 2.65054 | 3.18906 | 2.52044 | 3.42550 |
On the basis of the refined results, the experimental electron density was calculated via the MEM to investigate the alterations in the electron density distribution prior to and following the magnetic transition. The calculation principle of MEM is provided in Supplementary Equations 4 and 5. Figure 5 depicts the variations in electron density distributions during the transition from the collinear antiferromagnetic state to the canted ferromagnetic state in TC. The images captured at temperatures of 335 K and 317 K represent the electron density distributions within the lattice before and after the magnetic transition, respectively. We analyze the temperature-dependent changes in electron density distributions within different atomic layers. Compared with the electron density distribution at 335 K, the intensity is much higher at 317 K, which corresponds to the reduction in the lattice constants observed in Figure 4A and B. Lattice contraction is manifested in the electronic density distribution as an increase in intensity, but during the process from
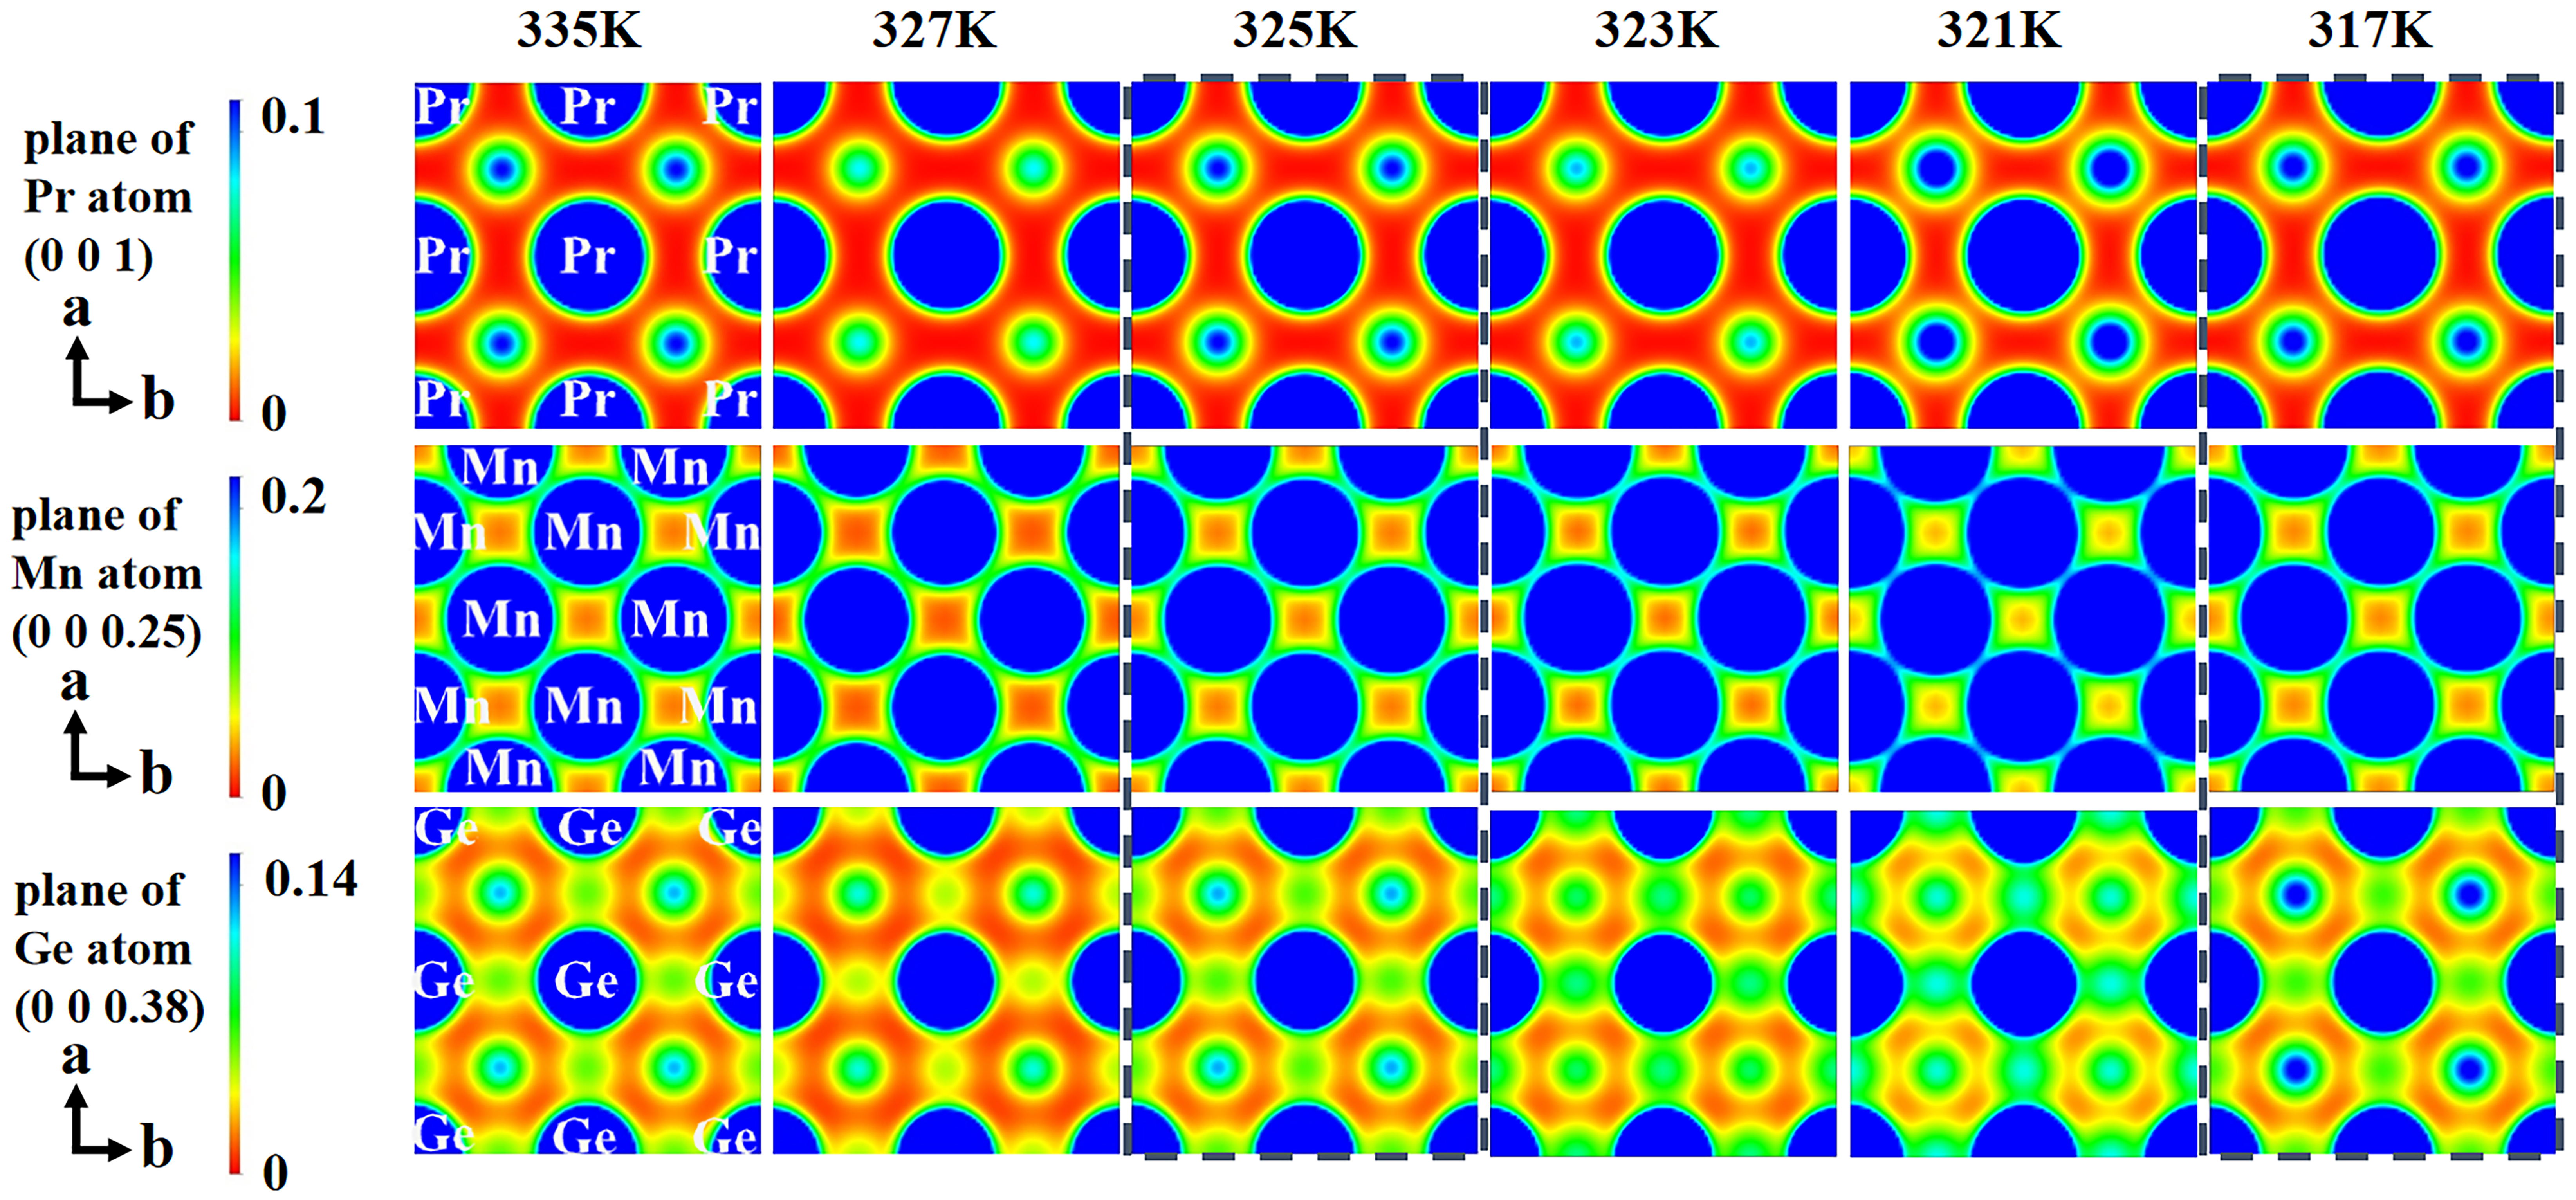
Figure 5. Evolution of electron density distribution (335-317 K); the unit is eÅ-3; isosurface plots on the (0 0 z) plane at l = z; red regions: electron density ≤ 0 eÅ-3, blue regions: electron density ≥ maximum scale value (see colorbar); color variations at fixed positions indicate electron density changes, blue shift (enhancement) versus red shift (depletion) relative to adjacent temperatures.
Upon cooling to 325 K, the electron density distribution at the Pr layers peaks, coinciding with the maximum rate of change in lattice constants, as shown in Figure 4C. At this temperature, the electron density distributions for both Ge and Mn layers remain significantly lower. Analysis of electron density distributions across distinct atomic planes at 317 K reveals that during the magnetic transition, Mn and Pr atoms undergo electron depletion, with the liberated electrons redistributing toward Ge sites. This charge transfer likely contributes to the enhanced magnetization observed at 320 K compared to 310 K over the
To investigate the electron migration mechanisms during phase transition processes in depth, we performed differential calculations on electron density distribution maps at adjacent temperature points (defined as the electron density distributions at lower temperatures minus those at higher temperatures). The electron density distribution across distinct atomic layers exhibited congruent variation patterns during 327-335 K, 325-327 K, and 321-323 K. This coordinated behavior originates from lattice constant evolution, while interatomic electron transfers are absent throughout these processes.
Figure 6 shows the differential electron density distributions. During 323-325 K, the Pr and Ge atomic layers exhibit a marked reduction in electron density distribution, while the Mn layer demonstrates a concomitant increase. This electronic restructuring indicates electron acquisition by Mn atoms with simultaneous electron depletion from Pr and Ge atoms during this process. During 317-321 K, the electron density distribution at the Pr position on the (001) plane significantly increased, but the electron density distribution at the coordinate (0.5 0.5 0) decreased (circled in pink dashed lines in Figure 6). The reason for this decrease is not clear. At the same time, on the (0 0 0.38) plane, the differential electron density distribution of Ge atoms shows an increase in the inner layer and a decrease in the outer layer, making it difficult to intuitively judge the changes in their electronic properties. Therefore, we analyzed the changes in electron density distributions at 321 and 317 K in Figure 5, and found that the electron density distributions at the position of Ge increase, while the electron density distributions in the Mn and Pr atomic layers decrease. This charge redistribution indicates that the electrons of the Mn and Pr atoms migrate to the Ge atoms.
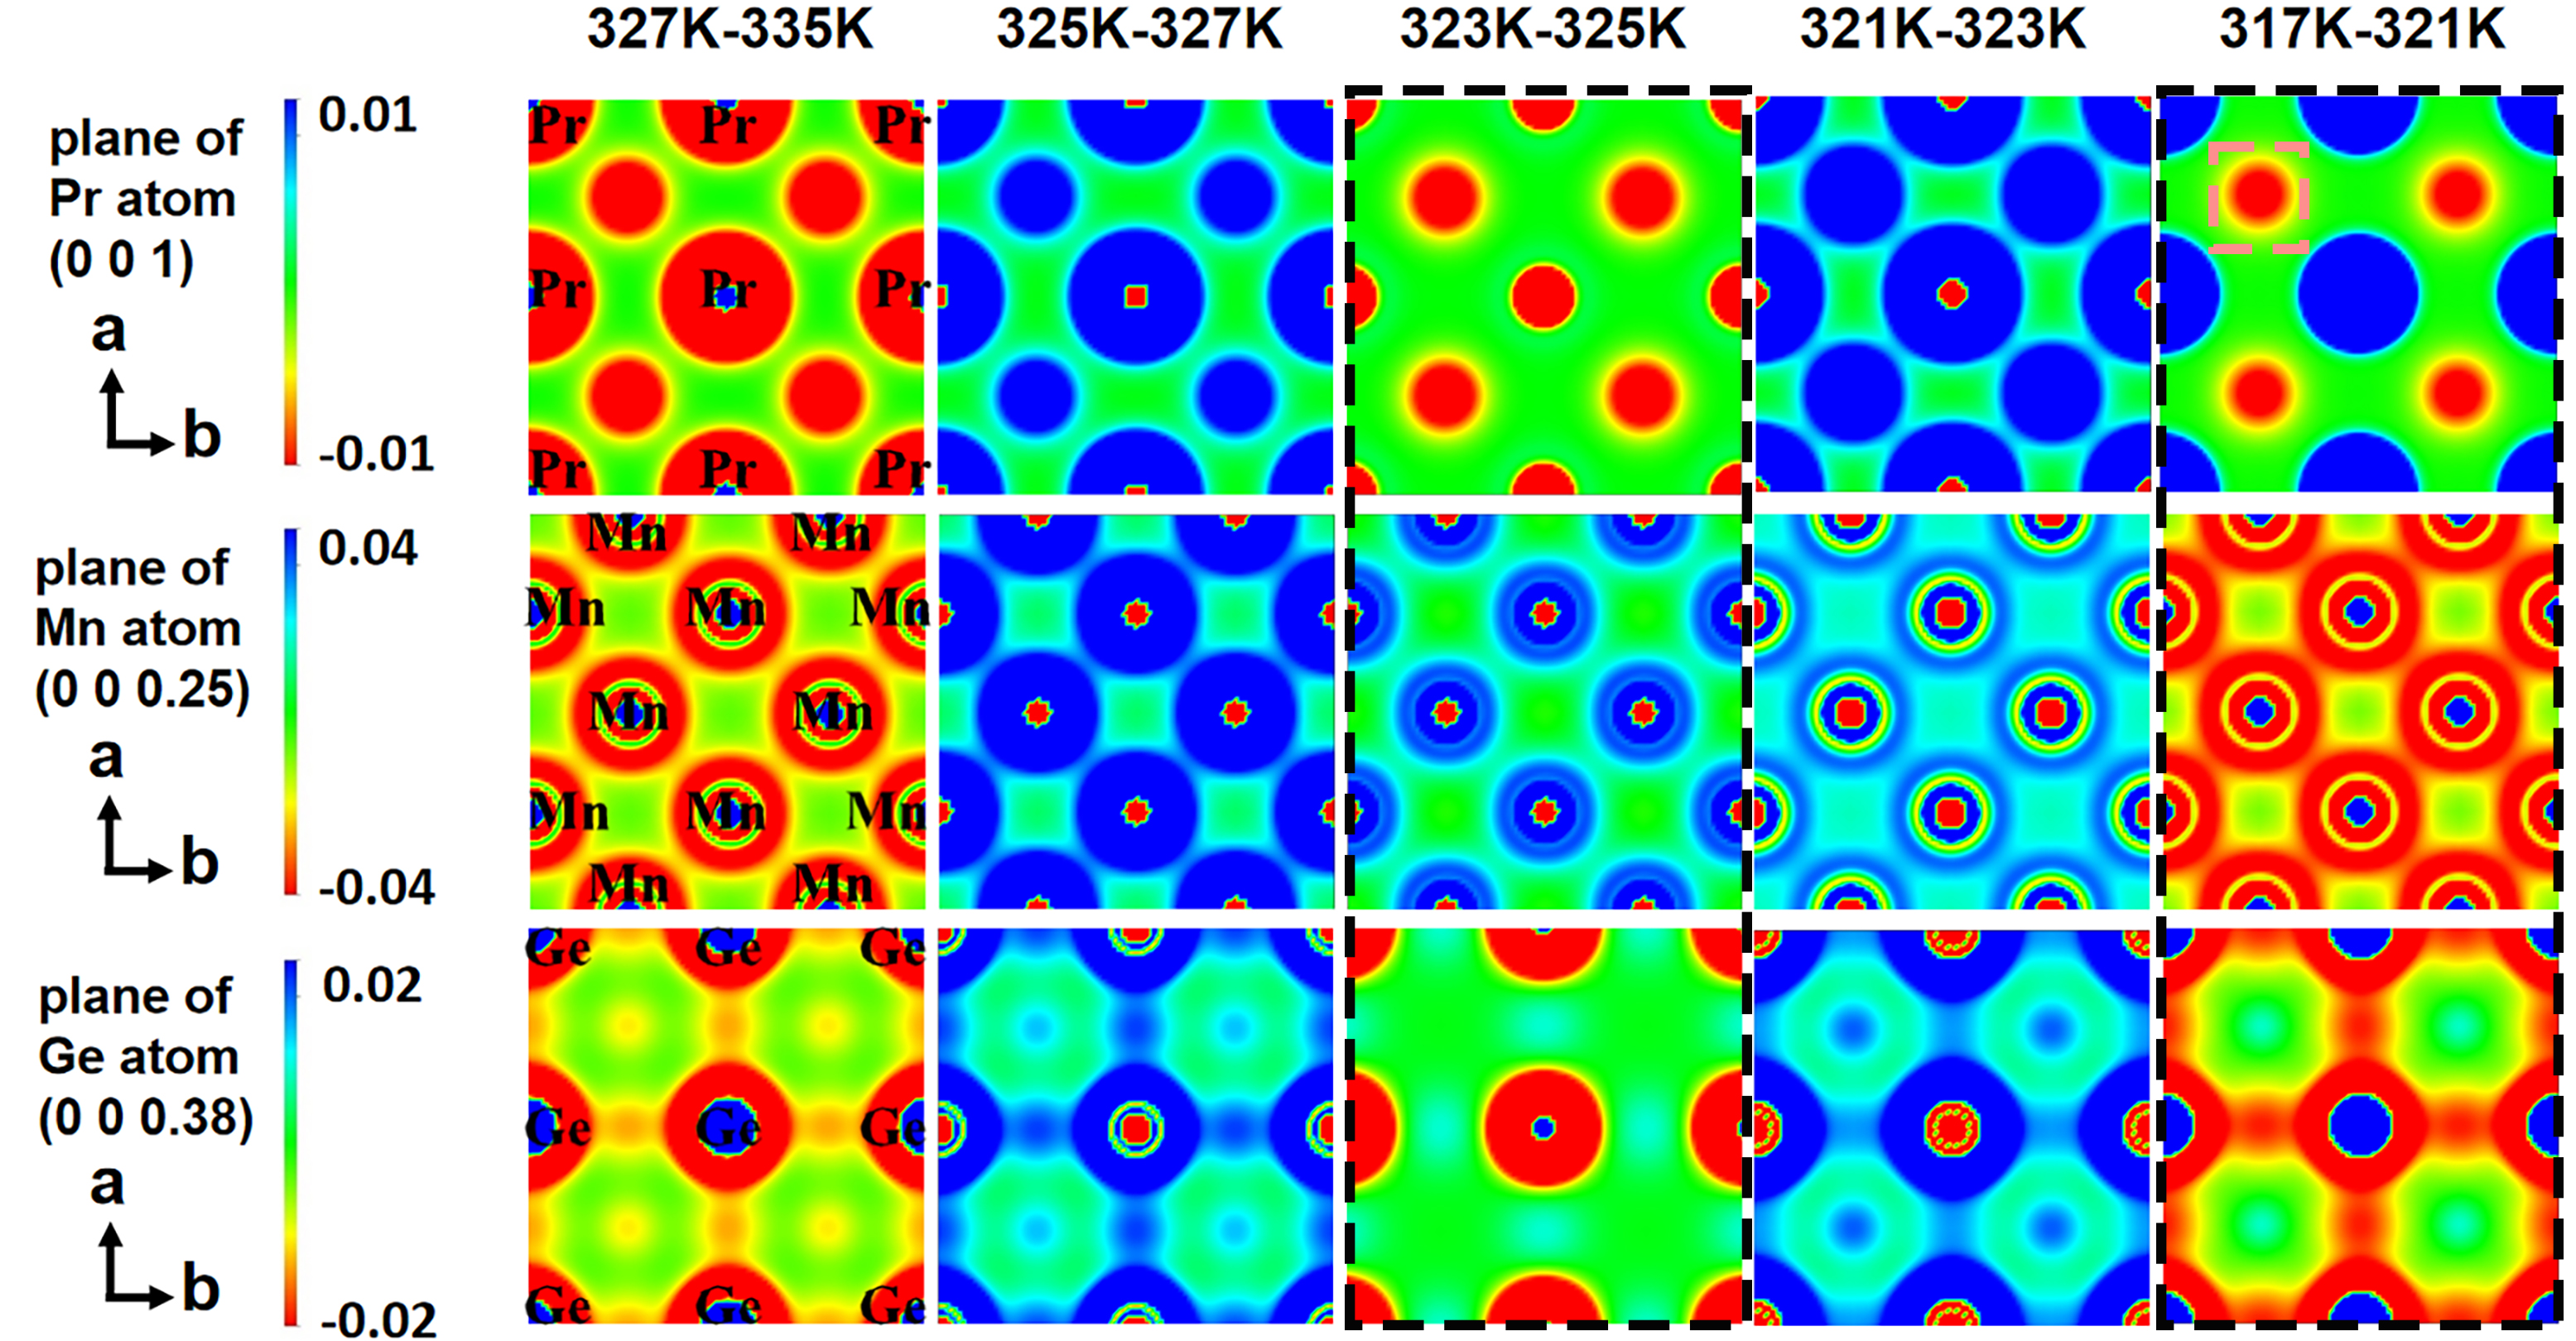
Figure 6. Temperature-dependent differential electron density mapping, (units: eÅ-3); the color scheme quantifies relative changes in electron density at (0 0 z) between reference temperature T1 (e.g., 327K) and comparison temperature T2 (e.g., 335K); regions exhibiting red hues indicate local electron depletion, signifying outward electron migration; conversely, blue regions demonstrate electron accumulation, reflecting inward electron redistribution.
In order to verify the electron migration patterns during the magnetic transition process, the electron distribution maps of planes (1 1 0) and (0.5 0 0) were extracted to analyze the electron migration between atomic layers. From the electron density distributions shown in Figures 5 and 7, it is evident that the electron distribution of Pr remains spherical throughout the magnetic transition, indicating that Pr exists in the crystal in an ionic form. The electron overlap between Ge-Ge and Mn-Ge pairs suggests the formation of covalent bonds, which is consistent with previous first-principles analyses of the bonding situation in ThCr2Si2-type structures. These covalent bonds lead to the formation of sublattices by Mn and Ge atoms.
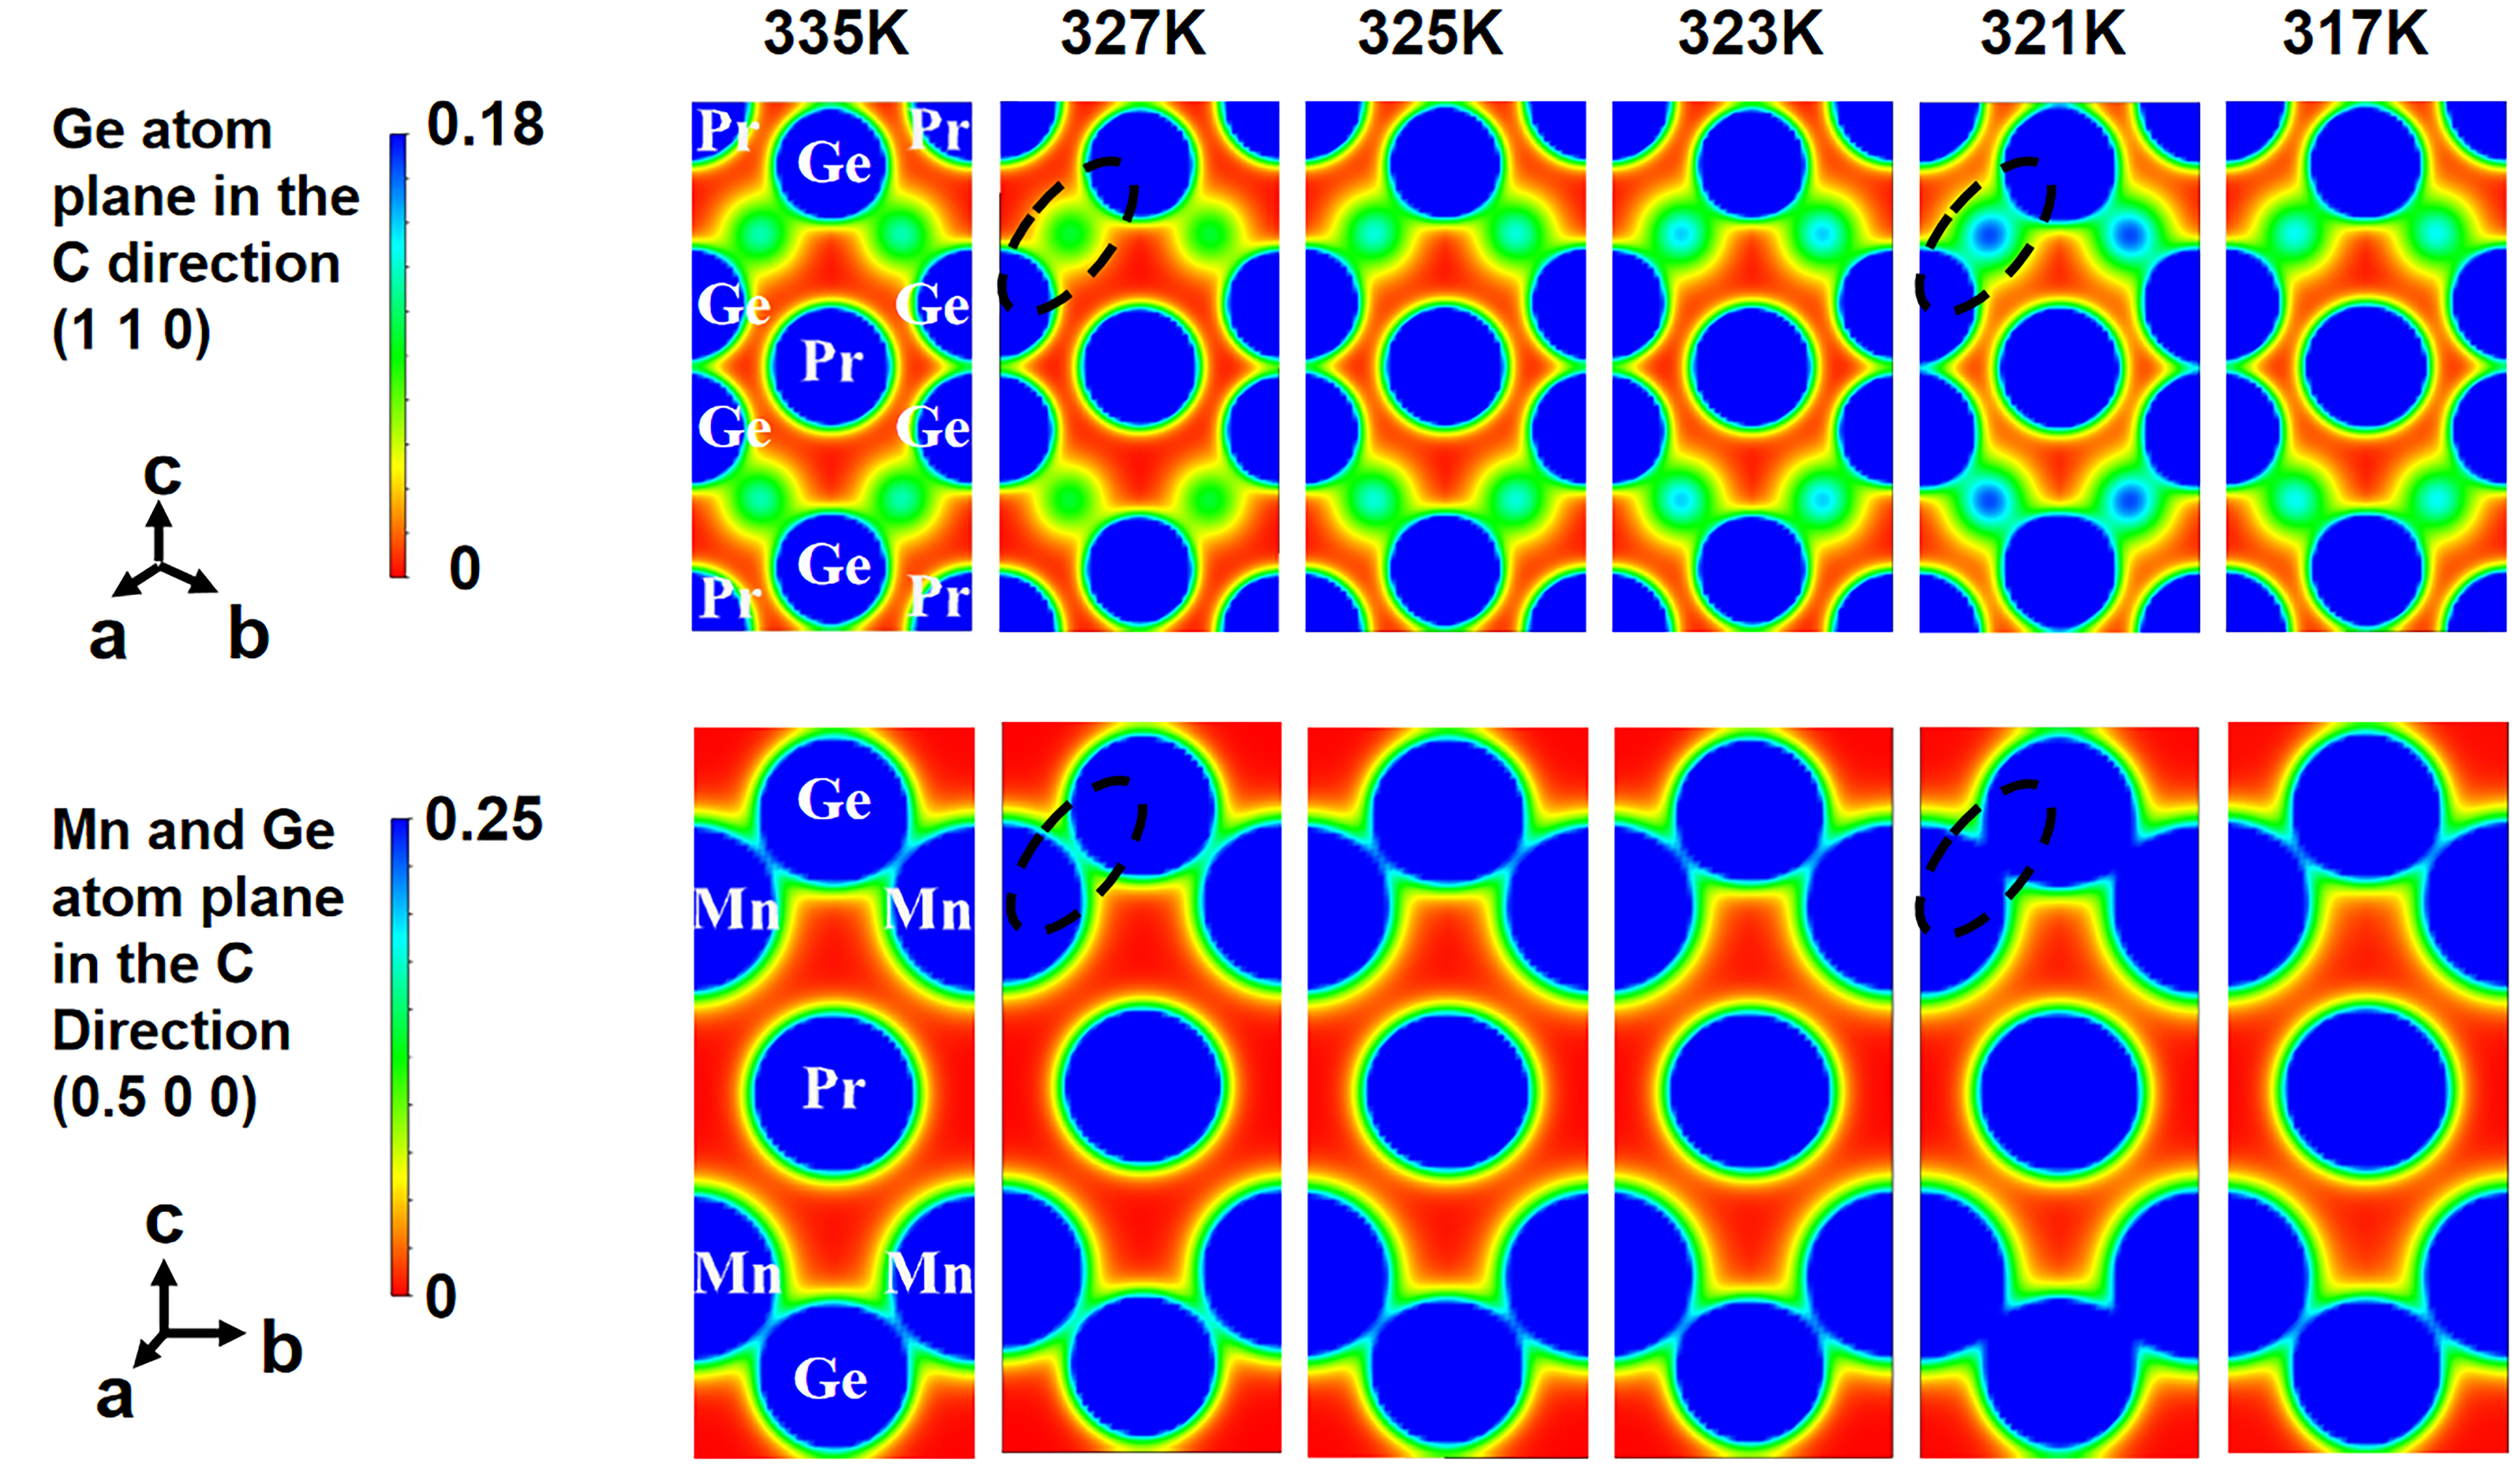
Figure 7. Electron density distributions from 335 K to 317 K (units: eÅ-3).
The interlayer electron density from 335 K to 317 K is shown in Figure 7. The changes in electron density can reflect the strength of atomic interactions. The (110) plane shows the changes in electron density between Pr atoms and interlayer Ge-Ge atoms. It can be observed that the electron density between Ge-Ge atoms first decreases and then increases with temperature changes at 327 K, and then decreases again after 321 K. The (110) plane also shows the interactions between Ge and Mn atoms.
Electron density distribution maps of the (1 1 0) and (0.5 0 0) planes were captured, and the electron migration between atomic layers was analyzed [Figure 8]. Differential electron density revealed that electron migration occurs at 323-325 K and 317-321 K, consistent with previous conclusions. During the process from 323 K to 325 K, the electron density at the Ge-Ge intermediate position increases (blue elliptical region), but the electron density at the position of the Ge atom decreases. By analyzing the atomic stacking method and the electron density distribution within the layer, it is found that the increased electron density at this position is influenced by the electron density distribution of the 4d-occupied Mn atom. The decrease in the electron density of Ge atoms and the increase in the electron density of Mn atoms on the (0.5 0 0) plane also corroborate this hypothesis. At the same time, the decrease in Pr’s electron density indicates that the electrons in this process are indeed migrating from Pr and Ge to Mn. The analysis process of 317-321 K is similar, in which electrons migrate from Mn to Pr and Ge.
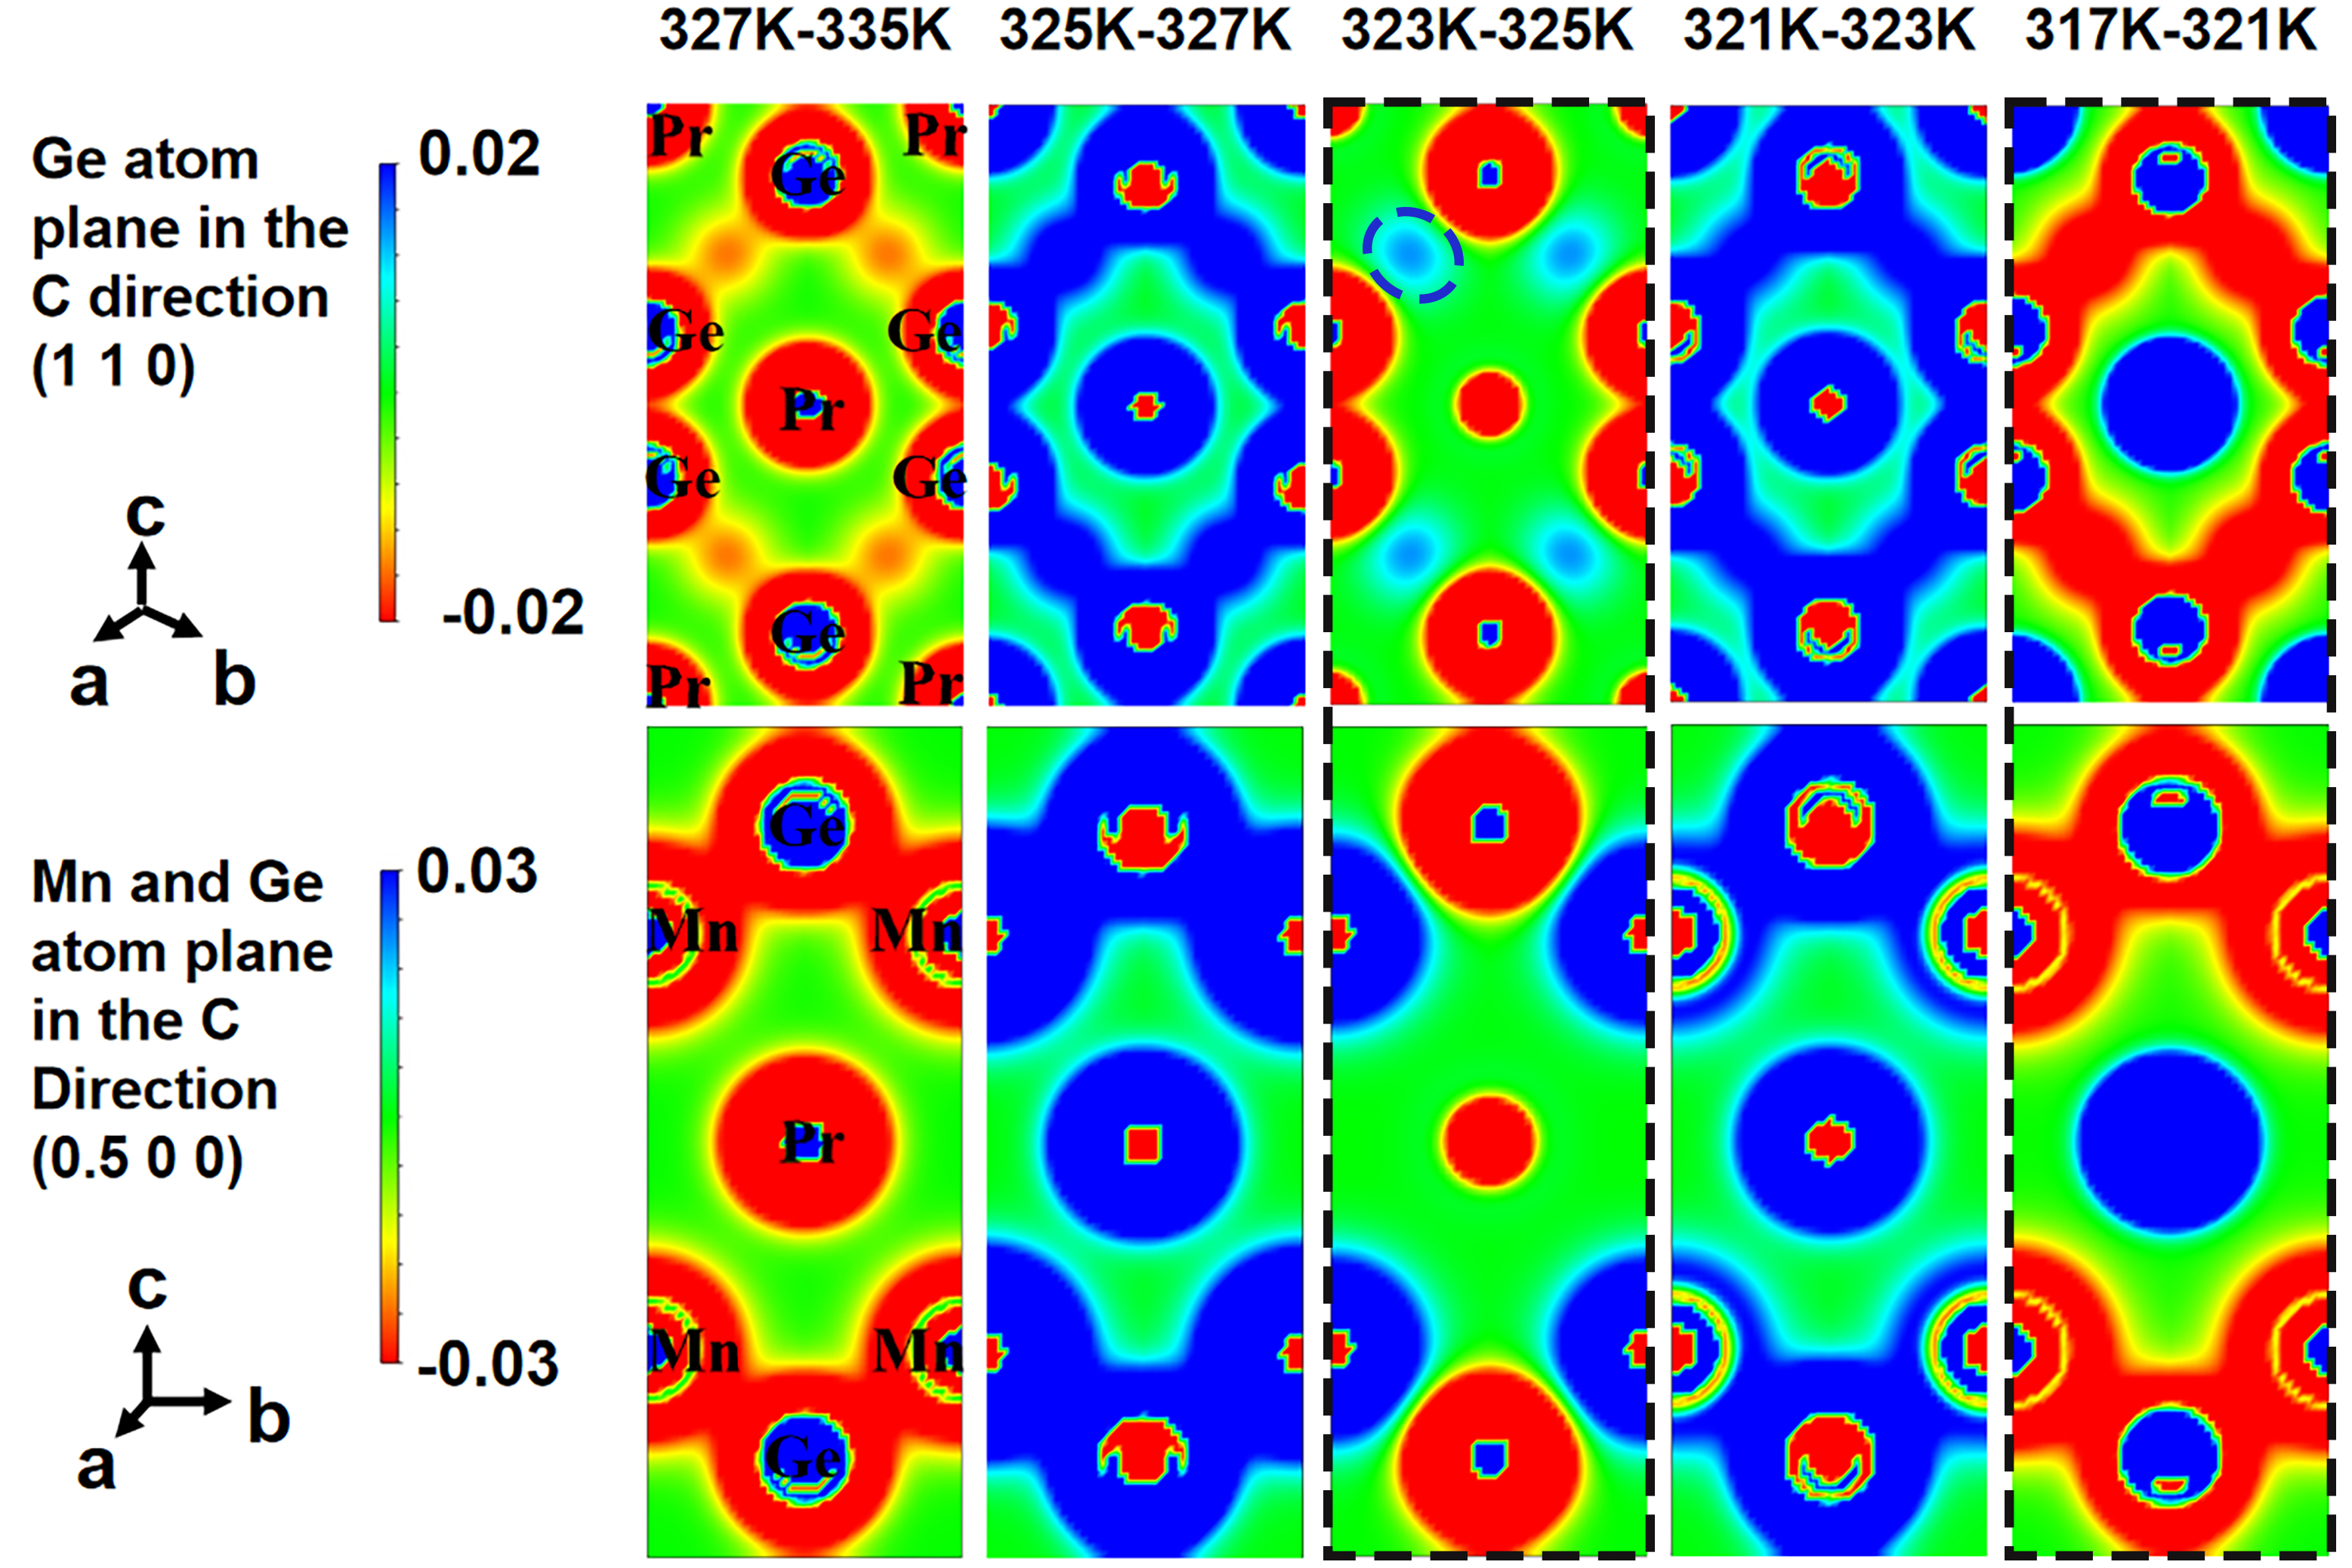
Figure 8. Differential electron density at different temperatures, the unit is eÅ-3.
The analytical results of the AFM-Fmc transition are as follows: electron migration was observed at two temperature points, 325 and 317 K. At 325 K, Mn atoms receive electrons from Pr and Ge, which is reflected in the M-H graph as the magnetic induction intensity at 320 K being higher than at 310 K under a 0-0.6 T magnetic field. When the temperature drops to 317 K, Ge atoms receive electrons from Pr and Mn. After the electron transfer is complete, THE appears at 310 K, marking a change in its macroscopic magnetic behavior.
The magnetic transition process of Fmc-Fmiab is particularly distinct. As illustrated in the M-T curve [Figure 2C], it features two notable temperature points at 287 and 284 K. As the temperature decreases to 287 K [Figure 9], the electron density within the planes of the Pr and Ge atoms decreases, whereas the electron density within the Mn atoms increases. During this interval, electrons are transferred from Pr atoms to Mn atoms, and the shared electrons between Mn and Ge also shift toward Mn. The substantial influx of electrons to Ge leads to an increase in the total electron count within the Mn-Ge structure. With electron transfer, the M-T curve also changes [Figure 2C]. When the temperature decreases to 284 K, the electron density within the planes of the Pr and Mn atoms decreases, while that of the Ge atoms increases. This indicates that electrons are transferred from Pr and Mn atoms to Ge. Concurrently, significant lattice expansion is observed [Figure 4A], and the rate of change in the M-T curve reaches its minimum [Figure 2C].
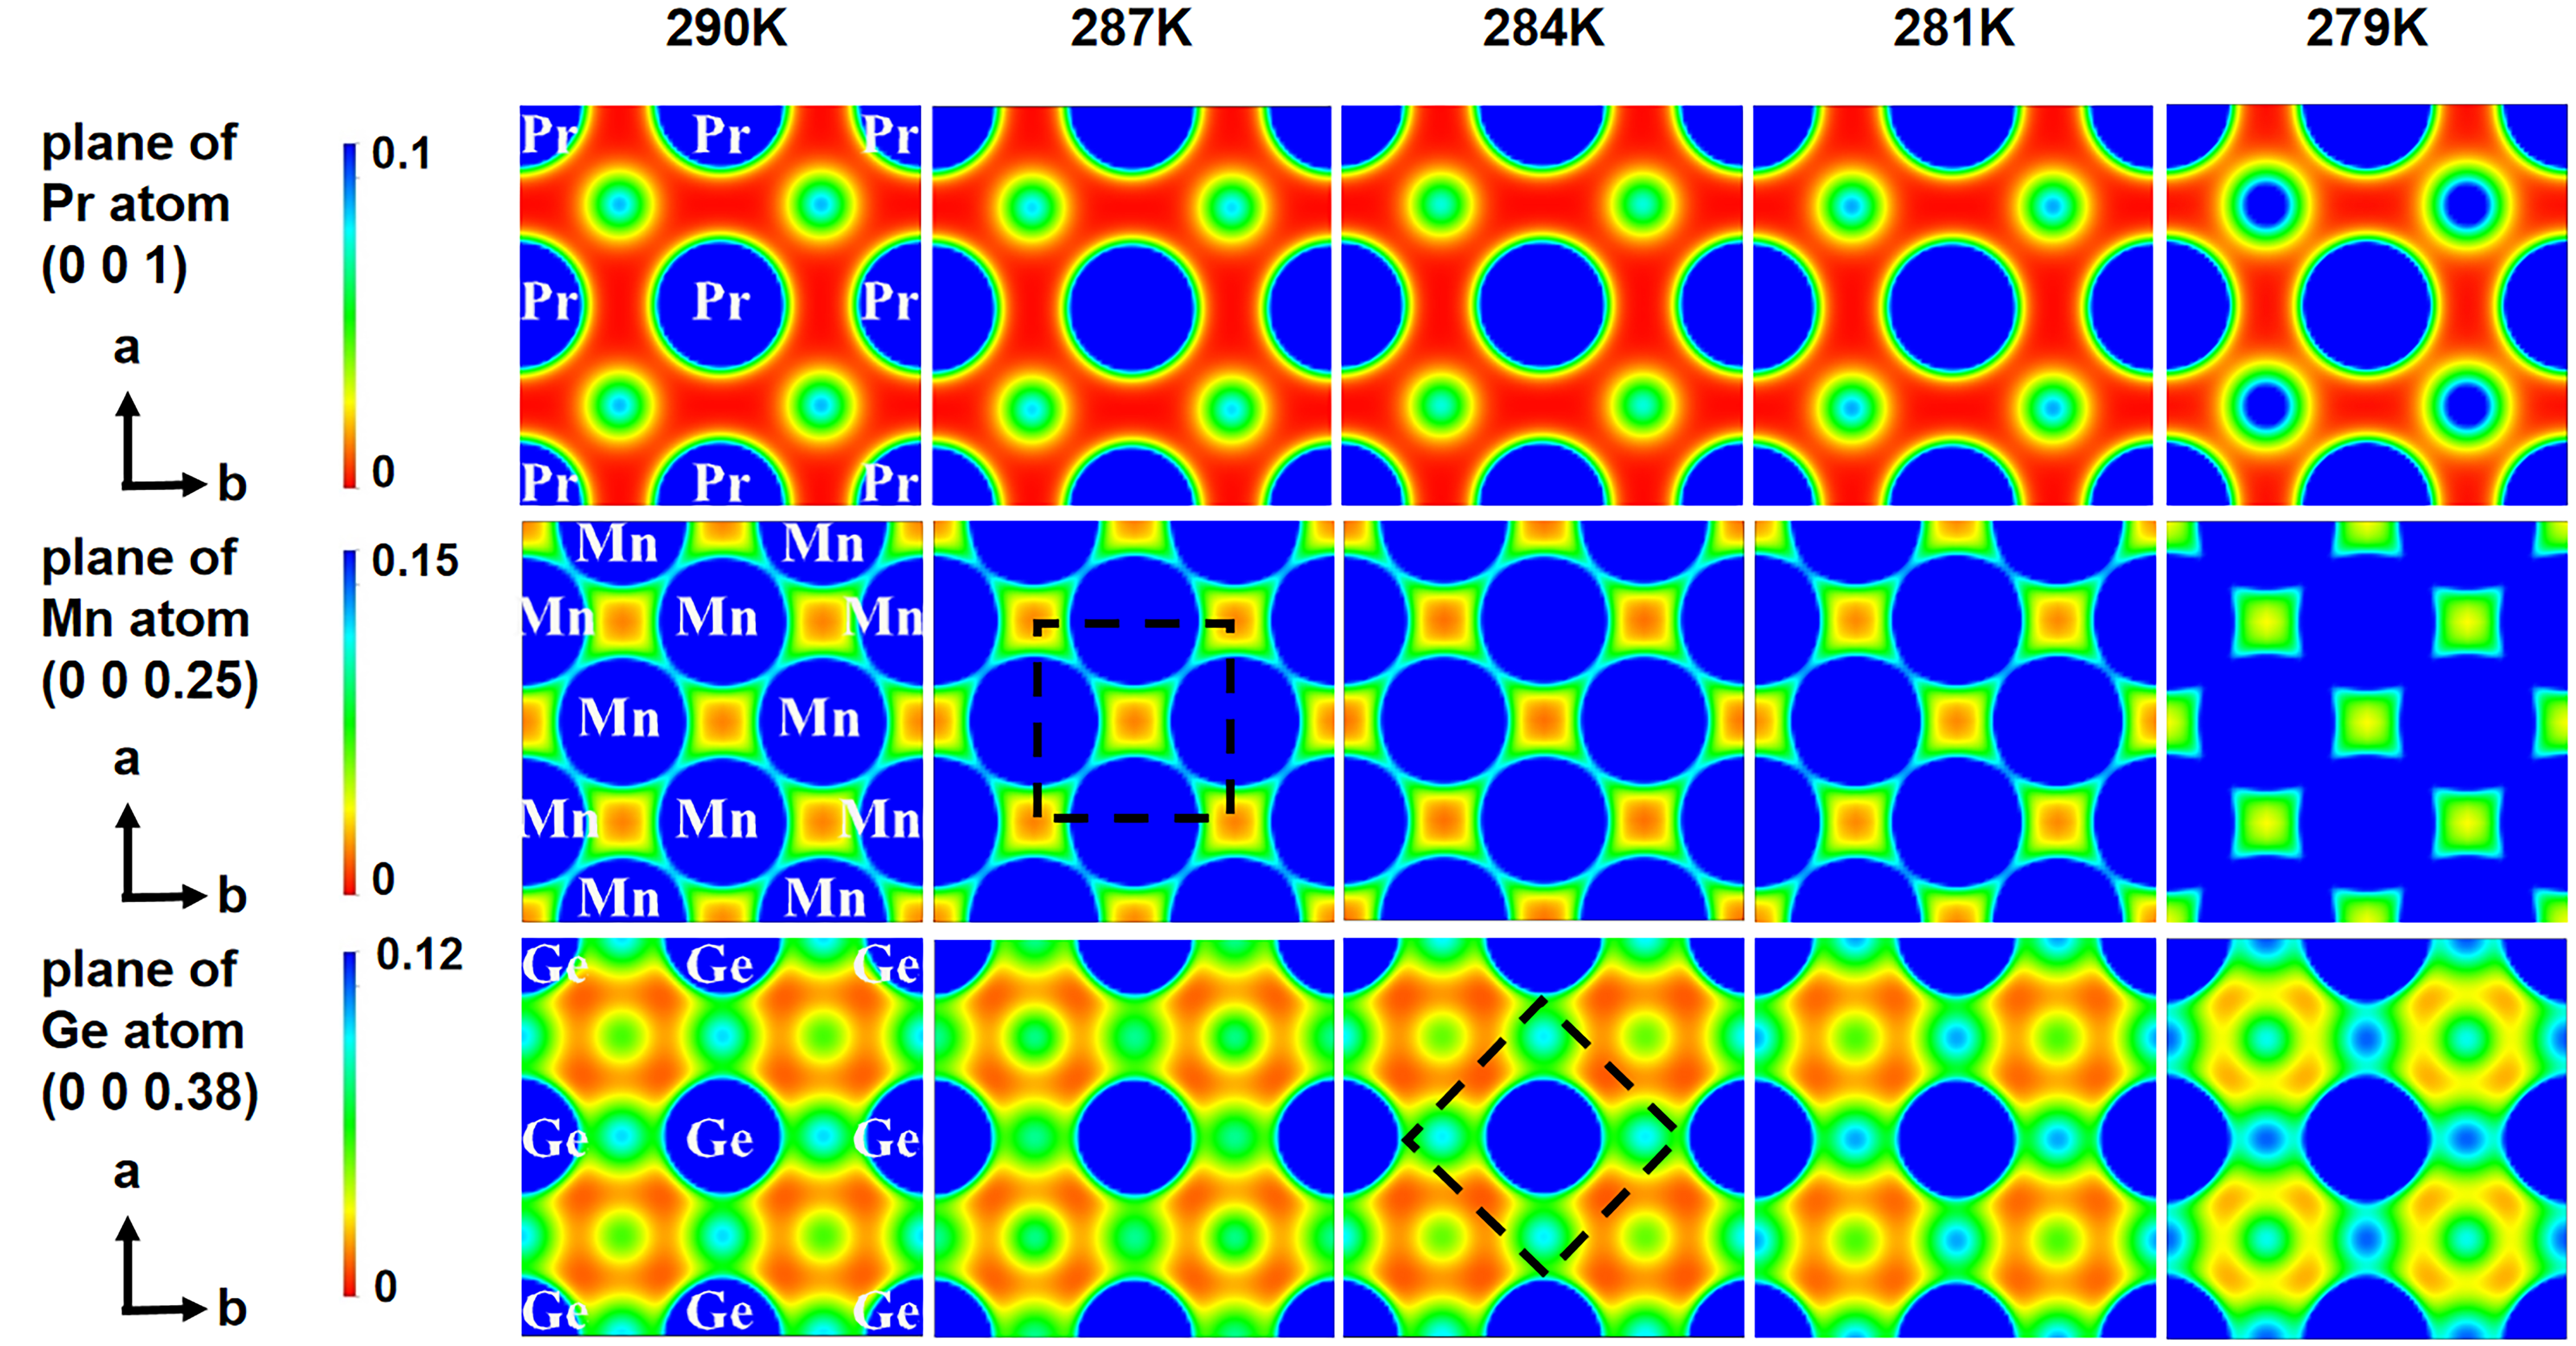
Figure 9. Electron density distributions from 290 K to 279 K, the unit is eÅ-3.
The differential electron density of this magnetic transition is shown in Figure 10. It can be inferred that at 287-290 K, the electrons of Pr and Ge atoms migrate to the Mn atom. As the temperature decreases, at
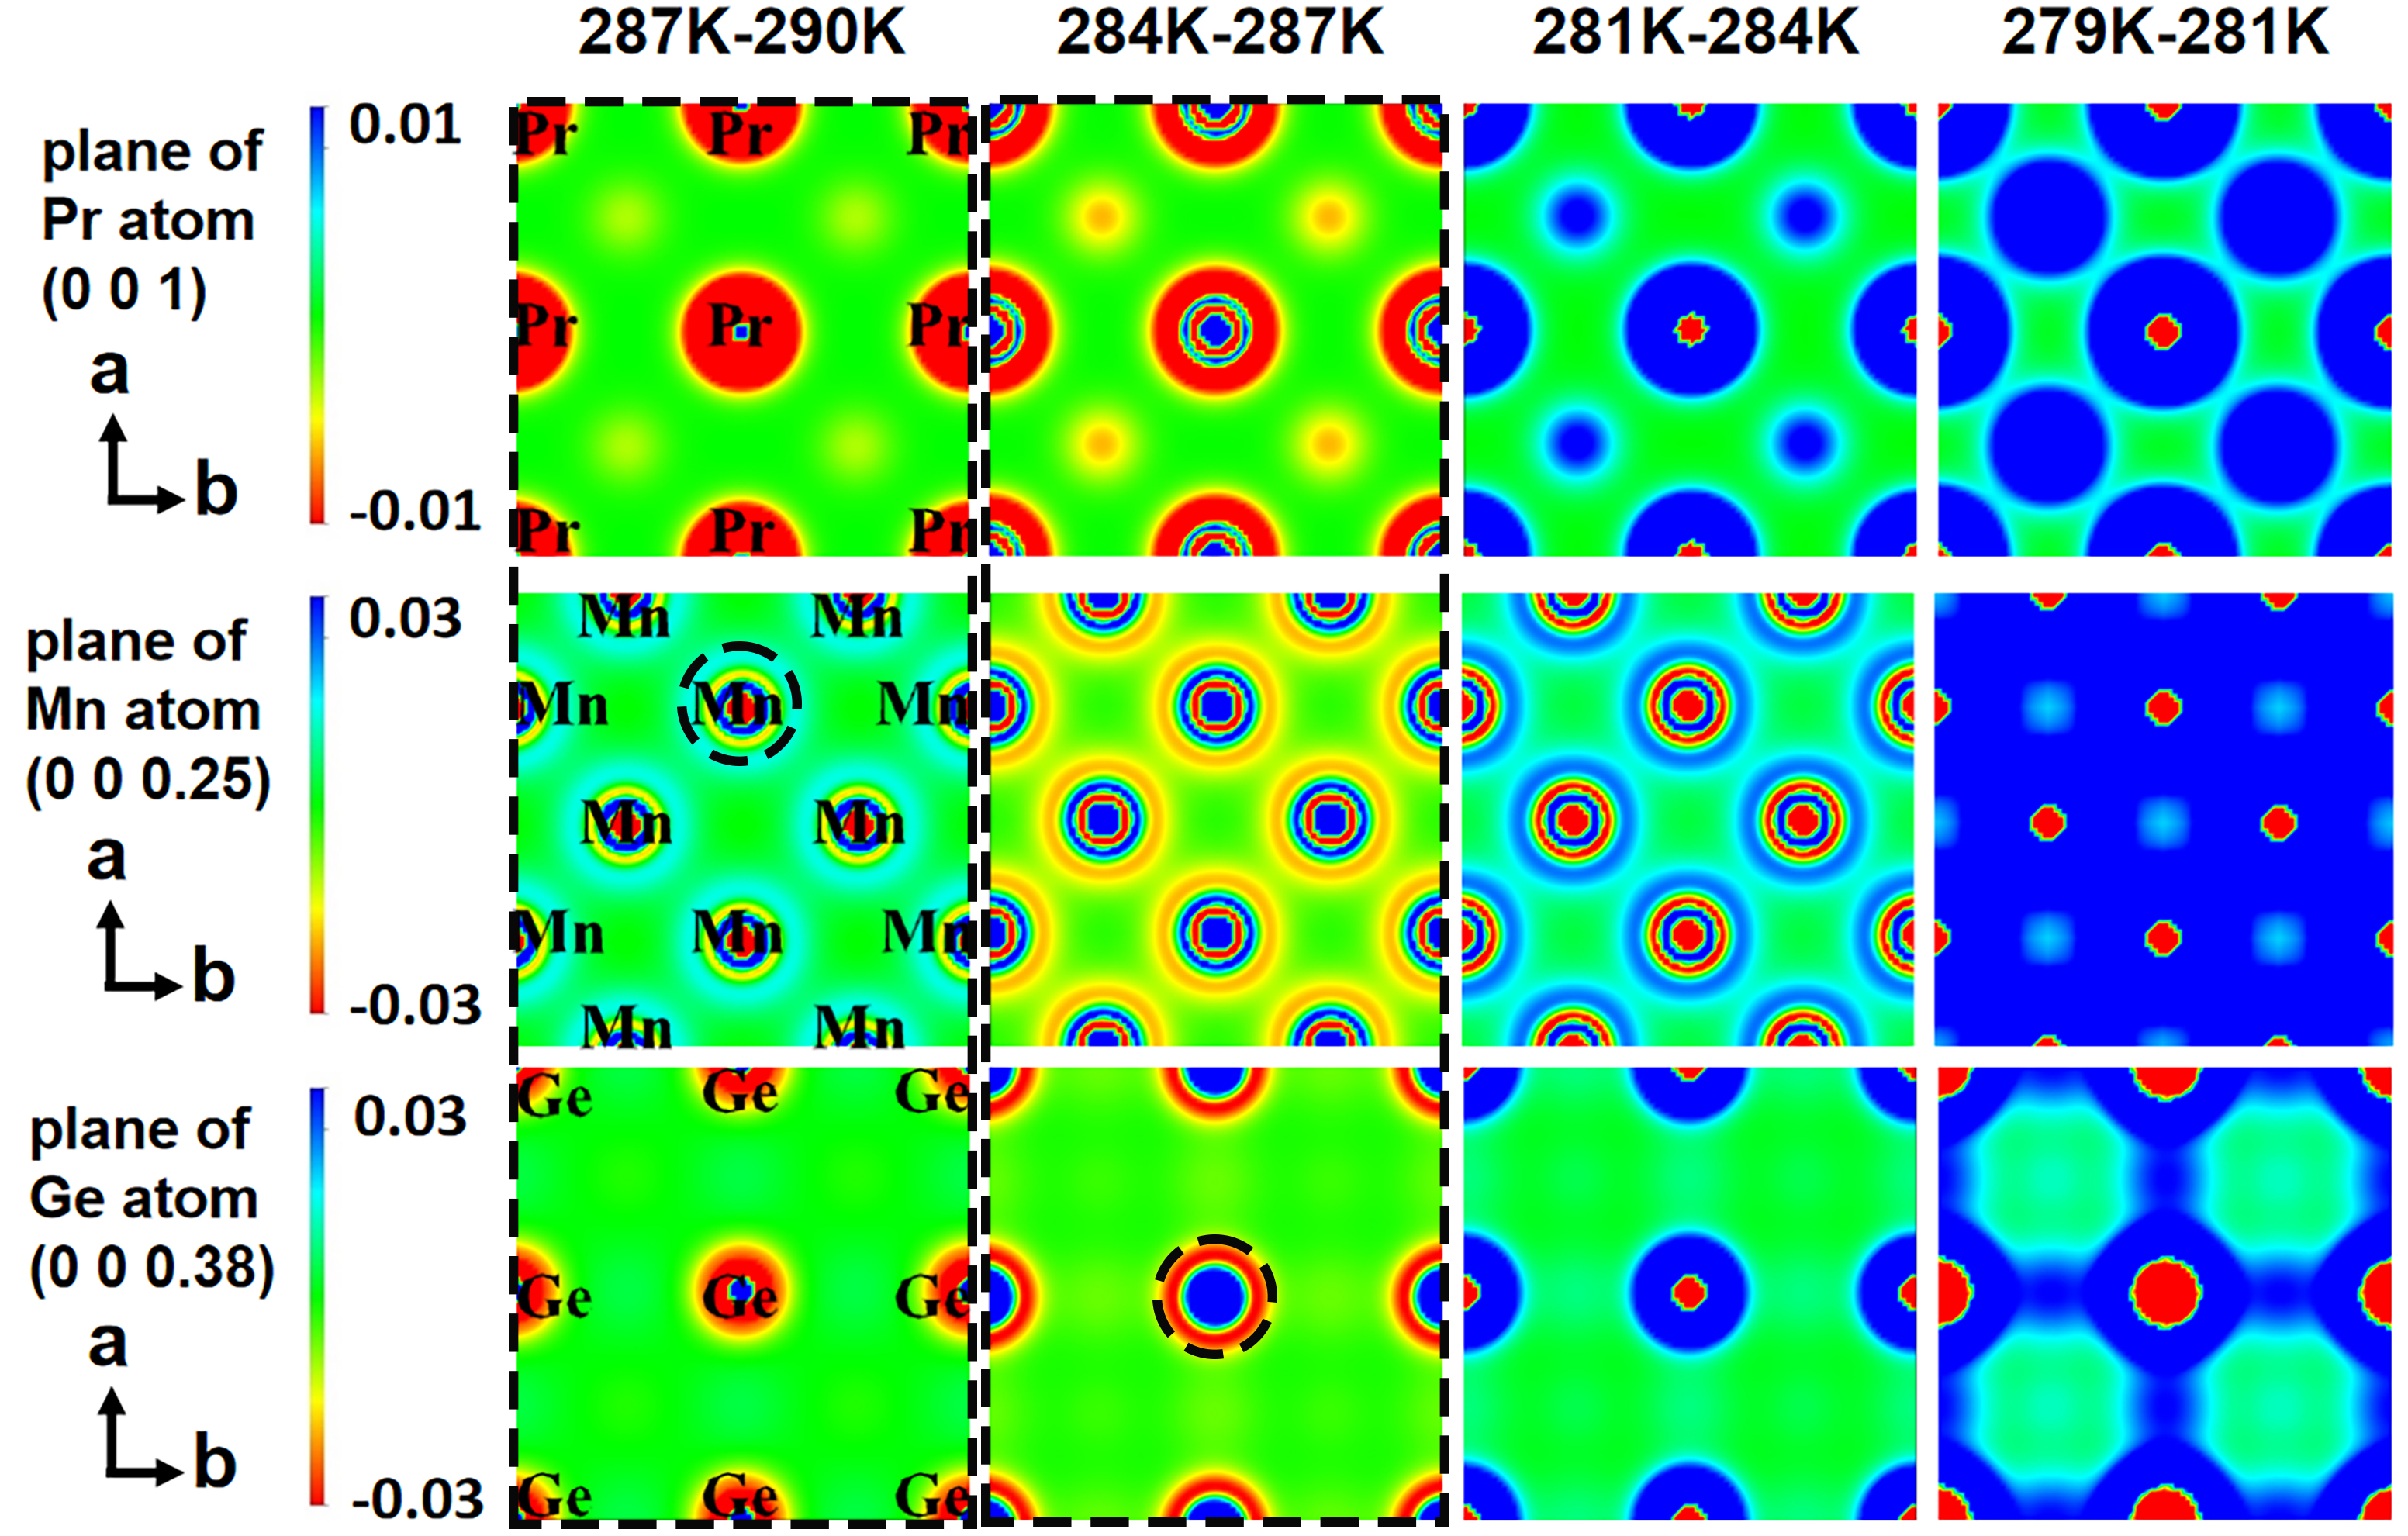
Figure 10. Differential electron density at different temperatures (units: eÅ-3).
By analyzing the interlayer electron density distribution at different temperatures [Figure 11] alongside the interlayer electron density difference maps at adjacent temperatures [Figure 12], the aforementioned electron motion can be verified. At 287 K, an increase in electron density is observed between the interlayer Ge atoms [Figure 11]. Additionally, the (110) plane shows a gradual decrease in electron density at the positions of the Ge atoms between 287 and 290 K [Figure 12]. This increase is also caused by the Mn atoms on the (0.5 0 0) plane, which exhibit an increase in electron density. At 284 K, the electron density between Ge atoms decreases [Figure 11]. Combining this with the differential map from 284 K to 287 K, it is evident that the electron density at the Ge atom positions increases [Figure 12], while that of the Pr and Mn atoms decreases. This is characterized by Ge atoms gaining electrons while Pr and Mn atoms lose electrons.
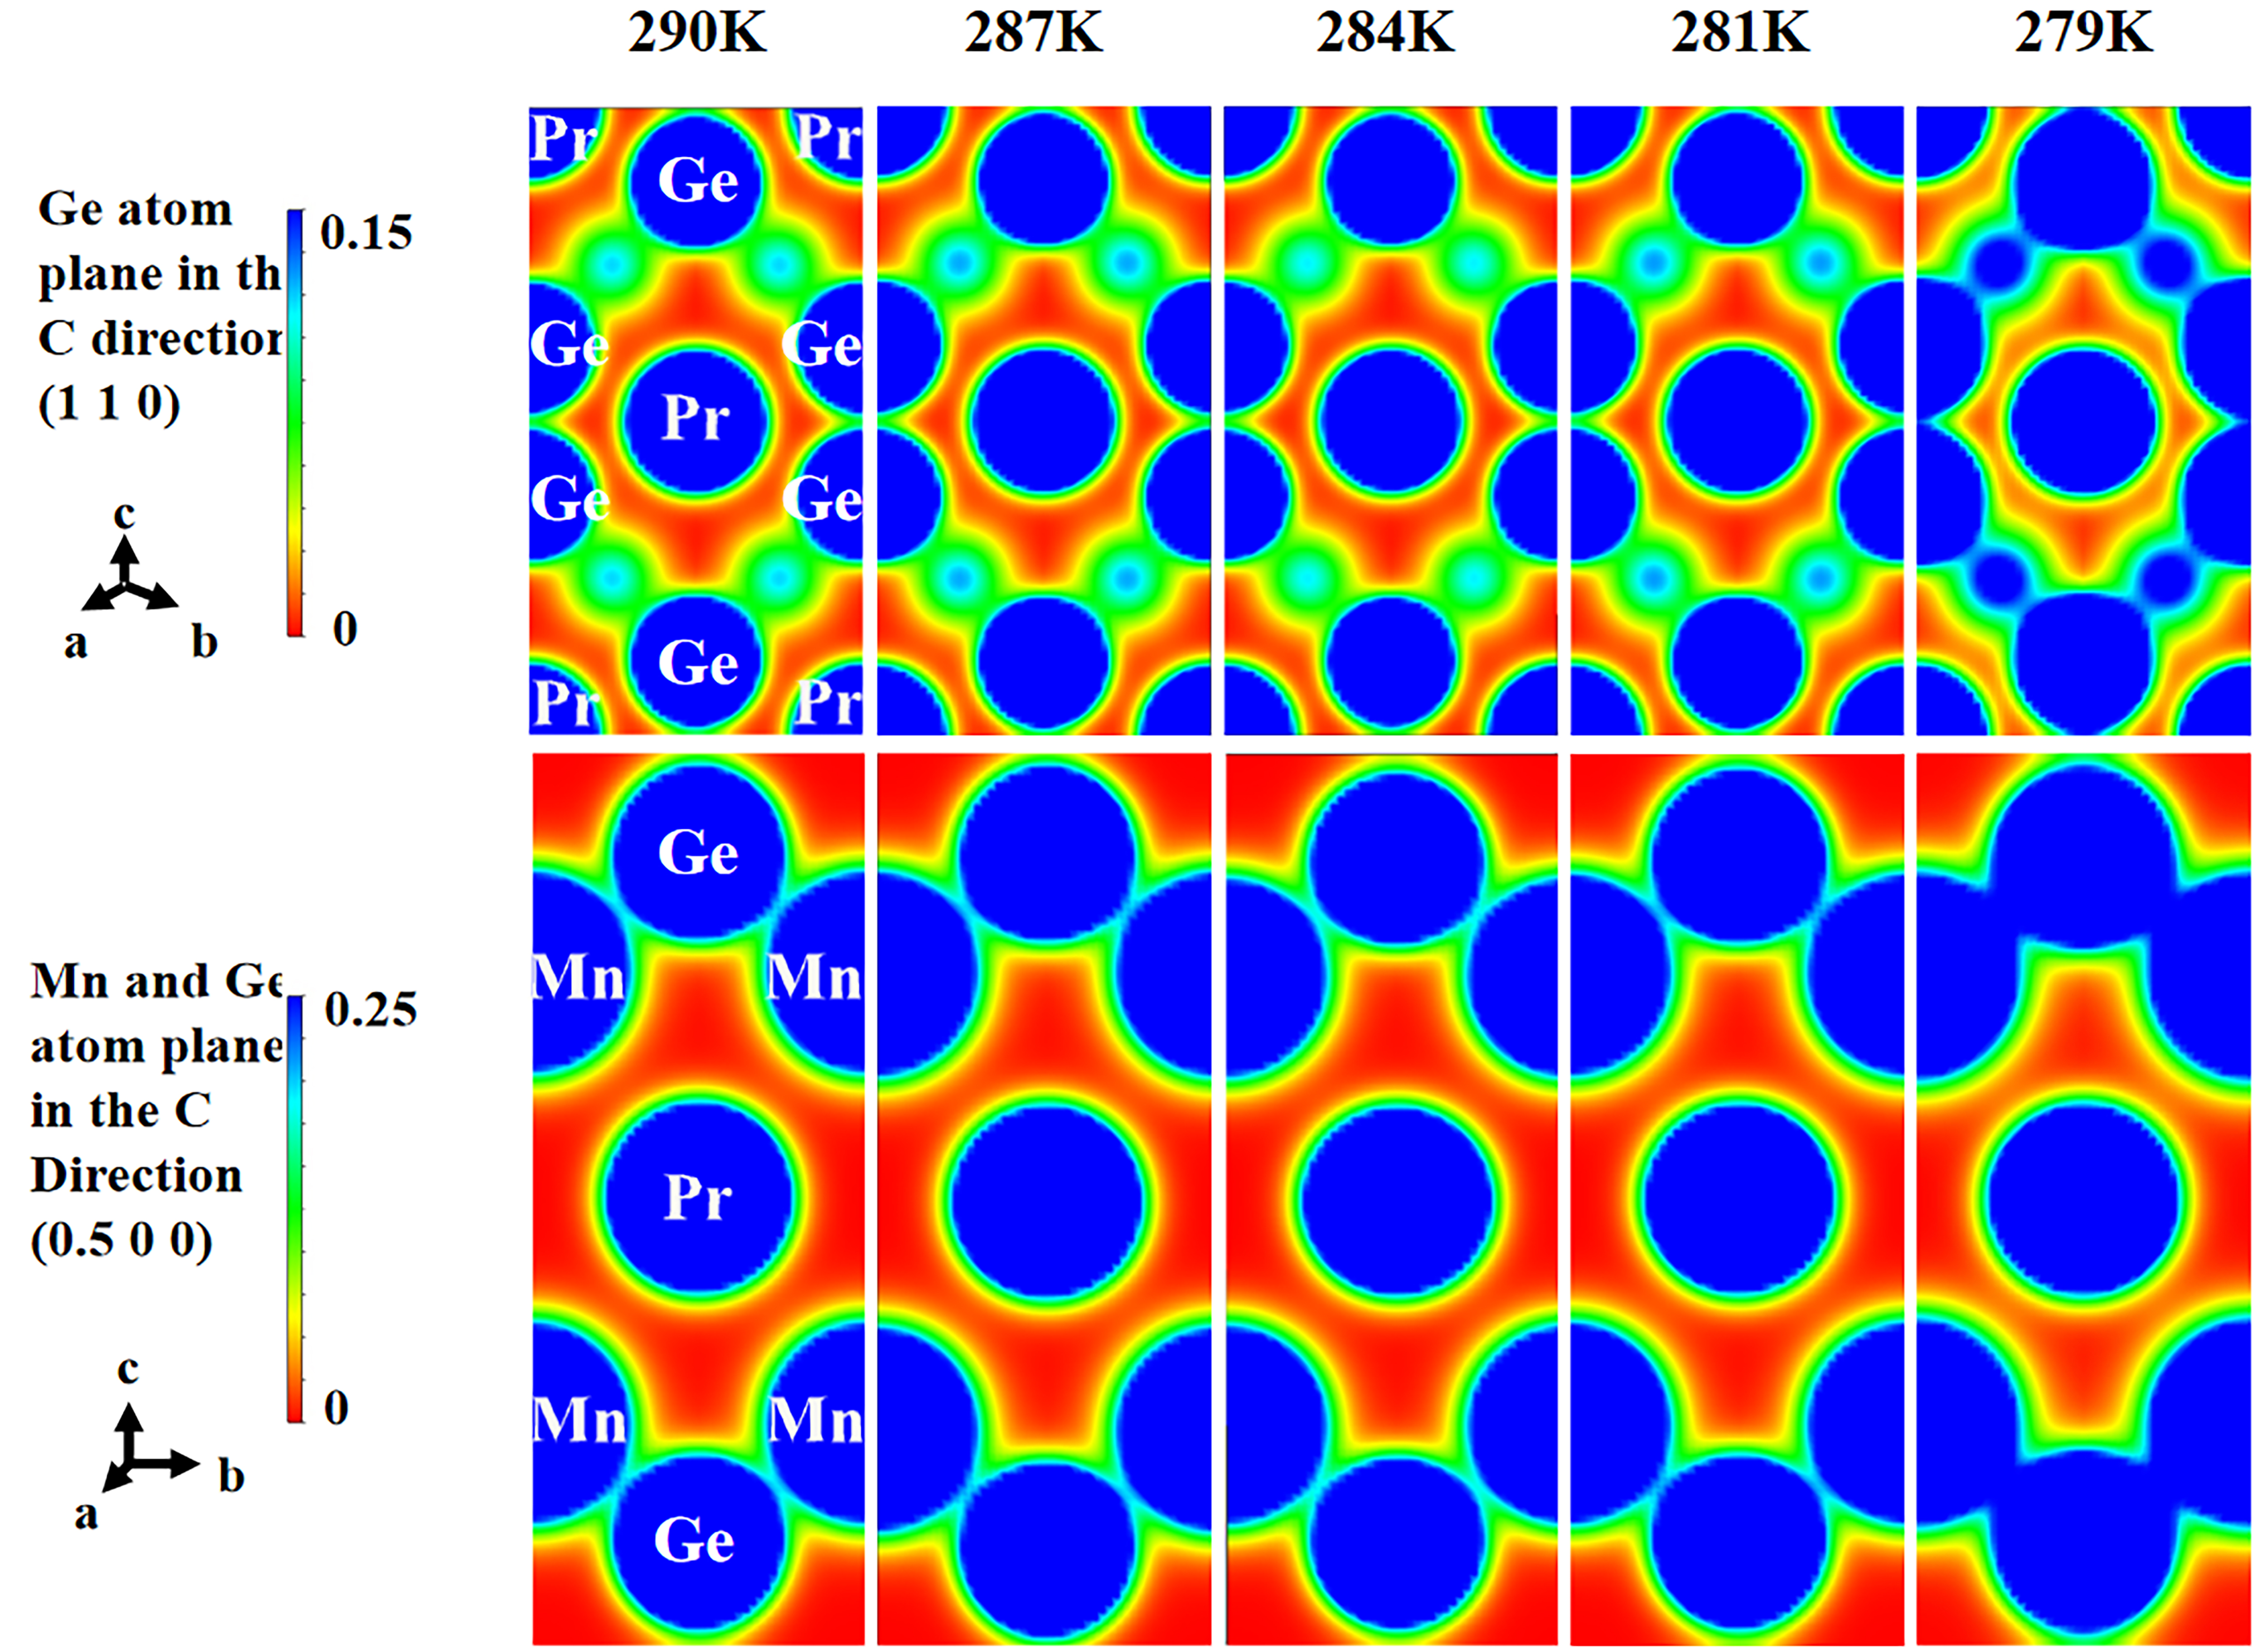
Figure 11. Electron density distributions from 290 K to 279 K (units: eÅ-3).
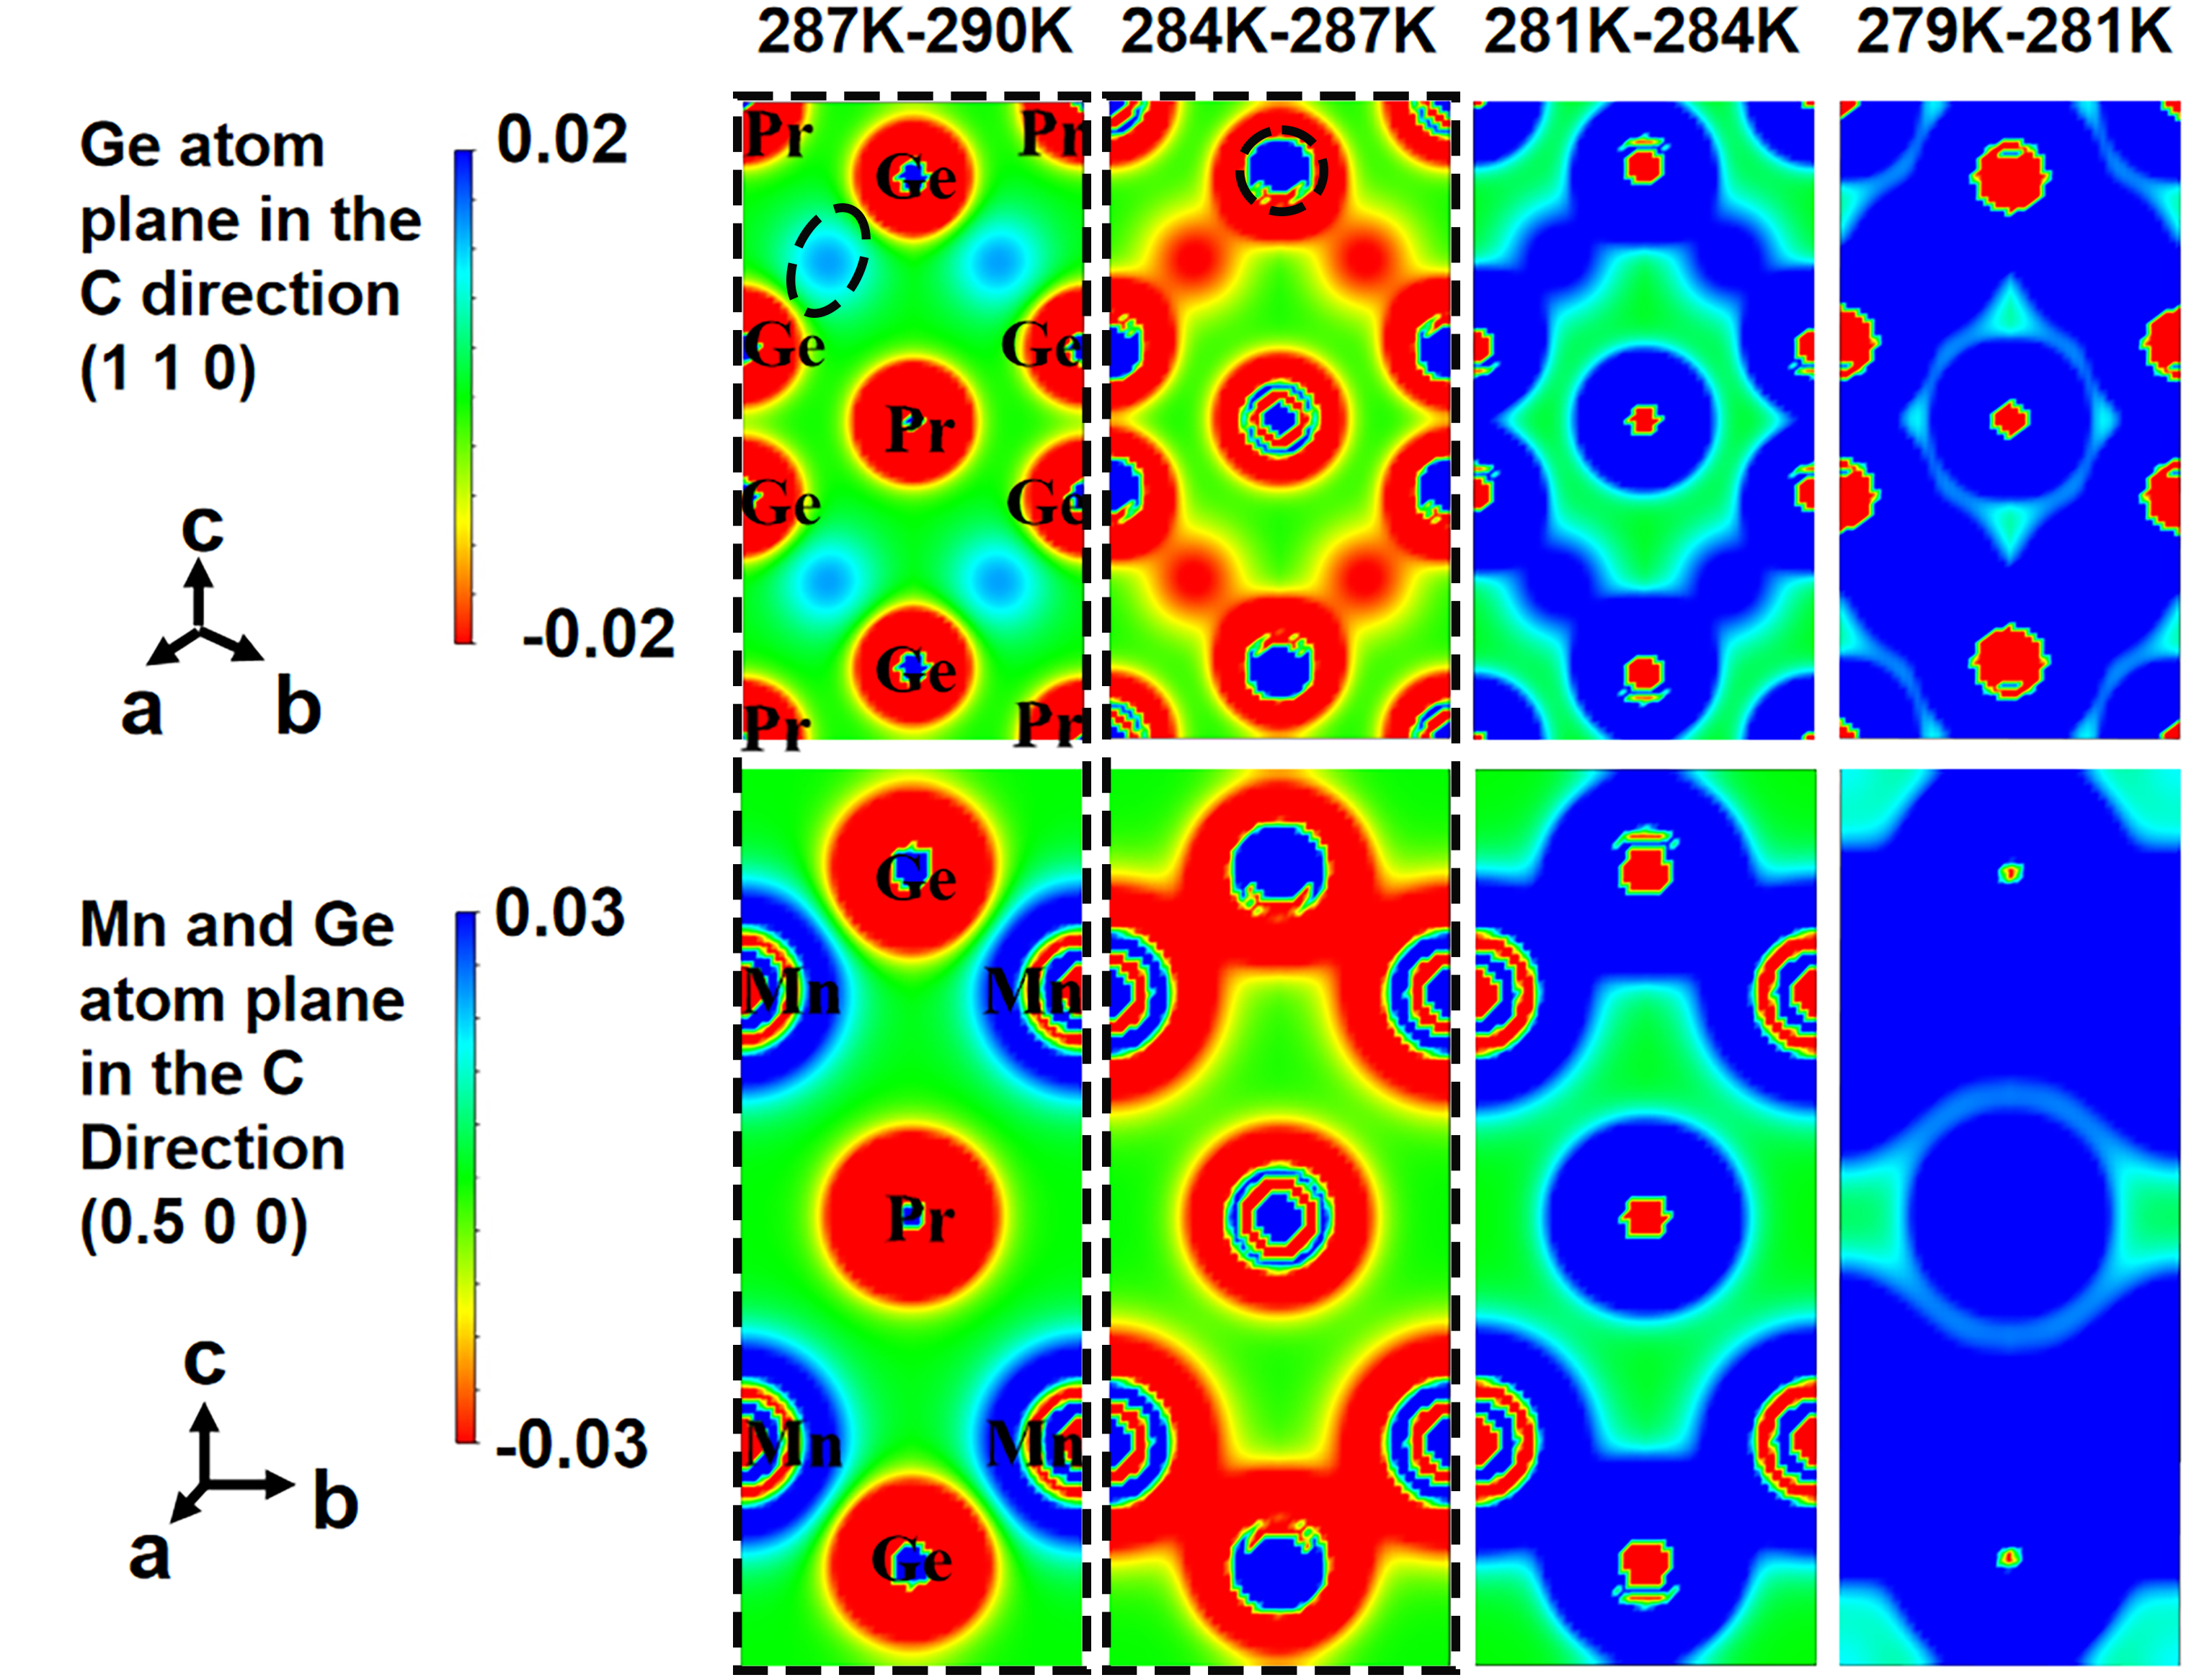
Figure 12. Electron density distributions from 290 K to 281 K, the unit is eÅ-3.
During the Fmc-Fmiab process, the dm/dt curve exhibits abrupt changes at 287 and 284 K, corresponding to different electron migrations. When the temperature decreases from 290 K to 287 K, Mn atoms receive electrons from Pr and Ge atoms, and when the temperature decreases from 287 K to 284 K, electrons migrate from Pr and Mn atoms to Ge. After the process ends, the intensity of THE decreases.
CONCLUSIONS
This study reveals the profound coupling mechanism among magnetic ordering, lattice degrees of freedom, and electronic reconstruction in PrMn2Ge2, establishing a physical picture of “electron-migration-driven magnetostructural phase transitions”. The electron density distributions elucidated by the maximum entropy method provide direct visualization demonstrating that during the AFM → Fmc and Fmc → Fmiab magnetic phase transitions, electrons do not passively respond to magnetic changes but instead actively redistribute among Pr, Mn, and Ge atoms, serving as the precursor event that triggers the phase transitions. Furthermore, the emergence and disappearance of the topological Hall effect during this process strictly correspond to the completion of specific directional electron transfer events (at 317 K and 284 K), indicating that the real-space topological structure of Berry curvature can be manipulated by atomic-scale charge redistribution.
Lattice contraction acts by modifying the dynamic displacement of Ge atoms along the Pr-Mn axis, thereby providing a structural channel for electron migration; upon completion of electron transfer, it subsequently stabilizes the new lattice parameters and magnetic structure. This bidirectional feedback mechanism explains the fundamental reason for the narrow phase transition temperature window, pronounced thermal hysteresis, and superior thermal stability of the topological Hall effect in PrMn2Ge2 compared to analogous compounds - the efficiency of charge transfer between rare-earth and transition-metal elements governs the tunability of magnetic functionality.
DECLARATIONS
Authors’ contributions
Synthesized the PrMn2Ge2 materials: Wang, M.; He, L.
Characterized the PrMn2Ge2 materials: Wang, M.; He, L.; Ma, L.
Provided useful suggestions: Liu, D.; Wang, S.; Liu, C.
Wrote the manuscript: Wang, M.; Liu, D.; Wang, C.
Availability of data and materials
The raw data supporting the findings of this study are available within this Article and its Supplementary Materials. Further data are available from the corresponding author upon reasonable request.
AI and AI-assisted tools statement
Not applicable.
Financial support and sponsorship
This work at Beijing University of Technology was supported by the National Natural Science Foundation of China (NSFC 52471250).
Conflicts of interest
Liu, D. is an Editorial Board member of the journal Microstructures. Liu, D. was not involved in any steps of editorial processing, notably including reviewer selection, manuscript handling, or decision making. The other authors declared that there are no conflicts of interest.
Ethical approval and consent to participate
Not applicable.
Consent for publication
Not applicable.
Copyright
© The Author(s) 2026.
Supplementary Materials
REFERENCES
1. Pielichowska, K.; Pielichowski, K. Phase change materials for thermal energy storage. Prog. Mater. Sci. 2014, 65, 67-123.
2. Wuttig, M.; Yamada, N. Phase-change materials for rewriteable data storage. Nat. Mater. 2007, 6, 824-32.
3. Jr. K, Pecharsky V, Pecharsky A, Zimm C. Recent developments in magnetic refrigeration. Mater. Sci. Forum. 1999, 315-317, 69-76.
4. Franco, V.; Blázquez, J.; Ipus, J.; Law, J.; Moreno-ramírez, L.; Conde, A. Magnetocaloric effect: from materials research to refrigeration devices. Prog. Mater. Sci. 2018, 93, 112-232.
5. Franco, V.; Blazquez, J. S.; Ingale, B.; Conde, A. ChemInform abstract: the magnetocaloric effect and magnetic refrigeration near room temperature: materials and models. ChemInform 2013, 44, chin.201324197.
6. Sun, Y.; Cao, Y.; Ren, Y.; et al. Structure, magnetism and low thermal expansion in Tb1-xErxCo2Mny intermetallic compounds. Microstructures 2023, 3, 2023028.
7. Zhao, X.; Zhang, K.; Qi, J.; et al. Low-pressure-driven barocaloric effects at colinear-to-triangular antiferromagnetic transitions in Mn3-xPt1+x. Microstructures 2023, 3, 2023022.
8. Napoli S, Llois AM, Bihlmayer G, Blügel S. Magnetic order in RMn2Ge2(R=Y,Ca) compounds and their solid solutions with LaMn2Ge2. Phys. Rev. B. 2007, 75, 104406.
9. Wang, S.; Ma, L.; He, L.; et al. Research on the structural and magnetic phase transitions of CeMn2Ge2 Alloy. Inorg. Chem. 2024, 63, 24834-43.
10. Md, Din. M. F.; Wang, J. L.; Cheng, Z. X.; et al. Tuneable magnetic phase transitions in layered CeMn2Ge2-xSix compounds. Sci. Rep. 2015, 5, 11288.
11. Welter, R.; Venturini, G.; Ressouche, E.; Malaman, B. Neutron diffraction study of CeMn2Ge2, PrMn2Ge2 and NdMn2Ge2: evidence of dominant antiferromagnetic components within the (001) Mn planes in ferromagnetic ThCr2Si2-type manganese ternary compounds. J. Alloys. Compd. 1995, 218, 204-15.
12. Wang, S.; Zeng, Q.; Liu, D.; et al. Giant topological Hall effect and superstable spontaneous skyrmions below 330 K in a centrosymmetric complex noncollinear ferromagnet NdMn2Ge2. ACS. Appl. Mater. Interfaces. 2020, 12, 24125-32.
13. Kılıç, A.; Kervan, S.; Özcan, Ş.; Gencer, A. Magnetic properties of Pr1-xGdxMn2Ge2 compounds. J. Alloys. Compd. 2004, 370, 47-52.
14. Kennedy, S.; Wang, J.; Campbell, S.; Hofmann, M.; Dou, S. Pressure induced magneto-structural phase transitions in layered RMn2X2 compounds (invited). J. Appl. Phys. 2014, 115, 172617.
15. Kervan, S.; Kilic, A.; Gencer, A. Magnetic characterization of intermetallic PrMn2Ge2-xSix compounds by AC susceptibility, X-ray diffraction and differential scanning calorimetry studies. J. Phys. Condens. Matter. 2004, 16, 4955-62.
16. Bosch-santos, B.; Cabrera-pasca, G. A.; Saxena, R. N.; Freitas, R. S.; Carbonari, A. W. Characterization of magnetic phase transitions in PrMn2Ge2 compound investigated by magnetization and hyperfine field measurements. AIP. Adv. 2017, 7, 056211.
17. Hou, Z.; Li, L.; Liu, C.; et al. Emergence of room temperature stable skyrmionic bubbles in the rare earth based REMn2Ge2 (RE= Ce, Pr, and Nd) magnets. Mater. Today. Phys. 2021, 17, 100341.
18. Nagaosa, N.; Tokura, Y. Topological properties and dynamics of magnetic skyrmions. Nat. Nanotechnol. 2013, 8, 899-911.
19. Li, S.; Kang, W.; Zhang, X.; et al. Magnetic skyrmions for unconventional computing. Mater. Horiz. 2021, 8, 854-68.
21. Granovsky, S.; Gaidukova, I.; Doerr, M.; Loewenhaupt, M.; Markosyan, A.; Ritter, C. The magnetic structures and the magnetic phase diagram of the TbMn2(Ge,Si)2 system. Phys. B. Condens. Matter. 2007, 391, 79-87.
22. Nowik, I.; Levi, Y.; Felner, I.; Bauminger, E. New multiple magnetic phase transitions and structures in RMn2X2, X = Si or Ge, R = rare earth. J. Magn. Magn. Mater. 1995, 147, 373-84.
23. Ye-qing, C.; Jun, L.; Jing-kui, L.; Jing-bo, L.; Guang-hui, R. Crystal structure and magnetic properties of Nd(Mn1-xFex)2Si2 compounds. Chin. Phys. B. 2009, 18, 4944-8.
24. Pandey, S.; Siruguri, V.; Rawat, R. Effect of Tb substitution in naturally layered LaMn2Si2: magnetic, magnetocaloric, magnetoresistance and neutron diffraction study. J. Phys. Condens. Matter. 2020, 32, 035807.
25. Shein, I.; Ivanovskii, A. Structural, elastic, electronic and magnetic properties of ThCr2Si2 from first-principles calculations. Solid. State. Commun. 2011, 151, 1165-8.
26. Pavithra, N.; Robert, M. C. Structure, electron density distribution using maximum entropy method, optical and magnetic characteristics of Fe doped SnS2. Cryst. Res. Technol. 2024, 59, 2300145.
27. Li, Q.; Huang, Y.; Lou, Y.; Hao, M.; Jin, S. Experimental electron density distribution of KZnB3O6 constructed by maximum-entropy method. Powder. Diffr. 2023, 38, 233-9.
28. Kuroiwa, Y.; Aoyagi, S.; Sawada, A.; et al. Evidence for Pb-O covalency in tetragonal PbTiO3. Phys. Rev. Lett. 2001, 87, 217601.
29. Huang, S. X.; Chien, C. L. Extended skyrmion phase in epitaxial FeGe(111) thin films. Phys. Rev. Lett. 2012, 108, 267201.
30. Tokunaga, Y.; Yu, X. Z.; White, J. S.; et al. A new class of chiral materials hosting magnetic skyrmions beyond room temperature. Nat. Commun. 2015, 6, 7638.
31. Karube, K.; White, J. S.; Reynolds, N.; et al. Robust metastable skyrmions and their triangular-square lattice structural transition in a high-temperature chiral magnet. Nat. Mater. 2016, 15, 1237-42.
Cite This Article
How to Cite
Download Citation
Export Citation File:
Type of Import
Tips on Downloading Citation
Citation Manager File Format
Type of Import
Direct Import: When the Direct Import option is selected (the default state), a dialogue box will give you the option to Save or Open the downloaded citation data. Choosing Open will either launch your citation manager or give you a choice of applications with which to use the metadata. The Save option saves the file locally for later use.
Indirect Import: When the Indirect Import option is selected, the metadata is displayed and may be copied and pasted as needed.
About This Article
Copyright

Data & Comments
Data
0


Comments
Comments must be written in English. Spam, offensive content, impersonation, and private information will not be permitted. If any comment is reported and identified as inappropriate content by OAE staff, the comment will be removed without notice. If you have any queries or need any help, please contact us at support@oaepublish.com.