



Optimization design of energy storage performance in ferroelectric nanocomposites based on phase field simulation and machine learning
 0
0 Abstract
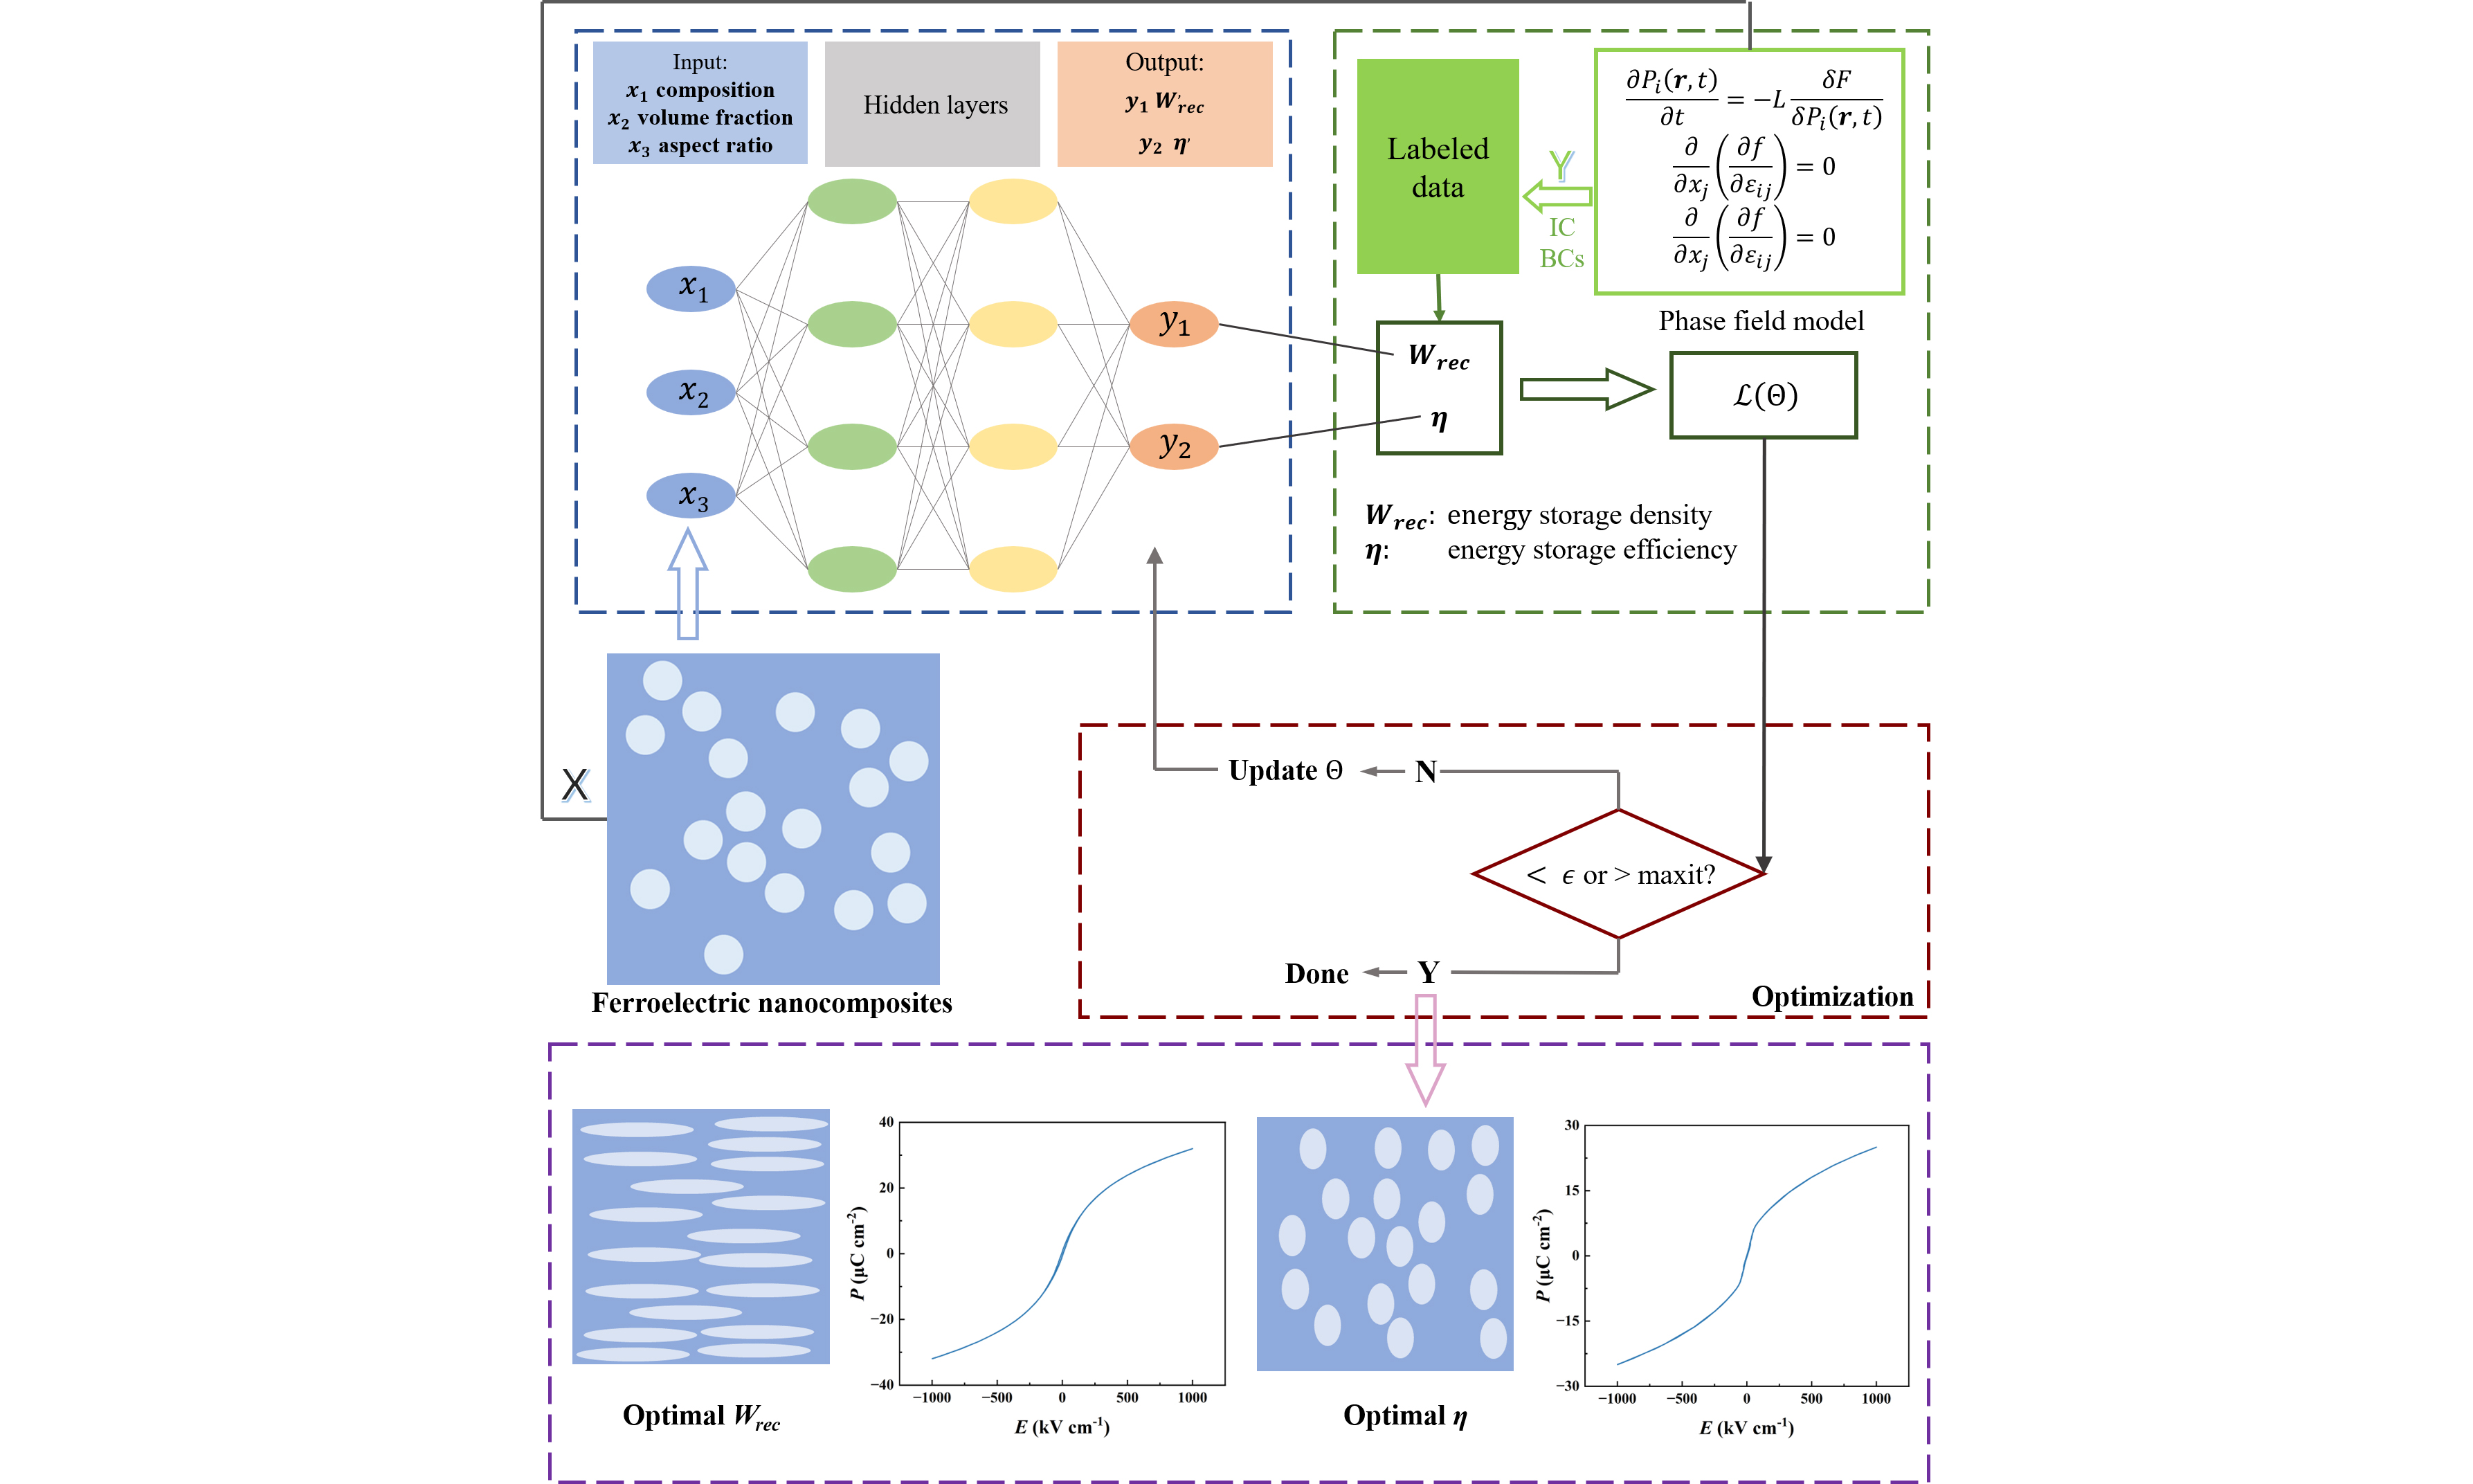
Ferroelectric nanocomposites are promising candidates for dielectric energy storage devices due to their rapid charge–discharge capability and high breakdown strength. However, their energy storage performance is highly dependent on the composition, morphology, and volume fraction of nanofillers. Traditionally, identifying suitable nanofillers has relied on either trial-and-error experimentation or time-consuming computation. Here, by combining the phase-field simulations and machine learning, we propose an approach to rapidly identify optimal nanofillers in PbZr1-xTixO3/SrTiO3 (PZT/STO) nanocomposites to enhance energy storage performance. Phase-field simulations are conducted on the energy storage density and efficiency of the ferroelectric nanocomposites with different compositions, morphologies and volume fractions of PZT nanofillers to construct a dataset, which is employed to train a neural network model. The trained model predicts that the maximum energy storage density is achieved with a nanofiller composition of x = 0.55, a volume fraction of 40%, and an aspect ratio of 7, whereas optimal energy storage efficiency occurs at x = 0.55, 25% volume fraction, and an aspect ratio of 0.636. This work establishes an effective machine learning-based strategy for optimizing the energy storage performance of ferroelectric nanocomposites by efficiently searching the nanofiller design space.
Keywords
INTRODUCTION
Dielectric capacitors, as a category of energy storage devices, have attracted extensive attention due to their ultra-fast charge/discharge rates, high operating voltages and excellent durability[1-3], and are widely used as key components in electronic devices and power systems[4-6]. Owing to their high dielectric constant[7], strong polarizability[8] and good temperature stability[9-11], ferroelectric materials can efficiently store charges[12], making them ideal candidates for these applications. Nevertheless, the relatively low energy storage density and efficiency of ferroelectric materials limit their broader application. Therefore, enhancing the energy storage performance of ferroelectric materials becomes important. The energy storage density (Wrec) and efficiency (η) are defined via the applied electric field (E) and polarization (P) as
To enhance energy storage performance by reducing Pr and increasing Pm, fabricating heterogeneous nanocomposites from complementary materials represents an effective strategy. Jain et al.[13] successfully prepared a novel lead-free (1-x)Ba0.9Sr0.1Ti0.9Hf0.1O3-xNa0.5Bi0.5TiO3 (BSTH-NBT) ceramic nanocomposite and demonstrated that the incorporation of NBT induces relaxor characteristics in the material, resulting in slim P-E hysteresis loops with high Pm and low Pr. Guo et al.[14] introduced Bi6Ti5WO22, a low-loss relaxor ferroelectric, into a P(VDF-HFP) polymer matrix. The BTWO nanofillers concurrently improved the composite’s breakdown strength, dielectric response, insulation, and mechanical properties. Recently, Liu et al.[15] designed a self-assembled PbZr0.53Ti0.47O3-MgO nanocomposite thin film featuring dendrite-shaped ferroelectric phases embedded within an insulating matrix. This structure suppresses breakdown through nano-polarized regions, enhancing energy storage and achieving a density over 200 J/cm3.
The energy storage properties of ferroelectric nanocomposites can be further optimized by adjusting nanofillers. Chen et al.[16] conducted a phase-field simulation study to investigated the effects of filler volume fraction, size, and aspect ratio on the energy storage performance of xBiFeO3-(1-x)SrTiO3 composites. It is revealed that increasing the volume fraction improves energy storage efficiency, while moderate particle size reduction simultaneously improves both density and efficiency. Extending this computational strategy to data-driven screening, a combined phase-field and machine learning approach was used to optimize polar configurations, identifying nanopillar-shaped regions as optimal for simultaneously achieving high polarization intensity and rapid dipole switching. Xie et al.[17] developed a physical-assisted tape casting method to control the orientation of BaTiO3 nanowires in a polymer matrix. The resulting Z-axis-aligned composites achieved 10.8 J·cm-3 and 61.4% efficiency at 2,400 kV·cm-1, outperforming X-Y-aligned ones even at 3,400 kV·cm-1. Jiang et al.[18] constructed spherical BaTiO3 nanoparticles with gradient distribution in P(VDF-HFP)-based nanocomposites, which significantly enhanced both mechanical and electrical properties in the out-of-plane direction, thereby substantially improving breakdown strength and energy storage density. Shen et al.[19] employed high-throughput phase-field computations to design an optimized sandwich microstructure for PVDF-BaTiO3 nanocomposites. By arranging parallel nanosheets in the upper and lower layers and vertically aligned nanofibers in the middle, they achieved a composite with an energy density 2.44 times that of pure PVDF polymer. Therefore, constructing nanocomposites with optimized filler configurations provides an effective approach for enhancing ferroelectric energy storage performance. However, most current simulation studies typically assume that the nanofillers have the same crystal orientation, neglecting the crucial effects of crystal orientation variations among nanofillers. Moreover, the design space of nanofillers, which encompasses multiple dimensions such as composition, morphology, and volume fraction, is extremely vast, making the process of identifying optimal nanofillers through experiments or direct computation prohibitively time-consuming and costly.
In this work, we employ a phase-field model based on the time-dependent Ginzburg-Landau (TDGL) equation that explicitly accounts for the crystal orientation of nanofillers to simulate the energy storage density and efficiency of the ferroelectric nanocomposites with different nanofiller compositions, morphologies and volume fractions. We selected PbZr1-xTixO3 (PZT) particles with high maximum polarization and tunable composition as the nanofiller, and SrTiO3 (STO) with low remnant polarization as the matrix. Through simulating the polarization-electric field (P-E) hysteresis loops and the evolution of domain structures under varying conditions, we analyze the effects of filler composition, volume fraction and aspect ratio on the energy storage properties. Furthermore, we construct a dataset based on the energy storage density and efficiency obtained from phase-field simulations. The dataset is employed to train a neural network model. By dividing the parameter space into 8,000 combinations, the trained model is used to calculate their performance, from which the optimal filler parameter combinations for achieving maximum energy storage density and efficiency are identified. This work not only elucidates the mechanisms by which filler composition, volume fraction, and aspect ratio influence energy storage performance, but also establishes an effective machine learning strategy to optimize ferroelectric nanocomposites through efficient exploration of the nanofiller design space.
METHODS
Phase-field model
Due to the great advantage of the phase-field model in studying the domain structure as well as polarization switching under the electric field of ferroelectrics, it has been used by many scholars to study ferroelectric thin films, single crystals, polycrystals, etc.[20-23]. For readability, the previously established method is represented in the following. To account for the individual crystalline orientation of each filler particle in PbZr1-xTixO3 /SrTiO3 (PZT/STO) nanocomposites, we employ a ferroelectric polycrystalline phase-field model that assigns specific crystalline orientations to every filler particle. For polycrystalline ferroelectrics, it is essential to represent the local-field variables of individual grains in terms of field variables in the global coordinate system (e.g., spontaneous polarization, strain, electric field, etc.)[24]. For each grain (filler), the total free-energy density is formulated as a function of the local polarization
The terms on the right-hand side of equation (1) represent the Landau energy, elastic energy, coupling energy, polarization gradient energy, and electric field energy, respectively. The Landau energy is expressed as
Where
the coefficients cijkl and qijkl correspond to the elastic and electrostrictive constants, respectively. The gradient energy density, which accounts for the contribution of domain walls to the total free energy density, can be expressed in expanded form as:
where Gijkl are the gradient energy coefficients, and the term
where kc is the dielectric constant of the background materials.
To achieve a unified representation of the total free energy for ferroelectrics within the global coordinate framework, it is imperative to express the strain
where Rij is the transformation matrix and can be expressed as:
The total free energy is given by integrating the free energy density over the entire volume
where r and t are the space vector and time, respectively, L is the kinetic coefficient.
In addition to the TDGL equation, two other equilibrium equations should be satisfied. That is, the mechanical equilibrium equations
and the Maxwell equation
Finally, Equations (8)-(10) form the governing equations for domain structure evolution in ferroelectric materials. However, obtaining an analytical solution to this set of coupled nonlinear partial differential equations is highly challenging. To numerically solve Equations (8)-(10) in real space, we use a numerical method to solve them, i.e., the nonlinear multi-coupled finite element method, which is based on the following weak solution form
where ξij = Pi,j, ti is the stress vector at the surface of the particle, ui is the displacement, ϕ is the electric potential,
In the two-dimensional phase field simulation, we employ different geometric models to investigate the effects of different nanofiller volume fractions and aspect ratios on the energy storage properties of PZT/STO nanocomposites. The aspect ratio refers to the ratio of semi-major axis “a” and semi-minor axis “b” of elliptical nano-filler, which is defined by a/b. Figure 1A gives an example model of nanocomposites with the filler volume fraction of V = 20% and an aspect ratio of 1, in which the light blue circles represent PZT filler particles, with internal arrows indicating crystalline orientation, while the dark blue substrate represents STO, with dimensions of 50 nm × 50 nm. It should be noted that, all models assume random crystalline orientation of nanofillers to eliminate the influence of the single orientation on the results. And for computational simplicity, each filler is assumed as a single crystal. Furthermore, all models in this work are computed under identical electric field conditions, without considering the influence of breakdown strength. More comprehensive studies in this regard will be conducted in the future. In this model, periodic boundary conditions are applied to displacement, electric potential, and polarization components along the X1 direction. In addition to imposing periodic boundary conditions along the X1 direction, nodal constraints are required to exclude rigid body displacements. The hysteresis loops are obtained by applying an electric field along the X2 direction through the imposition of varying electrostatic potentials. The upper surface is grounded and the lower surface gives the potential values corresponding to the loading and unloading electric field. In the simulation region, the initial values of the polarization components are generated randomly and the average polarization amplitude is kept zero. The macroscopic polarization of the ferroelectric nanocomposites is defined as the average polarization along the X2 direction, and the parameters of STO and PZT material used in this work are adopted from reference[27].
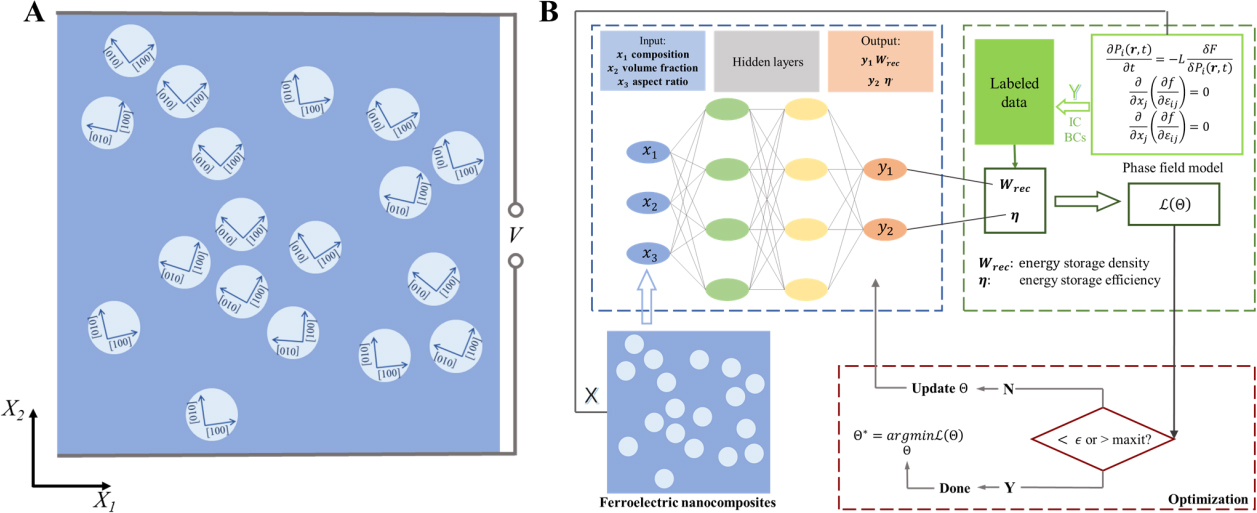
Figure 1. (A) The schematic diagram of the ferroelectric nanocomposite material PZT-STO and (B) the flowchart of neural network training process. PZT-STO: PbZr1-xTixO3- SrTiO3.
Neural network model
The neural network model employed in this work is a multilayer feedforward neural network. With the exception of the input layer, the value of each node in every layer is determined by a straightforward transformation of the preceding layer. Specifically:
where a(i) denotes the node values of the i-th layer, with i = 0 represents the input layer and i = N0 representing the output layer, while W(i), b(i), and σ(i) correspond to the weight matrix, bias vector, and activation function of the i-th layer, respectively.
For conciseness, the complete transformation represented by Equation (12) can be compressed into a single operator FNN, such that
Here, the function L serves to quantify the discrepancy between predicted values and true values. Following the determination of the neural network’s foundational architecture (e.g., layer count, nodes per layer, and activation functions), the weight matrix W(i) and bias vector b(i) can be iteratively updated via the backpropagation algorithm in combination with an optimizer, thereby progressively minimizing the loss function value ϵloss. This comprehensive process of parameter optimization constitutes what is known as neural network training, and its flowchart is shown in Figure 1B.
RESULTS AND DISCUSSION
Effect of nanofiller composition on energy storage performance
When investigating the effect of filler composition on the energy storage performance of ferroelectric nanocomposites, we selected nine compositions of PbZr1-xTixO3 with x varying from 0.1 to 0.9 in increments of 0.1. Figure 2A displays the P-E loops corresponding to filler compositions of x = 0.1, 0.3, 0.5, 0.7 and 0.9 when V = 20% and a/b = 1. The results show that with increasing x, the polarization strength of the hysteresis loops gradually enhances. Figure 2B presents the energy storage density and efficiency for all nine filler compositions. It can be clearly observed that the energy storage density peaks at x = 0.5, while the energy storage efficiency exhibits a monotonically decreasing trend with increasing x, though all values remain above 95%.
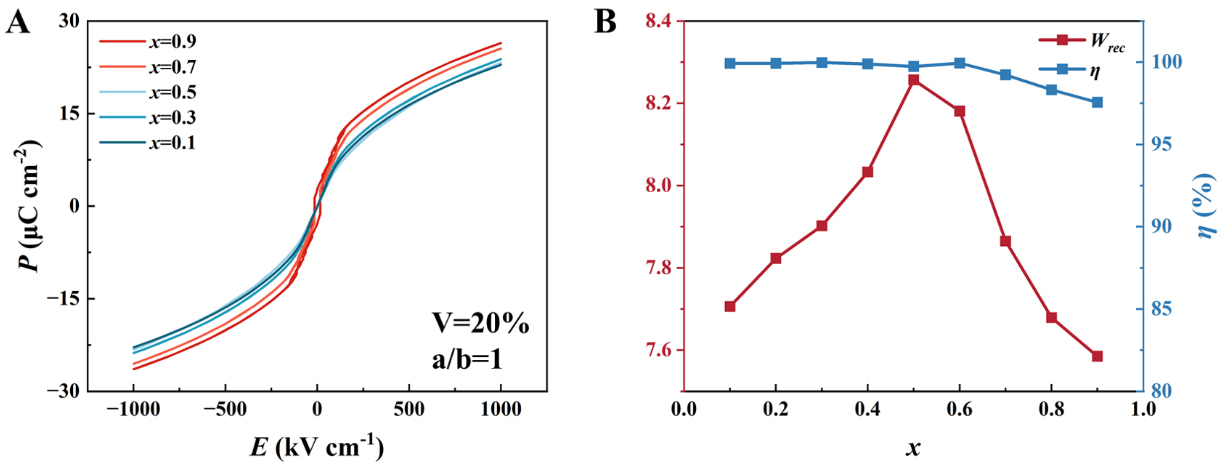
Figure 2. Effect of compositions x of PZT on (A) P-E loops and (B) energy storage performance of ferroelectric nanocomposites when the volume faction V = 20% and aspect ratio a/b = 1. PZT: PbZr1-xTixO3; P-E: polarization-electric field.
According to previous studies[28-30], the morphotropic phase boundary (MPB) of PZT is known to be located near x ≈ 0.48, which corresponds to the region where the PZT system exhibits optimal piezoelectric and ferroelectric properties. Therefore, the observed peak in energy storage density of ferroelectric nanocomposites near x = 0.5 aligns with these intrinsic physical characteristics. Regarding energy storage efficiency, it is evident that as x increases, the area enclosed by the hysteresis loops progressively expands. According to the energy storage efficiency calculation formula, under the condition of decreasing energy storage density and increasing hysteresis area, the resulting efficiency gradually diminishes. This trend aligns with the declining pattern of the energy storage efficiency curve shown in Figure 2B. These results demonstrate that the energy storage performance of ferroelectric nanocomposites can be optimized by adjusting the filler composition, the energy storage performance is optimal when the composition is x = 0.5.
Effect of nanofiller volume fraction on energy storage performance
When investigating the effect of filler volume fraction on the energy storage performance of ferroelectric nanocomposites, the composition is taken as x = 0.9 and seven different volume fractions starting from 10% with 5% increments up to 40% are employed. Figure 3A displays the P-E loops corresponding to different filler volume fractions when x = 0.9 and a/b = 1. A decrease in volume fraction implies reduced PZT content, leading to diminished polarization strength. During the initial reduction of volume fraction, the decrease in remanent polarization contributes to enhanced energy storage density. However, when the volume fraction decreases beyond a certain threshold, the maximum polarization also substantially decreases, resulting in reduced energy storage density, as shown by the red curve in Figure 3B. Regarding energy storage efficiency, it is evident that as the filler volume fraction decreases, the hysteresis loops become progressively slimmer. Consequently, the energy storage efficiency demonstrates a monotonically increasing trend. This study provides insight that when adjusting the energy storage performance of composites by modifying the filler volume fraction, excessively low volume fractions may lead to decreased energy storage density, and only moderate adjustments can achieve optimal results.
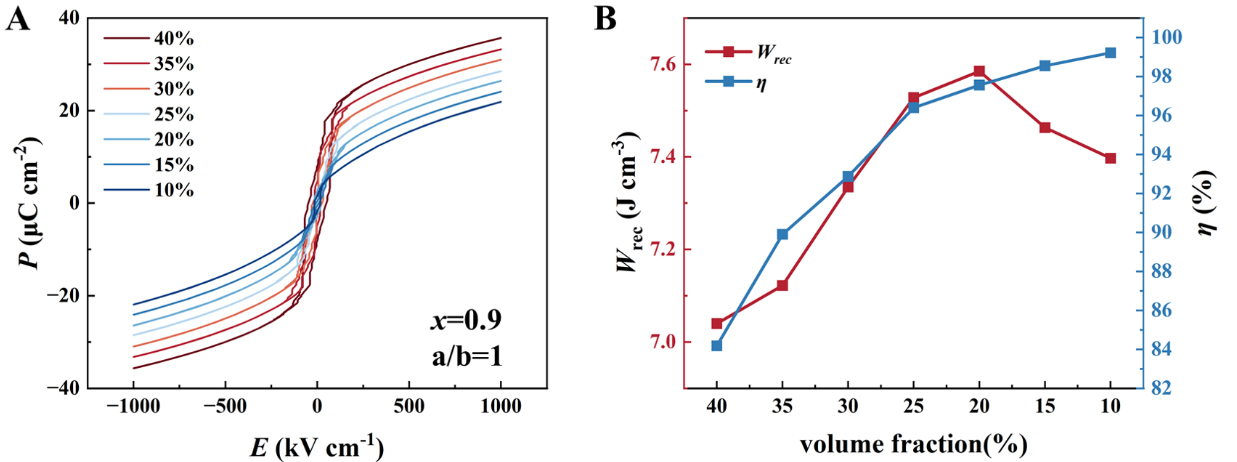
Figure 3. Effect of different volume fractions of PZT on (A) P-E loops and (B) energy storage performance of ferroelectric nanocomposites when composition x = 0.9 and aspect ratio a/b = 1. PZT: PbZr1-xTixO3; P-E: polarization-electric field.
To clarify the effect of PZT volume fraction on energy storage performance from microstructure point of view, Figure 4 displays the domain structures of the composite under remnant polarization state with filler volume fractions of 40%, 30%, 20%, and 10%. In the figure, as shown by the color bar, blue and red represent the polarization components along the positive and negative X2 directions, respectively. As shown in Figure 4A, when the filler volume fraction is high, the composite contains not only vortex domains but also single domains with high polarization strength and 90° domains. When the volume fraction decreases to 30%
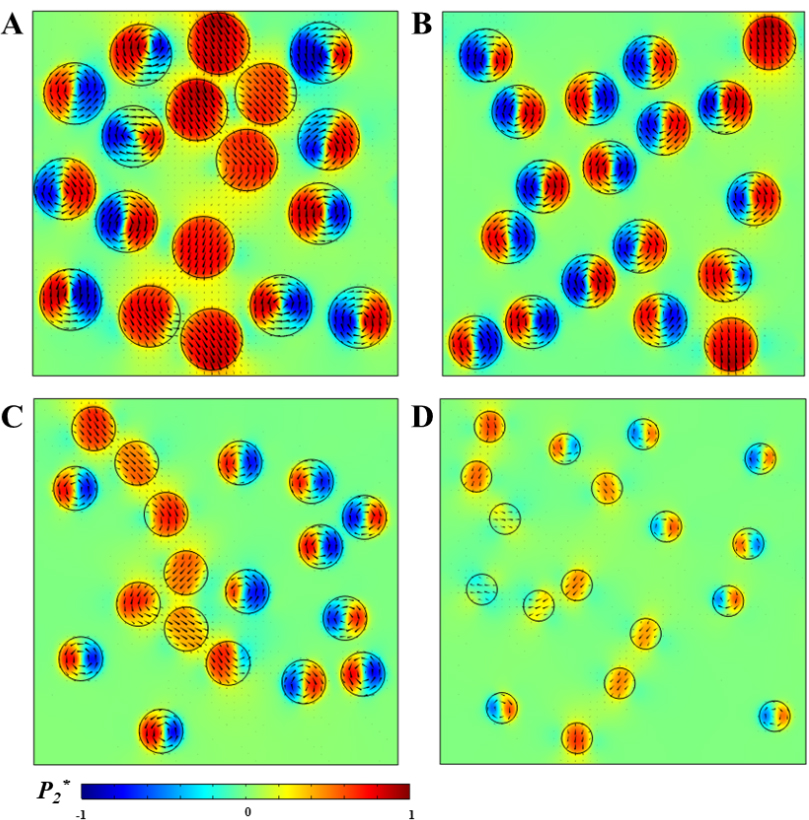
Figure 4. Domain structures of composites with composition x = 0.9 and aspect ratio a/b = 1 under remanent polarization state for the filler volume fractions of (A) 40%, (B) 30%, (C) 20%, and (D) 10%.
Supplementary Figure 1 displays the domain structures of the composite under maximum polarization state at filler volume fractions of 40%, 30%, 20%, and 10%. The figure clearly shows that the material's high polarization strength primarily originates from the “red” PZT fillers. As the PZT volume fraction decreases, the area of red regions representing high polarization strength progressively diminishes, directly leading to the reduction of macroscopic polarization strength.
Effect of nanofiller aspect ratio on energy storage performance
When studying the effect of filler aspect ratio on the energy storage performance of ferroelectric nanocomposites, we took the composites with the volume faction of V = 20% and the composition of x = 0.9 as an example. It should be noted that, according to the definition in this work, the aspect ratio of circular particles is the ratio of their horizontal axis length to vertical axis length, and changing this ratio corresponds to their transformation into elliptical shapes. Additionally, the two-dimensional model adopted in this study provides operational convenience in adjusting the aspect ratio, which differs from the practical difficulty of controlling this parameter experimentally. Hence, the larger aspect ratios discussed later are primarily used for extending qualitative trend analysis. Figure 5A displays the typical P-E loops at different aspect ratios. It can be observed that as the aspect ratio increases, the remanent polarization gradually decreases, while the maximum polarization remains largely unchanged, and the shape of P-E loop progressively becomes slimmer. As mentioned earlier, when discussing the effect of volume fraction on the material’s energy storage performance, we found that energy storage density decreases due to the reduction in maximum polarization. In this section, however, we discover that adjusting the particle aspect ratio can effectively reduce remanent polarization while maintaining high maximum polarization, thereby causing the material’s energy storage density to increase monotonically within the simulated range, as shown by the red curves in Figure 5B. Regarding energy storage efficiency, as indicated by the blue curves in Figure 5B, a peak appears at an aspect ratio of approximately 1. When the aspect ratio is less than 1, increasing it significantly narrows the P-E loop, resulting in a monotonically increasing trend in energy storage efficiency; when the aspect ratio exceeds 1, further increasing it does not significantly alter the hysteresis area, thus the energy storage efficiency does not show a clear trend but remains at a relatively high level above 90%. These findings demonstrate that controlling the aspect ratio of filler particles is an effective strategy for optimizing the energy storage performance of composites. Within the simulated parameter range, increasing the aspect ratio can synergistically optimize maximum and remanent polarization, enabling simultaneous improvement of energy storage density and efficiency across a broad range.
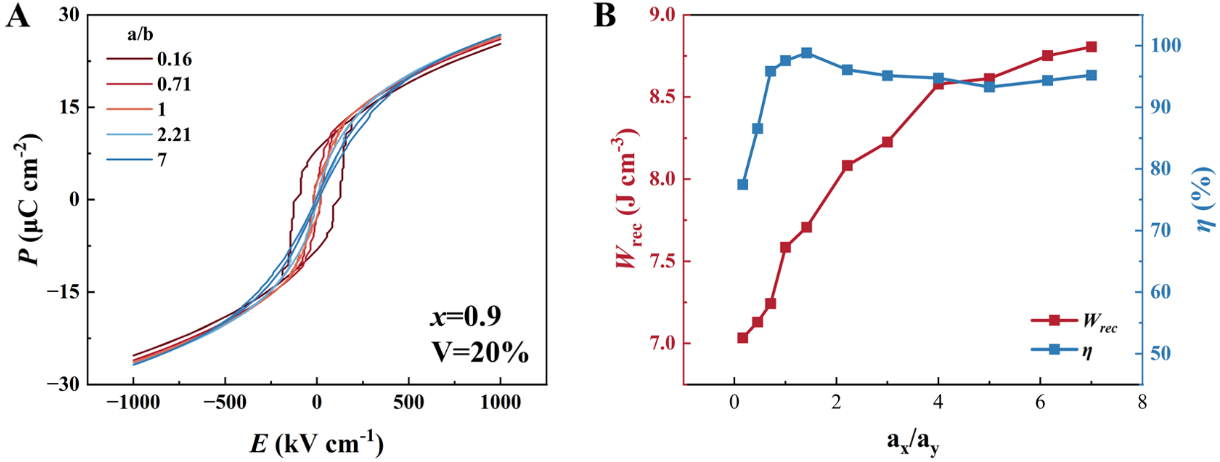
Figure 5. Effect of different aspect ratios of PZT on (A) P-E loops and (B) energy storage performance of composites with composition x = 0.9 and volume fraction V = 20%. PZT: PbZr1-xTixO3; P-E: polarization-electric field.
Figure 6 shows the domain structures of the composite material under remanent polarization state with filler aspect ratios of 0.16, 0.45, 0.71, 1.42, 2.21, and 7. As shown in Figure 6A, when the filler aspect ratio is small, the domains within the composite are predominantly c-domains with out-of-plane orientation. As the aspect ratio increases to 0.45, vortex domains that can reduce polarization strength begin to appear, as shown in Figure 6B. With further increase in aspect ratio, the number of vortex domains significantly increases; at an aspect ratio of 1.42, the domain structure is completely composed of vortex domains, leading to a significant reduction in remanent polarization. Subsequently, as the aspect ratio continues to increase, a-domains with in-plane orientation gradually form within the material, as shown in Figure 6E, causing further reduction in remanent polarization. When the aspect ratio reaches 7, the domain structure almost completely transforms into a-domains, corresponding to the lowest remanent polarization. This series of domain structure evolution patterns is consistent with the variation characteristics shown in the P-E loops in Figure 5. The influence of thickness is also important, which will be further considered in the future to provide more parameter options for optimizing the energy storage performance of composites and achieve better optimization outcomes.
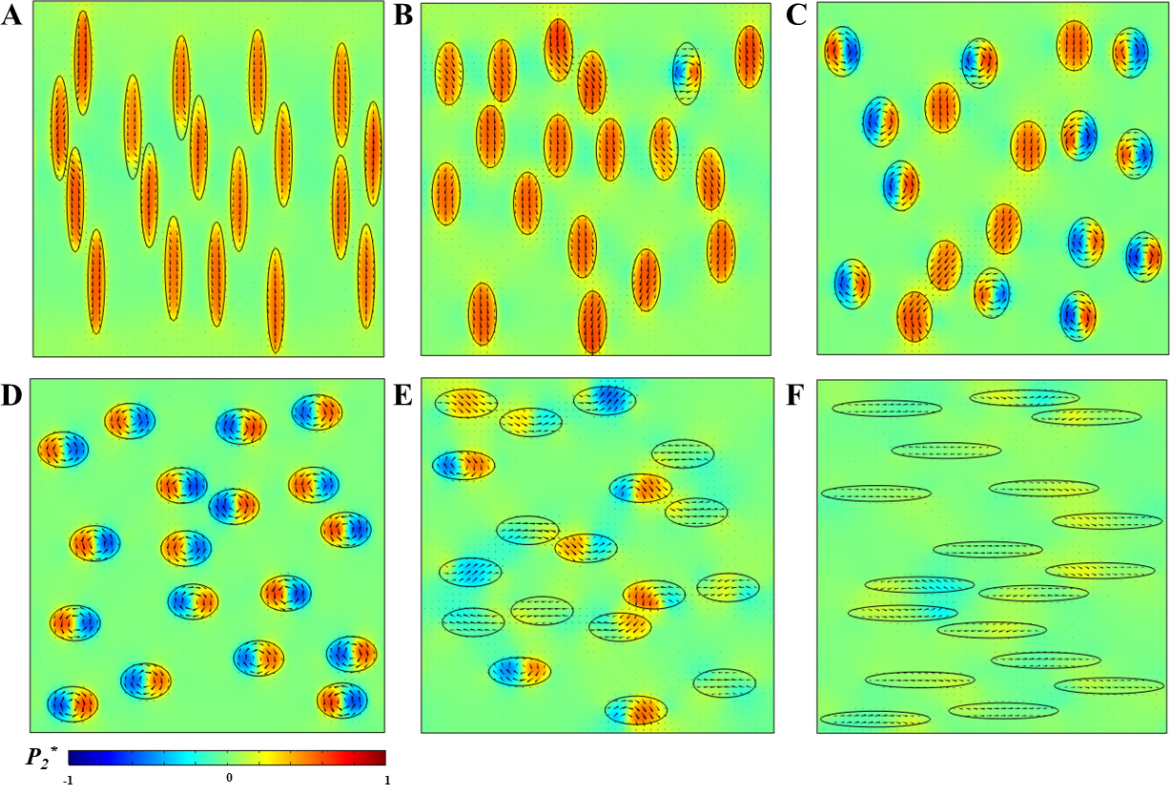
Figure 6. Domain structures of composites with composition x = 0.9 and volume fraction V = 20% under remanent polarization state for the filler aspect ratios of a/b = 0.16(A), 0.45(B), 0.71(C), 1.42(D), 2.21(E), and 7(F).
Prediction of energy storage performance by machine learning
In the aforementioned phase-field simulations, we have primarily focused on optimizing the energy storage performance of ferroelectric nanocomposites by adjusting filler composition, volume fraction, and aspect ratio. However, systematic investigation of these parameters remains insufficient, and the precise value ranges for these variables have not been fully explored. To more accurately identify the optimal combination of filler parameters for achieving peak energy storage performance, we have introduced a neural network approach for in-depth analysis and optimization.
First, we selected filler composition, volume fraction, and aspect ratio as three key descriptors. An initial dataset was constructed based on 396 sets of phase-field simulation data. This dataset was randomly divided into two parts: 90% for network training and 10% as a test set. Within the training data, 10% was excluded from direct network training to serve as a validation set for preventing overfitting. A neural network model was employed to accurately predict the energy storage density and efficiency of the materials. As shown in Figure 7A, for the prediction results of energy storage density, the variance values R2 for the training set and test set reach 0.981 and 0.978, respectively, with all data points closely distributed near the y = x (dotted line) reference line, indicating a high consistency between the neural network’s predicted values and the phase-field simulation results. However, a set of points deviating from the y = x line are distributed in an approximately straight pattern below it. These points correspond to a filler volume fraction of 30%, an aspect ratio of 1.47, and filler composition of x = 0.1, 0.2, … , 0.7. This phenomenon arises because, under these specific parameter conditions (V = 30% and a/b = 1.47), the energy storage density obtained from the phase-field simulations exhibits a distinct “jump. Because this variation pattern differs from trends observed with other parameter combinations, this series of data exhibits systematic deviations between predicted and actual results, thereby forming the “ghost line”. It should be noted that the neural network was trained on a large-scale dataset, and such localized “anomalies” do not affect the overall accuracy or predictive validity of the model. Similarly, as shown in Figure 7B, the prediction of energy storage efficiency also demonstrates high accuracy, with R2 values of 0.975 and 0.945 for the training set and test set, respectively, further validating the effectiveness and generalization capability of the established model.
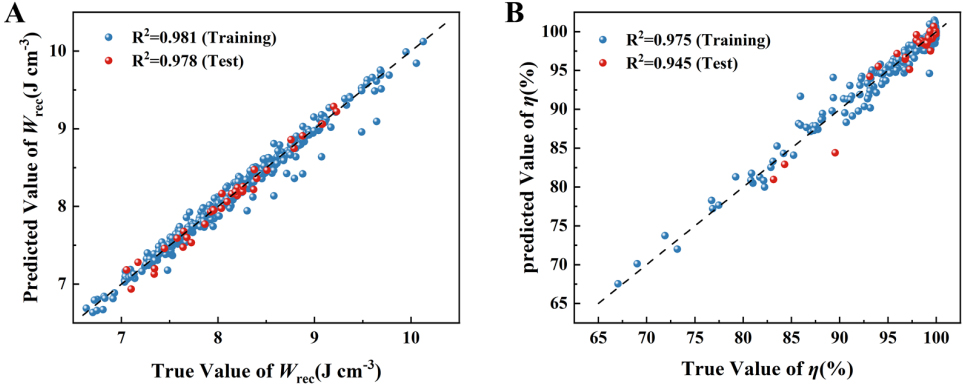
Figure 7. Comparison between phase-field simulation results and neural network predictions for (A) energy storage density and (B) energy storage efficiency.
After validating the prediction accuracy of the neural network, we subdivided the three parameters of filler composition, volume fraction, and aspect ratio, discretizing each parameter into 20 data points within their respective ranges. Based on these 8,000 (20 × 20 × 20) combinations, we predicted their energy storage performance using the neural network and found that the system achieves optimal energy storage density when the filler composition is x = 0.55, the volume fraction is V = 40%, and the aspect ratio is a/b=7, while the system achieves optimal energy storage efficiency when the composition is x = 0.55, the volume fraction is 25%, and the aspect ratio is 0.636. To further verify the prediction accuracy of the neural network, phase field simulations are conducted for the predicted two optimal combinations. The simulated P-E loops for the optimal energy storage density and the optimal energy storage efficiency are given in Figure 8A and B, respectively. Verification via phase-field simulation for the two optimal combinations yielded an energy storage density of 10.131 J·cm-3 and an energy storage efficiency of 99.94%, respectively, with deviations from the neural network predictions not exceeding 3%. Furthermore, these results align with the previous phase field simulation that energy storage performance is superior when the composition is near the MPB and the aspect ratio is large, further validating the consistency between physical model and machine learning predictions.
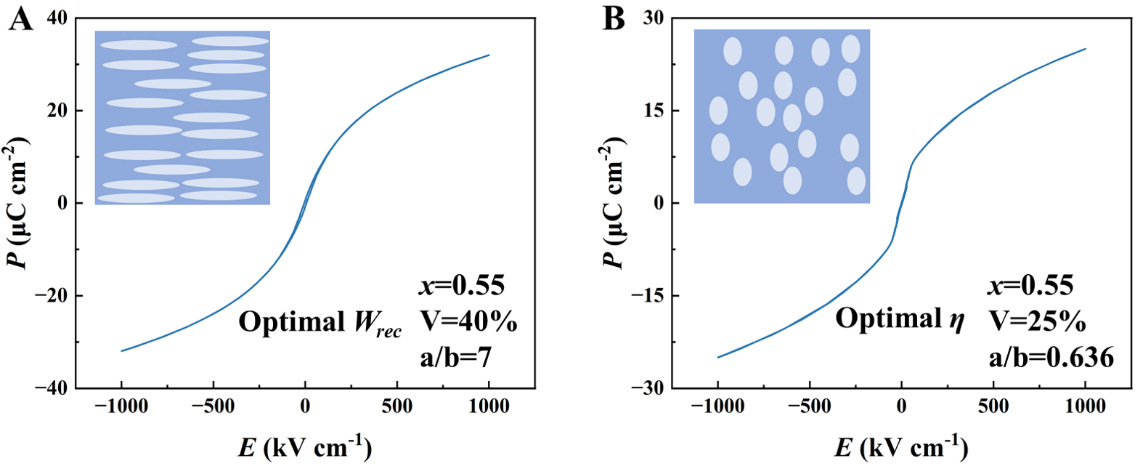
Figure 8. The P-E loops obtained by phase field simulations for the nanocomposites with the optimal energy storage density (A) and efficiency (B). The inserts show the corresponding nanocomposite models predicted by the neural network. P-E: Polarization-electric field.
CONCLUSION
In this study, we successfully developed an integrated approach combining phase-field simulations and machine learning to identify optimal nanofillers for enhancing the energy storage performance of PZT/STO nanocomposites. By leveraging a phase-field model with explicit consideration of nanofiller crystal orientation, we simulated the energy storage density and efficiency of ferroelectric nanocomposites with diverse nanofiller compositions, morphologies, and volume fractions to construct a dataset. A neural network model is constructed and trained based on the dataset. The trained neural network effectively identified favorable structural configurations within the high-dimensional design space. Phase field simulations are further conducted for the predicted optimal combinations and the results are consistent with the neural network prediction. This work not only elucidates the mechanisms by which filler composition, volume fraction, and aspect ratio influence energy storage performance, but also establishes a robust and efficient machine-learning-driven strategy for optimizing the energy storage performance of ferroelectric nanocomposites through rapid and accurate exploration of the high-dimensional nanofiller design space.
DECLARATIONS
Authors’ contributions
Writing - original draft, formal analysis, data curation, visualization: Wang, Z.
Methodology: Shang, L.; Zheng, Z.
Writing-review & editing, supervision, funding acquisition, conceptualization: Shang, L.; Wang, J.
Availability of data and materials
The raw data supporting the findings of this study are available within this Article and its Supplementary Materials. Further data are available from the corresponding authors upon reasonable request.
AI and AI-assisted tools statement
During the preparation of this manuscript, the AI tool DeepSeek (version 3, released 2024-12-26) was used solely for language editing. The tool did not influence the study design, data collection, analysis, interpretation, or the scientific content of the work. All authors take full responsibility for the accuracy, integrity, and final content of the manuscript.
Financial support and sponsorship
This work was financially supported by the National Natural Science Foundation of China (Nos. 12272338, 12432007, and 12502191).
Conflicts of interest
Wang, J. is an Editorial Board Member of the journal Microstructures. Wang, J. was not involved in any steps of editorial processing, notably including reviewers’ selection, manuscript handling or decision making. The other authors declare that there are no conflicts of interest.
Ethical approval and consent to participate
Not applicable.
Consent for publication
Not applicable.
Copyright
© The Author(s) 2026.
Supplementary Materials
REFERENCES
1. Wang, G.; Lu, Z.; Li, Y.; et al. Electroceramics for high-energy density capacitors: current status and future perspectives. Chem. Rev. 2021, 121, 6124-72.
2. Palneedi, H.; Peddigari, M.; Hwang, G. T.; Jeong, D. Y.; Ryu, J. High-performance dielectric ceramic films for energy storage capacitors: progress and outlook. Adv. Funct. Mater. 2018, 28, 1803665.
3. Yang, H.; Bin, C.; Zhao, Y.; et al. A novel low-loss and high-stability (1-x)Na0.98NbO3-xBi(Al0.5Y0.5)O3 lead-free composite ceramics for dielectric energy storage capacitors. Chem. Eng. J. 2023, 475, 146426.
4. Pan, H.; Li, F.; Liu, Y.; et al. Ultrahigh-energy density lead-free dielectric films via polymorphic nanodomain design. Science 2019, 365, 578-82.
5. Yang, M.; Ren, W.; Guo, M.; Shen, Y. High-energy-density and high efficiency polymer dielectrics for high temperature electrostatic energy storage: a review. Small 2022, 18, 2205247.
6. Tan, D. Q. Review of polymer-based nanodielectric exploration and film scale-up for advanced capacitors. Adv. Funct. Mater. 2019, 30, 1808567.
7. Shkuratov, S. I.; Lynch, C. S. A review of ferroelectric materials for high power devices. J. Materiomics. 2022, 8, 739-52.
8. Wu, J.; Wu, T. A bright new world of ferroelectrics: magic of spontaneous polarization. ACS. Appl. Mater. Interfaces. 2020, 12, 52231-3.
9. Yan, Y.; Cho, K.; Priya, S. Piezoelectric properties and temperature stability of Mn-doped Pb(Mg1/3Nb2/3)-PbZrO3-PbTiO3 textured ceramics. Appl. Phys. Lett. 2012, 100, 132908.
10. Qiao, X.; Geng, W.; Chen, X.; et al. Enhanced energy storage properties and temperature stability of fatigue-free La-modified PbZrO3 films under low electric fields. Sci. China. Mater. 2020, 63, 2325-34.
11. Huang, X.; Peng, J.; Zeng, J.; Zheng, L.; Li, G.; Karaki, T. The high piezoelectric properties and high temperature stability in Mn doped Pb(Mg0.5W0.5)O3-Pb(Zr,Ti)O3 ceramics. Ceram. Int. 2019, 45, 6523-7.
13. Jain, A.; Wang, Y.; Guo, H.; Wang, N. Grain size engineered Ba0.9Sr0.1Ti0.9Hf0.1O3‐Na0.5Bi0.5TiO3 relaxor ceramics with improved energy storage performance. J. Am. Ceram. Soc. 2020, 103, 6308-18.
14. Guo, Y.; Zhou, D.; Li, R.; et al. Novel relaxor ferroelectric BTWO nanofillers for improving the energy storage performance of polymer-based dielectric composites. J. Energy. Storage. 2024, 76, 109585.
15. Liu, Y.; Li, M.; Jiang, K.; et al. Radiation-hardened dendritic-like nanocomposite films with ultrahigh capacitive energy density. Nat. Commun. 2025, 16, 3882.
16. Chen, X.; Shen, Z. H.; Liu, R. L.; et al. Programming polarity heterogeneity of energy storage dielectrics by bidirectional intelligent design. Adv. Mater. 2024, 36, 2311721.
17. Xie, B.; Zhang, H.; Zhang, Q.; et al. Enhanced energy density of polymer nanocomposites at a low electric field through aligned BaTiO3 nanowires. J. Mater. Chem. A. 2017, 5, 6070-8.
18. Jiang, Y.; Zhang, X.; Shen, Z.; et al. Ultrahigh breakdown strength and improved energy density of polymer nanocomposites with gradient distribution of ceramic nanoparticles. Adv. Funct. Mater. 2019, 30, 1906112.
19. Shen, Z. H.; Wang, J. J.; Lin, Y.; Nan, C. W.; Chen, L. Q.; Shen, Y. High-throughput phase-field design of high-energy-density polymer nanocomposites. Adv. Mater. 2017, 30, 1704380.
20. Hu, H. L.; Chen, L. Q. Three-dimensional computer simulation of ferroelectric domain formation. J. Am. Ceram. Soc. 2005, 81, 492-500.
21. Li, Y. L.; Hu, S. Y.; Liu, Z. K.; Chen, L. Q. Phase-field model of domain structures in ferroelectric thin films. Appl. Phys. Lett. 2001, 78, 3878-80.
22. Li, Y. L.; Hu, S. Y.; Liu, Z. K.; Chen, L. Q. Effect of electrical boundary conditions on ferroelectric domain structures in thin films. Appl. Phys. Lett. 2002, 81, 427-9.
23. Li, Y.; Hu, S.; Liu, Z.; Chen, L. Effect of substrate constraint on the stability and evolution of ferroelectric domain structures in thin films. Acta. Mater. 2002, 50, 395-411.
24. Wang, J.; Shu, W.; Shimada, T.; Kitamura, T.; Zhang, T. Role of grain orientation distribution in the ferroelectric and ferroelastic domain switching of ferroelectric polycrystals. Acta. Mater. 2013, 61, 6037-49.
25. Li, X.; Wang, J. Effect of grain size on the domain structures and electromechanical responses of ferroelectric polycrystal. Smart. Mater. Struct. 2017, 26, 015013.
26. Crossley, S.; Mcginnigle, J. R.; Kar-Narayan, S.; Mathur, N. D. Finite-element optimisation of electrocaloric multilayer capacitors. Appl. Phys. Lett. 2014, 104, 082909.
27. Physics of Ferroelectrics; Topics in Applied Physics, Vol. 105; Springer Berlin Heidelberg, 2007.
28. Guarany, C. A.; Araújo, E. B.; Silva, P. R.; Saitovitch, H. Hyperfine interaction measurements on ceramics: PZT revisited. Physica. B:. Condensed. Matter. 2007, 389, 130-4.
29. Liu, Z.; Wu, H.; Ren, W.; Ye, Z. Synthesis, structure and electric properties of a novel solid solution system: (1-x)Pb(Zr0.52Ti0.48)O3-xBi(Zn2/3Nb1/3)O3. Ferroelectrics 2019, 533, 183-91.
30. Xie, B.; Wang, T.; Cai, J.; et al. High energy density of ferroelectric polymer nanocomposites utilizing PZT@SiO2 nanocubes with morphotropic phase boundary. Chem. Eng. J. 2022, 434, 134659.
Cite This Article
 Open Access
How to Cite
Download Citation
Export Citation File:
Type of Import
Tips on Downloading Citation
Citation Manager File Format
Type of Import
Direct Import: When the Direct Import option is selected (the default state), a dialogue box will give you the option to Save or Open the downloaded citation data. Choosing Open will either launch your citation manager or give you a choice of applications with which to use the metadata. The Save option saves the file locally for later use.
Indirect Import: When the Indirect Import option is selected, the metadata is displayed and may be copied and pasted as needed.
About This Article
Special Topic
Copyright

Data & Comments
Data
0







Comments
Comments must be written in English. Spam, offensive content, impersonation, and private information will not be permitted. If any comment is reported and identified as inappropriate content by OAE staff, the comment will be removed without notice. If you have any queries or need any help, please contact us at support@oaepublish.com.