


Anisotropic strength and plastic deformation behavior of MAX phase Ti3AlC2 under ultrahigh pressure
 0
0 
Abstract
Machinable layered ternary carbides and nitrides (MAX phases) are a class of multifunctional materials combining the advantages of both ceramics and metals, making them of vital technological importance. Understanding their mechanical behavior is critical for practical applications and failure analysis. However, there is still no in situ investigation on their strength and plastic deformation under high pressure/stress. In this study, we investigate the strength and texture development of Ti3AlC2 under nonhydrostatic pressure up to 41 GPa. Clear strength anisotropy was observed and the lattice stress states of different planes were determined. At 41 GPa, the highest differential stresses supported by the (10-10) plane and (0008) plane are approximately 13.7 GPa and 4.5 GPa, respectively. The average strength exceeds that of stishovite, one of the strongest oxides. A strong 0001 deformation texture developed under ultra-high stress. This work clearly reveals the lattice-stress states and deformation behavior of Ti3AlC2 under high stress, offering direct experimental insights for the design and processing of MAX phase materials.
Keywords
INTRODUCTION
Machinable layered ternary carbides and nitrides, known as MAX phases and represented by the general chemical formula Mn+1AXn (where M is an early transition metal element, A is an A group element, X is C or N, and n is 1-3), combine advantages of ceramics and metals, making them of vital technological importance[1-4]. All MAX phases crystallize in the hexagonal system with space group P63/mmc. The unique properties of MAX phases are attributed to their layered structure consisting of M6X octahedra separated by layers of A atoms where the M6X octahedra are identical to those found in the corresponding binary MX carbides. Like ceramics, MAX phases are refractory, oxidation resistant and can maintain their high strength at elevated temperatures. Like metals, they exhibit high electrical and thermal conductivity, excellent machinability and thermal shock resistance[1-3,5]. Furthermore, MAX phases have also shown other unique properties: at room temperature, they can fully recover after being compressed under stresses as high as 1 GPa while dissipating 25% of the mechanical energy[6]; at higher temperatures, they undergo a brittle-to-ductile transition and their mechanical behavior is strongly affected by the deformation rate. Dislocation plays a crucial role in the deformation of MAX phases. Previous reports show that dislocations in uniaxially deformed MAX phases are predominantly confined to the basal plane[7-9]. In addition to the basal plane dislocations, less common out-of-basal-plane dislocations have only been reported in nanoindented
To stimulate the wide application of MAX materials, it is essential to study their mechanical behavior systematically. Previously, high-pressure experiments have been carried out on many different MAX phases and their high-pressure behaviors have been investigated through both experiments and theoretical calculations[13-18]. While most studies focused on the structure change with pressure and the equation of state, the strength and plastic deformation behavior of MAX phases under high pressure have still rarely been characterized. By using first principle calculation, Zhao et al. studied the mechanical and thermodynamic properties of Ti3AlC2 and Ti3SiC2 under high pressure and high temperature[19]. Results showed that pressure could not only enhance the resistance to deformation but also improve the ductility and elastic anisotropy. However, relevant experimental investigations remain quite insufficient. Here, with the radial X-ray diffraction technique in a diamond anvil cell (rDAC-XRD), we investigate the strength and deformation behavior of a typical MAX phase, Ti3AlC2, in situ under high pressure up to 41 GPa. Both density function theory (DFT) calculations[20,21] and coherent inelastic neutron scattering experiments on
MATERIALS AND METHODS
High-pressure deformation and in situ X-ray diffraction
Ti3AlC2 powder samples were synthesized via the hot-pressing process. In situ rDAC-XRD experiments on the powder sample were performed at beamline 12.2.2 at Advanced Light Source, Lawrence Berkeley National Laboratory. A panoramic-type diamond anvil cell with large openings was used to enable radial X-ray diffraction. The ground sample with grain sizes of around a few microns was loaded into an X-ray-transparent boron-epoxy gasket featuring a centrally drilled hole and inserted into a Kapton support[30]. A piece of Cu foil was also loaded into the sample hole to use as a pressure marker. To maximize the deviatoric stress on the sample, no pressure medium was used. Monochromatic X-rays with a wavelength of 0.5651 Å were collimated to a beam size of 30 μm × 30 μm and focused onto the sample. Instrument parameters, such as the sample-to-detector distance, beam center, and detector tilt, were calibrated using a CeO2 standard prior to the experiment. The pressure was determined based on the equation of state of Cu. The experiment was carried out at room temperature.
Data processing
Using the Rietveld refinement implemented in the software program package MAUD[31,32], diffraction data were quantitatively analyzed for cell parameters, phase proportions, textures, grain sizes, stress, and microstrains. Crystal size and microstrain (root mean square microstrain, the average lattice distortion due to plastic strain in a crystal) were calculated assuming an isotropic grain size. A Vogit function was used to fit the diffraction peaks and the microstrain was calculated using the width of the Gaussian component[33]. Crystallographic textures were fitted using the E-WIMW algorithm[34], with an orientation distribution function (ODF) resolution of 15° and assuming cylindrical symmetry about the compression direction. The ODF was subsequently smoothed with a 7.5° Gauss filter in BEARTEX. Finally, inverse pole figures (IPFs) that show the relationship between the crystallographic directions of crystallites and the compression direction were generated. Due to the hexagonal crystal symmetry, a 30° partial IPF is sufficient to represent the ODF.
According to the lattice strain theory developed by Singh et al.[35], the stress state in a polycrystalline sample under uniaxial compression in the diamond anvil cell can be described by a maximum stress along the cell loading axis, σ3, and a minimum stress in the radial direction, σ1. The difference between σ3 and σ1 is termed the differential stress t, t = σ3 - σ1. The orientation-dependent lattice strain can be fitted with[35]
where dm(hkl, ) is the measured d-spacing, dp(hkl) is the hydrostatic d-spacing, ψ is the angle between the diffraction plane normal and the loading axis, and Q(hkl) is the lattice strain parameter, which is given by[35]
where t is the differential stress, GR(hkl) and GV are the shear moduli of the aggregate under Reuss (isostress) and Voigt (isostrain) approximations, respectively, and α is a value between 0 and 1 describing the continuity behavior of the polycrystalline materials.
According to Equation 1, there should be a linear relationship between dm(hkl) and (1 - 3cos2ψ), while the d-spacing at (1 - 3cos2ψ) = 0, namely = 54.7°, equals to dp(hkl). dp(hkl)/ Q(hkl) is the slope in the dm(hkl) versus (1 - 3cos2ψ) graph.
According to Equation 2, if we assume the isostress condition, we have t/G = 6<Q(hkl)>, where <Q(hkl)> represents the average lattice strain Q(hkl) of observed reflections, and G is the aggregate shear modulus of the polycrystalline sample. The t/G ratio can be extracted from the diffraction data during fitting with MAUD using the Triaxial Stress Isotropic E strain model, which can refine a first value of differential stress t using the Young’s modulus E and Poisson ratios ν of Ti3AlC2 at ambient conditions (t/G = 2t(1+ν)/E). However, for anisotropic materials like Ti3AlC2, the stress on each diffraction plane is supposed to be different. Hence, t(hkl) and Q(hkl) for each plane have been calculated based on its own dm(hkl) vs. (1 - 3cos2ψ) relation. If the uniaxial stress component t has reached its limiting value of yield strength at high pressures, it will reflect the ratio of yield strength to shear modulus.
RESULTS AND DISCUSSION
Phase stability under nonhydrostatic pressure
The sample was first checked at ambient conditions via XRD. All peaks can be indexed to the hexagonal Ti3AlC2 phase (P63/mmc), indicating a pure phase [Figure 1A]. The inset crystal structure and scanning electron microscope (SEM) image clearly display the layered nature of the material. High-pressure XRD was conducted in the radial geometry up to 41 GPa, while diffraction images were collected during both compression and decompression. Figure 1B shows diffraction images collected at 0.1 and 41 GPa, respectively. Under pressure, the diffraction ring became distorted from a perfect circle and intensity variation could also be observed for each ring, providing deformation information about the sample under uniaxial compression. This information can be better seen from the unrolled diffraction patterns [Figure 2]. The variation of diffraction angle with azimuth angle represents the lattice strain of the sample and was caused by the shear stress generated under the nonhydrostatic environment. The systematic intensity variations on each pattern represent the lattice preferred orientation of the sample. The sample was pressed into thin dense foils before being put into the gasket chamber, which helped obtain a better diffraction signal. This is also the origin of the slight initial texture at 0.1 GPa. With the increase in pressure, both lattice strain and lattice preferred orientation are enhanced, as indicated by the curved shape and the intensity variation of the pattern. No new peak appeared until 41 GPa [Figure 2A-D], indicating no phase transition during this pressure range.
Figure 1. XRD patterns of Ti3AlC2. (A) Integrated pattern at ambient conditions. The inset shows the morphology and crystal structure of Ti3AlC2. A distinct layered structure can be observed in the SEM image. Scale bar = 5 μm. (B) Two-dimensional diffraction images collected under pressure. XRD: X-ray diffraction; SEM: scanning electron microscope.
Figure 2. Unrolled diffraction patterns as a function of 2θ for the whole azimuthal range under pressure. Patterns collected during compression at 0.1 GPa (A); 4.9 GPa (B); 21.6 GPa (C); and 41 GPa (D). Patterns collected during decompression at 15.6 GPa (E) and 0.1 GPa (F). Arrows on the right show the compression direction. Major diffraction peaks are labeled.
Based on previous high-pressure experiments of many MAX phases, no phase transition has been observed under hydrostatic pressure in the pressure range that has been experimentally reached so far [13-17]. Theoretical simulation predicts that a large shear strain would induce the α-to-β transition in Ti3SiC2[36]. These two polymorphs have been observed by transmission electron microscopy (TEM), X-ray and neutron diffraction[37,38]. Both of them are in the same space group. The difference is that the Si atom in the α phase occupies the 2b Wyckoff position with fractional coordinates (0, 0, 1/4), while the β phase has the Si atom filling the 2d Wyckoff position with fractional coordinates (2/3, 1/3, 1/4). However, no experimental evidence has been reported yet to prove that this phase transition could occur in this compound under high pressure.
Wang et al. claimed that Ti3GeC2 underwent the α-to-β transition under nonhydrostatic pressure of 26.6 GPa[39]. However, it should be mentioned that for both structural polymorphs, all XRD peak positions are the same and the only difference is the peak intensity variation. It is well known that the peak intensity under nonhydrostatic pressure will be affected by lattice preferred orientation induced by the differential stress. Consequently, the peak intensity variation in this case cannot be directly attributed to the phase transition and further evidence is needed to identify the α-to-β transition. In our work, it can be clearly seen from Figure 1B that there is no obvious change except the development of texture and lattice strain during compression. Based on our experiment, no indication of phase transition can be found in Ti3AlC2 up to 41 GPa nonhydrostatic pressure [Figure 2].
During decompression, the lattice strain was released and all peak lines became almost straight when the pressure was back to 0.1 GPa [Figure 2E and F]. On the contrary, the strong texture was retained in the quenched sample.
Microstructure evolution under pressure
The diffraction patterns were fitted using the software MAUD. One fitting example at the highest pressure of 41 GPa is shown in Figure 3. It can be seen that the data could be fitted very well. Based on the fitting, lattice parameters and volume change were first obtained, and the results are shown in Figure 4.
Figure 3. Fitting example of Ti3AlC2 at 41 GPa. The lower portion of the pattern shows the experimental data, while the upper portion displays the calculated pattern obtained from the Rietveld refinement. Green arrows indicate the compression direction.
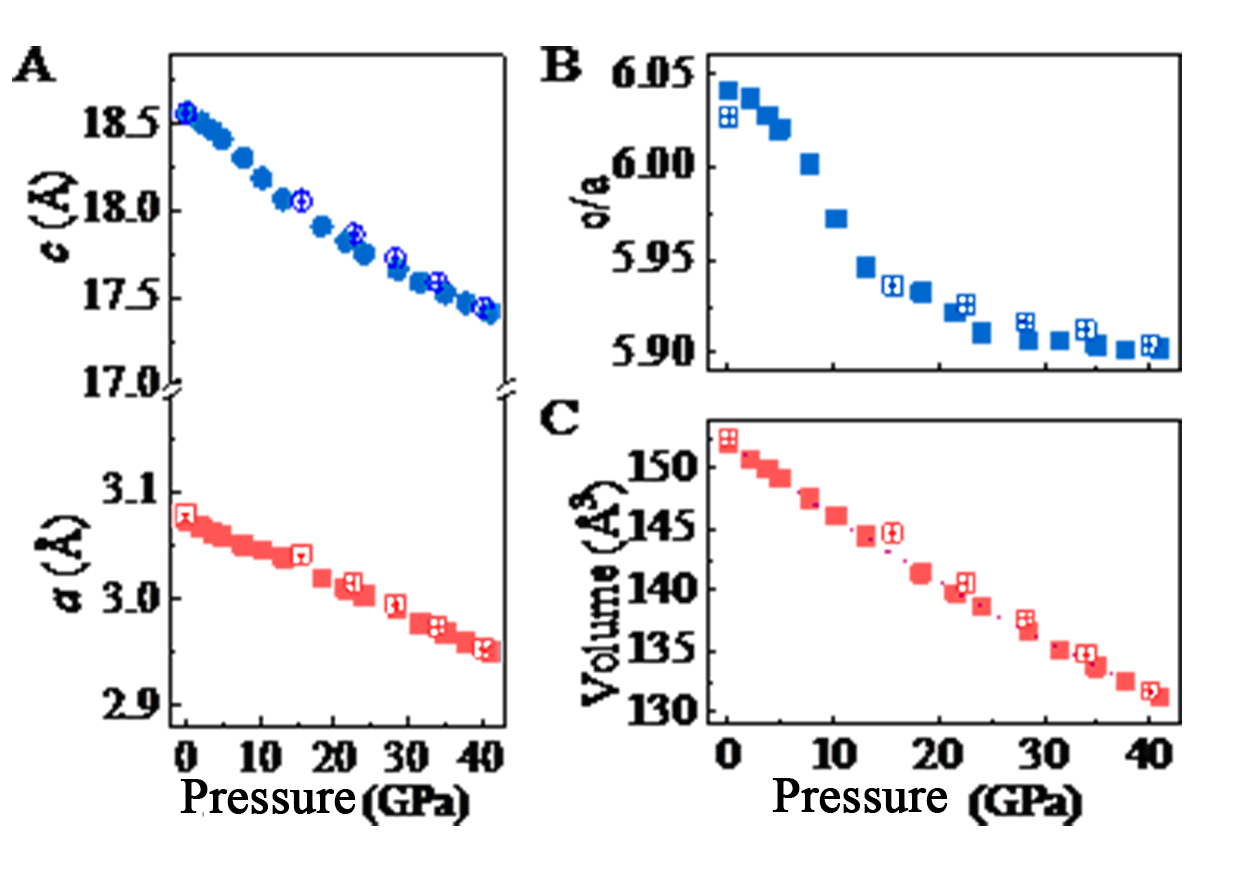
Figure 4. Structure evolution of Ti3AlC2 as a function of pressure. (A) Lattice parameters; (B) c/a ratio; (C) Unit-cell volume. In all figures, solid symbols display values obtained during the compression process and hollow symbols represent values obtained from the decompression process. The dashed line in (C) is the Birch-Murnaghan EOS fitting. The error bars, when not shown, are inside the symbol. EOS: Equation of state.
The lattice constant for Ti3AlC2 at ambient conditions was fitted to be: a = 3.0737(3) Å, c = 18.5673 (6) Å. Both of them decrease with pressure, while a shows a linear decreasing trend and c decreases nonlinearly [Figure 4A]. The ratio of c/a has also been plotted as a function of pressure [Figure 4B]. The c axis is significantly more compressible than the a axis. This is easy to understand due to its layered structure. With the increase in pressure, the c/a ratio drops dramatically before 20 GPa, indicating the strong compressibility anisotropy of this material. Above this pressure point, the decreasing trend is slowed down and the ratio eventually becomes stable with pressure. Li et al. have also observed an anomaly of the c/a ratio under hydrostatic pressure and claimed it as an isostructural phase transition[18]. However, the volume change is always continuous under both hydrostatic and nonhydrostatic compression. Based on our results, the shift in the c/a ratio is more likely related to the deformation behavior under extreme compression.
The unit-cell volume as a function of pressure is shown in Figure 4C and it is fitted using the Birch-Murnaghan equation of state (EOS). The zero-pressure bulk modulus K0 = 202 ± 5 GPa is obtained with the pressure derivative K0’ fixed to 4. This value is higher than 156 ± 5 GPa and 166.7 ± 1 GPa (K0’ = 4) obtained under hydrostatic pressure by Zhang et al.[14] and Li et al.[18], respectively. However, it is lower than the value of 226 ± 3 GPa (K0’ ≈ 4) measured for Ti3(Al, Sn0.2)C2, which has the same lattice constant of Ti3AlC2 with Al as pressure medium[16]. Our results agree well with ab initio calculation values of 190 GPa[40] and 187 GPa[41]. It has been previously reported that the nonhydrostaticity in a diamond anvil cell has a profound effect on the calculated bulk modulus[42], which could explain the difference between our result and that obtained from hydrostatic conditions. For all parameters, the data obtained during the decompression process are also shown in the figure as hollow symbols. Basically, they follow the opposite trend to that during compression.
Crystal size and the microstrain can also be obtained from the refinement and have been plotted as a function of pressure in Figure 5. Crystal size decreased significantly with pressure at the initial stage and then stayed relatively stable above 20 GPa. This is due to the differential stress generated under uniaxial compression, which breaks original large grains into smaller grains. On the contrary, the microstrain initially increased rapidly with pressure to around 0.006 and then kept this value during further compression. The rapid linear increase occurs when the sample is in the elastic range before the bulk yield, while the deviation from this linear variation marks the onset of plastic deformation, indicating that the bulk material can no longer support further differential or shear stress in an elastic sense.
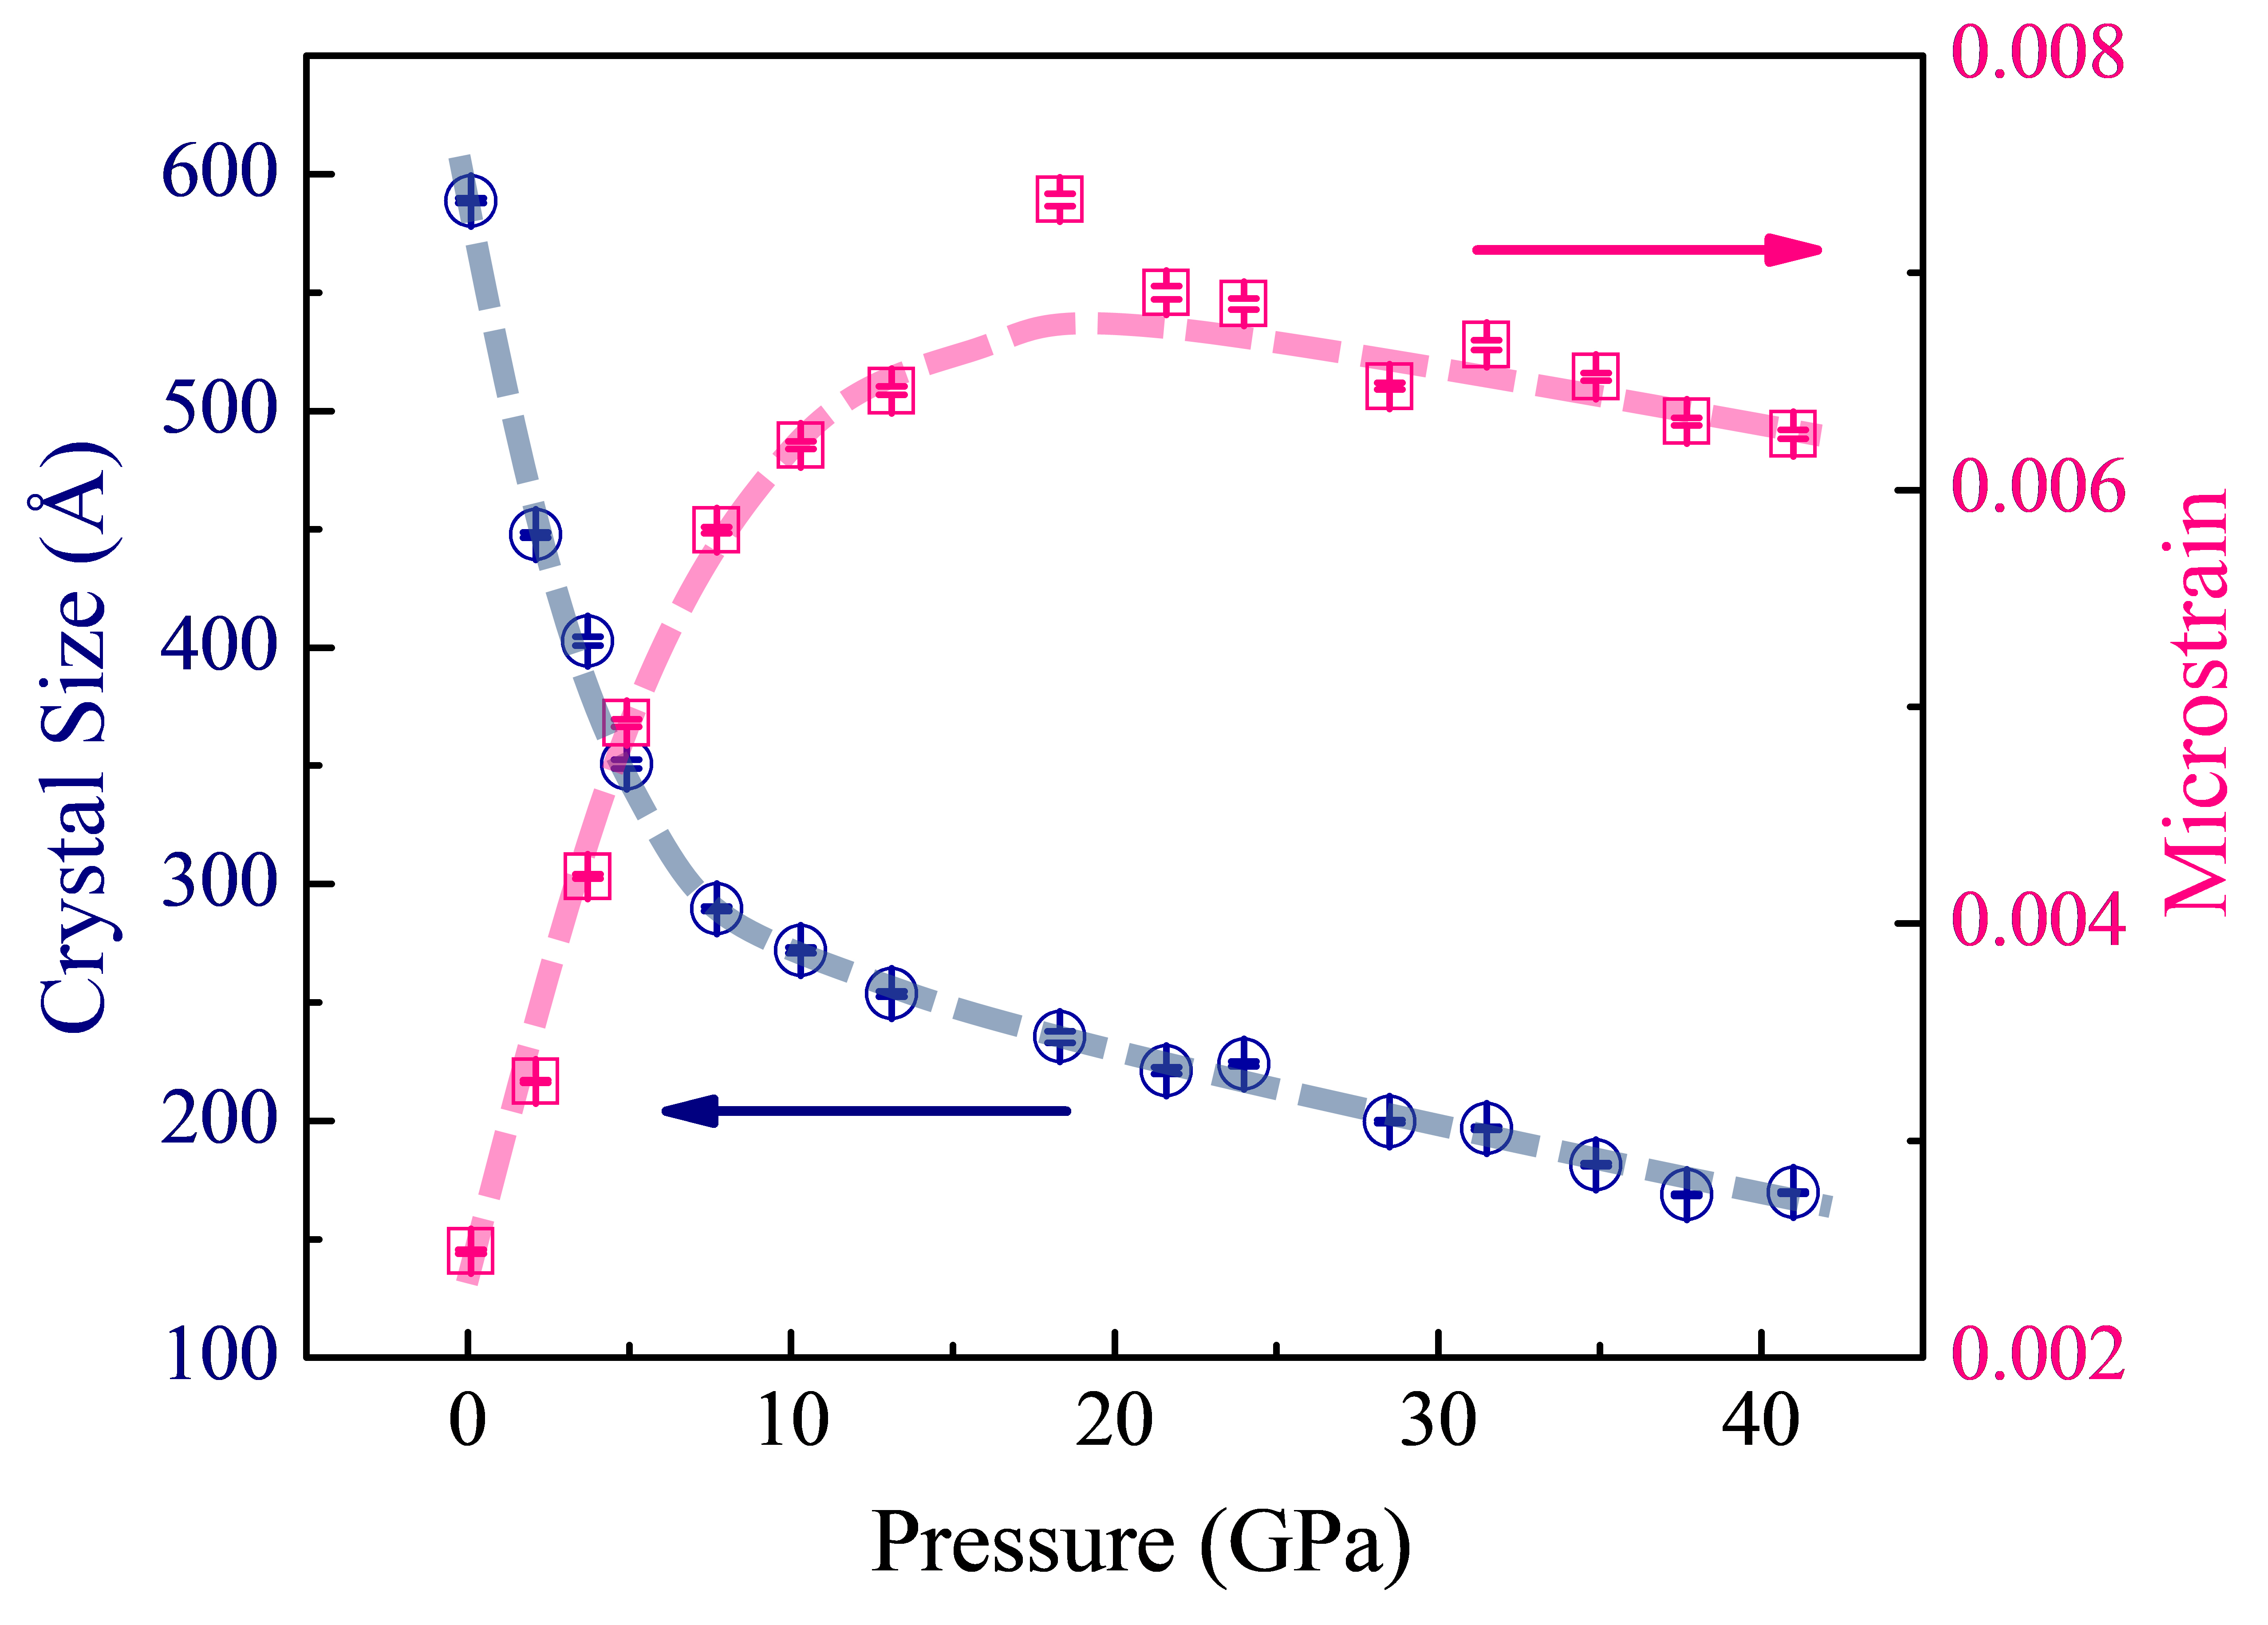
Figure 5. Crystal size and microstrain as a function of pressure.
Lattice strain anisotropy
Figure 6 shows the variation of the d-spacing as a function of 1 - 3cos2ψ for some representative reflections of Ti3AlC2 at the lowest and highest pressure. The information on the differential stress supported by each plane and the shear modulus are all provided by the slope of each line. As indicated by the theory, the measured d-spacing varies linearly with 1 - 3cos2ψ and the slope increases with pressure. At 0.1 GPa, all three lines are flat and the slope is nearly 0. At 41 GPa, a strong anisotropy can be observed from the figure, with (10-10) displaying the highest slope and (0008) showing the lowest.
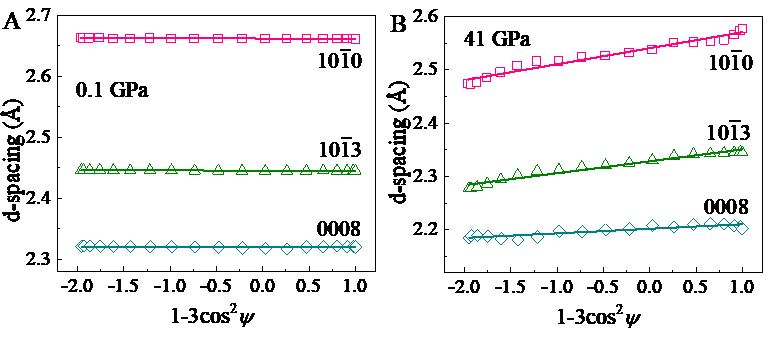
Figure 6. Dependence of measured d-spacing on 1 - 3cos2ψ. (A) 0.1 GPa, (B) 41 GPa. Data are shown for three diffraction planes of Ti3AlC2: (10-10), (10-13), and (0008). The solid lines represent linear fits to the experimental data. At 41 GPa, (10-10) shows the highest slope while (0008) shows the lowest.
The t(hkl)/G(hkl) ratios obtained from plotting the slope of d-spacing vs. 1 - 3cos2ψ reflect the elastically supported differential strain in the lattice planes under an imposed differential stress. The values as a function of pressure for six representative planes are shown in Figure 7A. The average t/G value calculated from t/G = 2t(1 + ν)/E has also been shown in the figure. In all cases, the t(hkl)/G(hkl) increases with pressure before reaching a plateau of around 0.015 for (0008) planes and 0.05 ~ 0.07 for (10-1l) planes, respectively, indicating a high lattice strain anisotropy. The average t/G follows the same trend and shows weak pressure dependence above ~ 20 GPa. It also means that Ti3AlC2 starts to yield to plastic deformation at this pressure point.
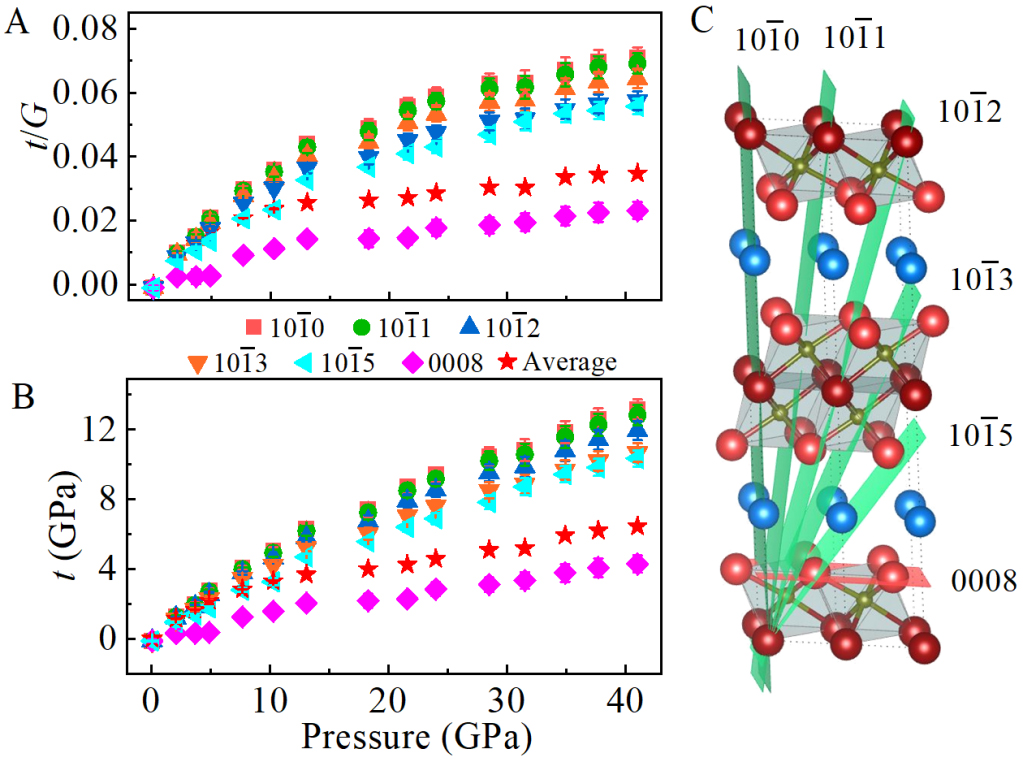
Figure 7. Differential strain / stress as a function of pressure. Both average values and specific values for selective plans are shown. (A) Differential strain [t(hkl)/G(hkl)]; (B) Differential stress; and (C) The relative orientation of the six lattice planes in Ti3AlC2 used in this work.
It should be mentioned that for the (0008) plane, another plateau could be observed at a pressure of ~ 2 GPa, indicating a premature yield of grains with [0008] parallel with the compression direction. This is similar to that observed in Ti2AlN particle reinforced TiAl, in which the (0002) planes of Ti2AlN show yielding or even plastic deformation at a very low true stress level[43]. It is proposed that this could be attributed to the atomic ripplocations, a unique phenomenon for layered crystalline solids in response to compressive strain[44,45]. Under compression, deformation will occur through atomic-scale ripples on the (000l) substrate planes and then induce stress release. Consequently, the lattice strain of the (0008) plane would exhibit a yielding behavior under very low pressure (stress).
Differential stress
To estimate the differential stress supported by Ti3AlC2 at elevated pressures, the ambient shear modulus 140.2 GPa and its evolution with pressure (dG/dP = 1.3 GPa) for Ti3AlC2 from the theoretical calculation is used here[19]. The maximum differential stress corresponds to the yield strength of the material.
Figure 7B shows differential stress as a function of pressure for the six studied lattice planes. Clearly, the differential stress increases with pressure. As seen in the figure, the (10-10) plane is the stiffest plane and is able to support the highest differential stress of 13.7 GP at the highest measured pressure. In contrast, the (0008) plane can support a much lower differential stress of 4.5 GPa at the same pressure point. This anisotropy in the differential stress supported by each plane is likely due to the layered crystal structure of Ti3AlC2. The (0008) plane is orthogonal to the c axis and lies parallel to the layers of Ti, Al, and C [Figure 7C]. It is well accepted that there are only limited slip systems that can be activated in MAX materials, and only the basal plane is operative under high temperatures[6]. It is possible that the basal plane is also the slip plane under high nonhydrostatic pressure, which makes it a location for strain release in the material. IPFs in Figure 8A show clearly that Ti3AlC2 develops a strong (0001) texture under nonhydrostatic pressure and the preferred orientation increases with pressure until reaching 6 mrd at 41 GPa. This texture is similar to that observed in hexagonal metals such as zinc and cadmium and is suggested to be due to basal slip[46]. This result is also consistent with dislocations observed in Ti3AlC2 under high-temperature uniaxial compression[12]. Pole figures (PFs) of selective planes at the highest pressure are also shown in Figure 8B. For (0001), one maximum can be observed at the center, indicating that {0001} planes are aligned perpendicular to the compression plane. For (10-10) and (10-11), only one weak maximum can be observed at the edge of the pole figure, that is, at η = 90°, which means that these two sets of planes are along the compression direction. Hence, it is obvious that (000l) planes support the lowest differential stress while the (10-10) plane, which is perpendicular to basal planes, is able to support the highest differential stress. As expected, differential stress supported by other planes shown in the figure lies between those values of (10-10) and (0008), and decreases monotonously with the ratio between its components perpendicular and parallel to the c axis.
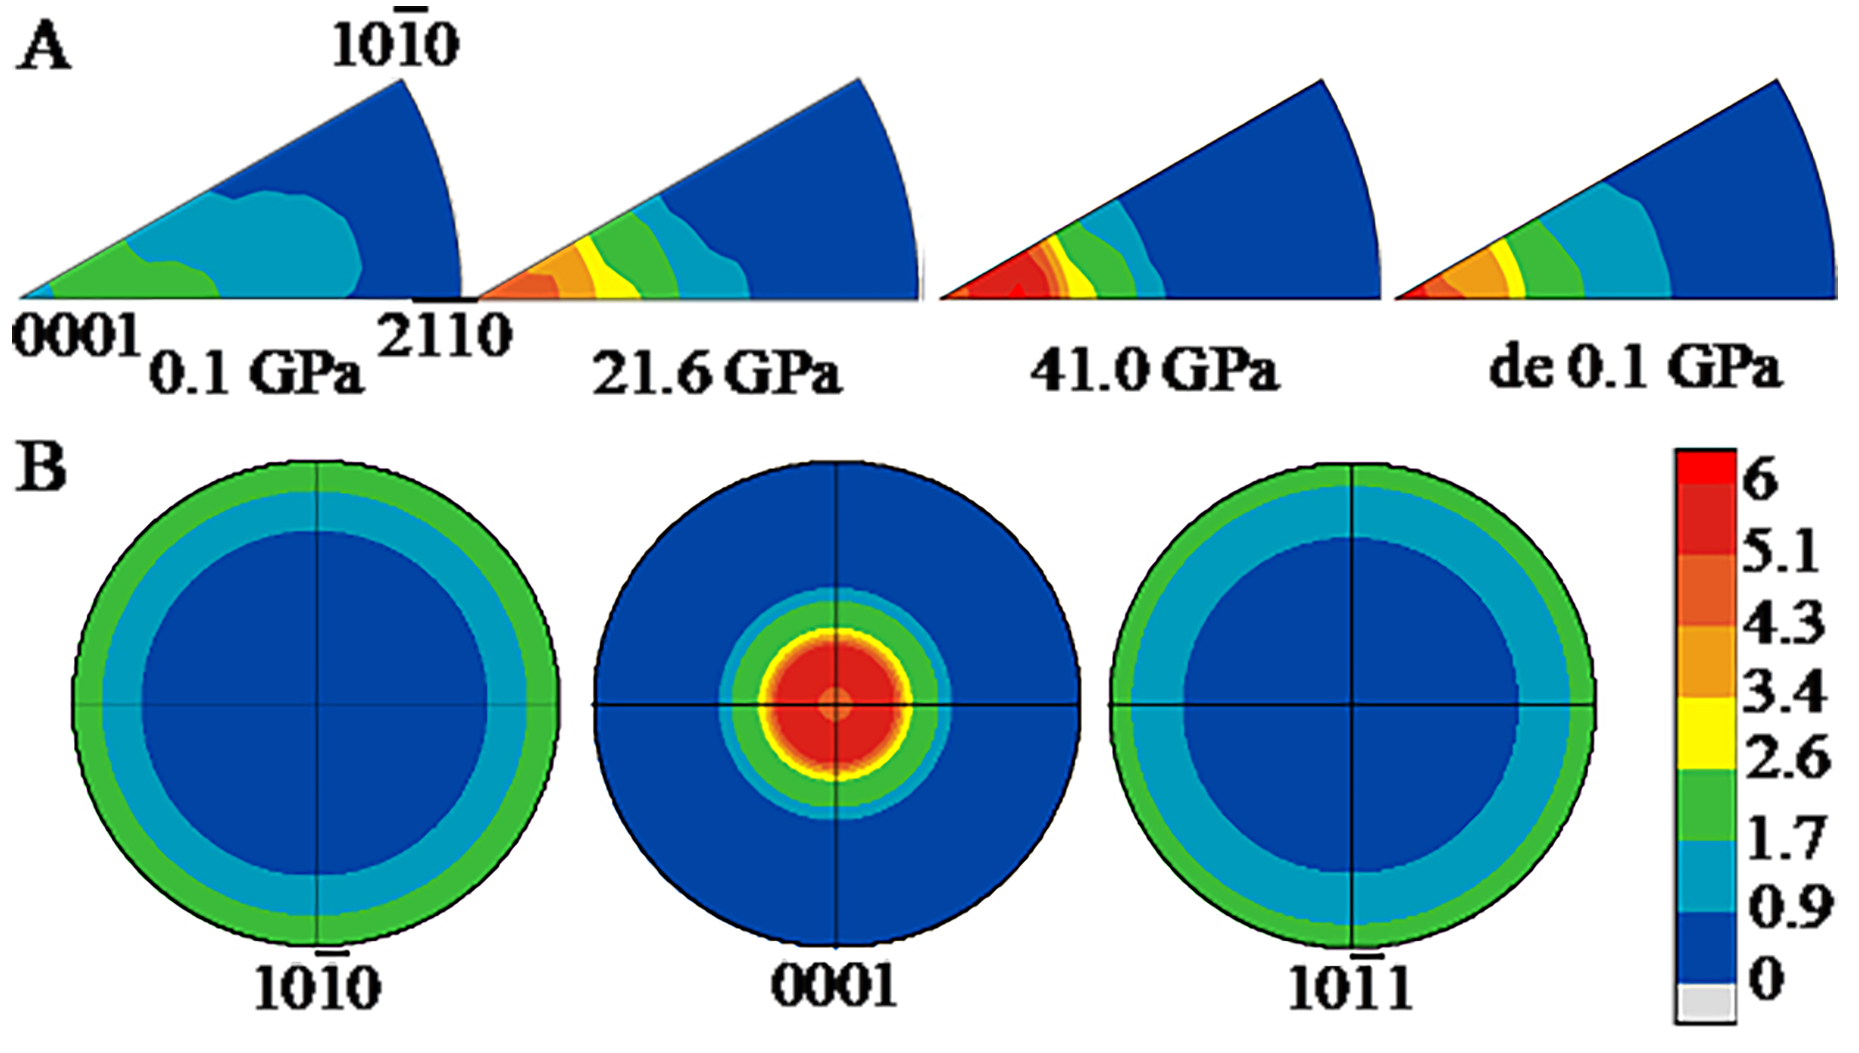
Figure 8. Texture evolution under high pressure. (A) IPFs of the compression direction showing the texture evolution of Ti3AlC2 under high pressure up to 41 GPa. For each case, the experimental pressure values are shown in the figure; (B) Selective PFs at 41 GPa. The compression direction is at the center of the PFs. Pole densities are measured in MRD. Equal area projections. IPF: inverse pole figure; PF: pole figure; MRD: multiples of a random distribution.
A similar stress anisotropy effect has been reported in ReB2 in radial geometry high-pressure experiments by Chung et al.[47]. They anticipated and observed this effect in hardness measurements: under the same load, indentations along the direction with a larger component parallel to the c axis resulted in a higher average hardness as compared with the value obtained with indentations parallel with (00l) planes[47]. Similarly, researchers have also reported that the hardness of Ti3SiC2 was anisotropic and higher when loaded along the c direction: the hardness was 4.9 ± 0.2 GPa with basal plane oriented perpendicular to the surface and increased to 7.3 ± 0.1 GPa with basal plane parallel with the surface[48].
The average differential stress obtained for Ti3AlC2 increased to about 4.5 GPa at ~ 20 GPa, the plastic yield point, and then became relatively stable and slightly increased to about 6.5 GPa at the highest pressure 41 GPa. The differential stress of this material is much higher than that measured for metals like Au (~ 0.7 GPa)[49], Gd (~ 0.45 GPa)[50], Fe (~ 4.5 GPa)[51], and W (~ 4.8 GPa)[52], and is comparable with that of Re (~ 6.2 GPa)[49] at a similar pressure range. This value is also higher than that obtained for stishovite (~ 4.5 GPa)[53], one of the strongest known oxides. However, this differential stress is still lower than values measured for superhard ceramic materials like ReB2 (~ 7.2 GPa)[42], TiN (~ 8 GPa)[54] and significantly lower than that of B4C (~ 12 GPa)[55], WB4 (~ 15.8 GPa)[42], nanocrystalline γ-Si3N4 (~ 17 GPa)[56], and microcrystalline B6O (~ 20 GPa)[57] in the measured pressure range.
Previously, the plastic deformation of MAX phases was investigated through experiments and simulations. However, the understanding of this topic remains limited and contradictory. Micropillar compression on Ti3SiC2 single crystals at room temperature reveals that the basal slip is the only operative slip[58]. When the loading axis is parallel to the basal plane, kink band formation also originates from the basal dislocations. Recently, it has been postulated that ripplocations, rather than dislocations, are responsible for the formation of kink boundaries commonly observed in deformed MAX phases[59]. However, it was later argued that ripplocations are not energetically viable in MAX phases, attributing to elastic isotropy, substantial interlayer friction, and adhesion[45]. Using molecular dynamics simulations of the Ti3SiC2 MAX phase, pyramidal dislocation loops were discovered to be the operating mechanism of kinking under load parallel to the layers[60]. In our work, the texture intensity increases with pressure, indicating a rise in dislocation density under extreme compression. Compared with previous work, we believe that basal slip is operative and is responsible for the alignment of the {0001} planes perpendicular to the compression plane. Since the initial sample is a powder with grains of random orientation, kinking might also occur during compression in specific grains with basal planes parallel with the load direction. However, further experiments are still needed to confirm this.
CONCLUSIONS
In conclusion, the strength and plastic deformation of a typical MAX phase Ti3AlC2 have been studied in situ using radial XRD in a diamond anvil cell at pressures up to 41 GPa. The strength presents a strong anisotropic behavior and the (10-10) plane supports the largest differential stress. This agrees well with the 0001 texture developed under nonhydrostatic pressure by basal plane slip. The result also shows that the average strength of Ti3AlC2 is higher than that of most metals and even higher than stishovite, one of the strongest oxides. This work provides a clear physical figure on the mechanical properties of MAX phases, which is crucial for material engineering and technological application.
DECLARATIONS
Acknowledgments
The authors acknowledge the support of the Advanced Light Source.
Authors’ contributions
Design: Yue, B.; Hong, F;
Experiments and data collection: Yue, B.; Hong, F.; Li, S.
Data analysis, manuscript writing: Yue, B.; Hong, F.
Manuscript revision: Yue, B.; Hong, F.; Cheng, Z.
All authors have read and agreed to the published version of the manuscript.
Availability of data and materials
The data that support the findings of this study are available from the corresponding author upon reasonable request.
Financial support and sponsorship
This work was supported by the National Natural Science Foundation of China (Grants No. 12004014, No. U1930401), and the Major Program of the National Natural Science Foundation of China (Grants No. 22090041).
Conflicts of interest
All authors declared that there are no conflicts of interest.
Ethical approval and consent to participate
Not applicable.
Consent for publication
Not applicable.
Copyright
© The Author(s) 2026.
REFERENCES
1. Barsoum, M. W.; Radovic, M. Elastic and mechanical properties of the MAX phases. Annu. Rev. Mater. Res. 2011, 41, 195-227.
2. Sun, Z. M. Progress in research and development on MAX phases: a family of layered ternary compounds. Int. Mater. Rev. 2011, 56, 143-66.
3. Barsoum, M. W. The Mn+1AXn phases: a new class of solids. Prog. Solid. State. Chem. 2000, 28, 201-81.
4. Alam, M. S.; Chowdhury, M. A.; Khandaker, T.; et al. Advancements in MAX phase materials: structure, properties, and novel applications. RSC. Adv. 2024, 14, 26995-7041.
5. Bao, Y.; Wang, X.; Zhang, H.; Zhou, Y. Thermal shock behavior of Ti3AlC2 from between 200 °C and 1,300 °C. J. Eur. Ceram. Soc. 2005, 25, 3367-74.
6. Barsoum, M. W.; Zhen, T.; Kalidindi, S. R.; Radovic, M.; Murugaiah, A. Fully reversible, dislocation-based compressive deformation of Ti3SiC2 to 1 GPa. Nat. Mater. 2003, 2, 107-11.
7. Zhen, T.; Barsoum, M.; Kalidindi, S. Effects of temperature, strain rate and grain size on the compressive properties of Ti3SiC2. Acta. Materialia. 2005, 53, 4163-71.
8. Guitton, A.; Joulain, A.; Thilly, L.; Tromas, C. Dislocation analysis of Ti2AlN deformed at room temperature under confining pressure. Philos. Mag. 2012, 92, 4536-46.
9. Jones, N.; Humphrey, C.; Connor, L.; et al. On the relevance of kinking to reversible hysteresis in MAX phases. Acta. Materialia. 2014, 69, 149-61.
10. Tromas, C.; Villechaise, P.; Gauthier-brunet, V.; Dubois, S. Slip line analysis around nanoindentation imprints in Ti3SnC2: a new insight into plasticity of MAX-phase materials. Philos. Mag. 2011, 91, 1265-75.
11. Guitton, A.; Joulain, A.; Thilly, L.; Tromas, C. Evidence of dislocation cross-slip in MAX phase deformed at high temperature. Sci. Rep. 2014, 4, 6358.
12. Zhang, H.; Wang, X.; Wan, P.; Zhan, X.; Zhou, Y.; Mitchell, T. Insights into high-temperature uniaxial compression deformation behavior of Ti3AlC2. J. Am. Ceram. Soc. 2015, 98, 3332-7.
13. Manoun, B.; Saxena, S. K.; Barsoum, M. W. High pressure study of Ti4AlN3 to 55 GPa. Appl. Phys. Lett. 2005, 86, 101906.
14. Zhang, H.; Wu, X.; Nickel, K. G.; Chen, J.; Presser, V. High-pressure powder X-ray diffraction experiments and ab initio calculation of Ti3AlC2. J. Appl. Phys. 2009, 106, 013519.
15. Manoun, B.; Saxena, S. K.; El-raghy, T.; Barsoum, M. W. High-pressure X-ray diffraction study of Ta4AlC3. Appl. Phys. Lett. 2006, 88, 201902.
16. Manoun, B.; Saxena, S. K.; Hug, G.; Ganguly, A.; Hoffman, E. N.; Barsoum, M. W. Synthesis and compressibility of Ti3(Al,Sn0.2)C2 and Ti3Al(C0.5,N0.5)2. J. Appl. Phys. 2007, 101, 113523.
17. Onodera, A.; Hirano, H.; Yuasa, T.; Gao, N. F.; Miyamoto, Y. Static compression of Ti3SiC2 to 61 GPa. Appl. Phys. Lett. 1999, 74, 3782-4.
18. Li, Y.; Ye, M.; Tang, R.; et al. Pressure-induced isostructural phase transition in Ti3AlC2: experimental and theoretical investigation. Phys. Chem. Chem. Phys. 2020, 22, 13136-42.
19. Zhao, Y.; Deng, S.; Liu, H.; Zhang, J.; Guo, Z.; Hou, H. First-principle investigation of pressure and temperature influence on structural, mechanical and thermodynamic properties of Ti3AC2 (A = Al and Si). Comput. Mater. Sci. 2018, 154, 365-70.
20. He, X.; Bai, Y.; Zhu, C.; Sun, Y.; Li, M.; Barsoum, M. General trends in the structural, electronic and elastic properties of the M3AlC2 phases (M = transition metal): a first-principle study. Comput. Mater. Sci. 2010, 49, 691-8.
21. Veronica, Gray.; Gordon, J. Kearley.; Oliver, Kirstein.; et al. Mn+1AXn phonon density of states: Ti3AlC2 and Ti3SiC2 simulation and experimentation results. JCCE 2015, 9, 253-61.
22. Gray, V.; Kisi, E. H.; Kirstein, O.; Stampfl, A. P. J. Elastic constants of polycrystalline Ti3AlC2 and Ti3SiC2 measured using coherent inelastic neutron scattering. J. Am. Ceram. Soc. 2017, 100, 705-12.
23. Merkel, S.; McNamara, A. K.; Kubo, A.; et al. Deformation of (Mg,Fe)SiO3 post-perovskite and D” anisotropy. Science 2007, 316, 1729-32.
24. Marquardt, H.; Miyagi, L. Slab stagnation in the shallow lower mantle linked to an increase in mantle viscosity. Nature. Geosci. 2015, 8, 311-4.
25. Miyagi, L.; Kanitpanyacharoen, W.; Kaercher, P.; Lee, K. K.; Wenk, H. R. Slip systems in MgSiO3 post-perovskite: implications for D” anisotropy. Science 2010, 329, 1639-41.
26. Yue, B.; Hong, F.; Merkel, S.; et al. Deformation behavior across the Zircon-Scheelite phase transition. Phys. Rev. Lett. 2016, 117, 135701.
27. Yue, B.; Dai, W.; Zhang, X.; et al. Deformation behavior of high-entropy oxide (Mg,Co,Ni,Cu,Zn)O under extreme compression. Scripta. Materialia. 2022, 219, 114879.
28. Yue, B.; Hong, F.; Hirao, N.; et al. A simple variant selection in stress-driven martensitic transformation. Proc. Natl. Acad. Sci. U. S. A. 2019, 116, 14905-9.
29. Zhou, J.; Peng, F.; Hong, F.; Yue, B. Dislocation-mediated ultrahigh mechanical properties in nano-TiN. Phys. Rev. Mater. 2024, 8, 036001.
30. Merkel, S.; Yagi, T. X-ray transparent gasket for diamond anvil cell high pressure experiments. Rev. Sci. Instrum. 2005, 76, 046109.
31. Lutterotti, L.; Vasin, R.; Wenk, H. Rietveld texture analysis from synchrotron diffraction images. I. Calibration and basic analysis. Powder. Diffr. 2014, 29, 76-84.
32. Wenk, H.; Lutterotti, L.; Kaercher, P.; Kanitpanyacharoen, W.; Miyagi, L.; Vasin, R. Rietveld texture analysis from synchrotron diffraction images. II. Complex multiphase materials and diamond anvil cell experiments. Powder. Diffr. 2014, 29, 220-32.
33. Lutterotti, L.; Scardi, P. Simultaneous structure and size-strain refinement by the Rietveld method. J. Appl. Crystallogr. 1990, 23, 246-52.
34. Matthies, S.; Vinel, G. W. On the reproduction of the orientation distribution function of texturized samples from reduced pole figures using the conception of a conditional ghost correction. Physica. Status. Solidi. (b). 1982, 112, K111-4.
35. Singh, A. K.; Balasingh, C.; Mao, H.; Hemley, R. J.; Shu, J. Analysis of lattice strains measured under nonhydrostatic pressure. J. Appl. Phys. 1998, 83, 7567-75.
36. Wang, J.; Zhou, Y. Polymorphism of Ti3SiC2 ceramic: first-principles investigations. Phys. Rev. B. 2004, 69, 144108.
37. Farber, L.; Levin, I.; Barsoum, M. W.; El-raghy, T.; Tzenov, T. High-resolution transmission electron microscopy of some Tin+1AXn compounds (n = 1, 2; A = Al or Si; X = C or N). J. Appl. Phys. 1999, 86, 2540-3.
38. Yu, R.; Zhan, Q.; He, L. L.; Zhou, Y. C.; Ye, H. Q. Polymorphism of Ti3SiC2. J. Mater. Res. 2002, 17, 948-50.
39. Wang, Z.; Zha, C. S.; Barsoum, M. W. Compressibility and pressure-induced phase transformation of Ti3GeC2. Appl. Phys. Lett. 2004, 85, 3453-5.
40. Zhou, Y. C.; Wang, X. H.; Sun, Z. M.; Chen, S. Q. Electronic and structural properties of the layered ternary carbide Ti3AlC2. J. Mater. Chem. , 11, 2335-9.
41. Wang, J. Y.; Zhou, Y. C. First-principles study of equilibrium properties and electronic structure of Ti3Si0.75Al0.25C2 solid solution. J. Phys:. Condens. Matter. 2003, 15, 5959-68.
42. Xie, M.; Mohammadi, R.; Turner, C. L.; Kaner, R. B.; Kavner, A.; Tolbert, S. H. Lattice stress states of superhard tungsten tetraboride from radial X-ray diffraction under nonhydrostatic compression. Phys. Rev. B. 2014, 90, 104104.
43. Li, J.; Hu, R.; Zhou, M.; Gao, Z.; Wu, Y.; Luo, X. High temperature micromechanical behavior of Ti2AlN particle reinforced TiAl based composites investigated by in-situ high-energy X-ray diffraction. Mater. Design. 2021, 212, 110225.
44. Barsoum, M.; Tucker, G. Deformation of layered solids: ripplocations not basal dislocations. Scripta. Materialia. 2017, 139, 166-72.
45. Gruber, J.; Plummer, G.; Tucker, G. J. Bending the rules: Strain accommodation in layered crystalline solids through nanoscale buckling over dislocations. J. Mech. Phys. Solids. 2024, 182, 105450.
46. Kanitpanyacharoen, W.; Merkel, S.; Miyagi, L.; et al. Significance of mechanical twinning in hexagonal metals at high pressure. Acta. Materialia. 2012, 60, 430-42.
47. Chung, H. Y.; Weinberger, M. B.; Levine, J. B.; et al. Synthesis of ultra-incompressible superhard rhenium diboride at ambient pressure. Science 2007, 316, 436-9.
48. Kooi, B.; Poppen, R.; Carvalho, N.; De, Hosson. J.; Barsoum, M. Ti3SiC2: A damage tolerant ceramic studied with nano-indentations and transmission electron microscopy. Acta. Materialia. 2003, 51, 2859-72.
49. Duffy, T. S.; Shen, G.; Heinz, D. L.; et al. Lattice strains in gold and rhenium under nonhydrostatic compression to 37 GPa. Phys. Rev. B. 1999, 60, 15063-73.
50. Xiong, L.; Liu, J.; Bai, L.; Li, X.; Lin, C.; Lin, J. Strength and structural phase transitions of gadolinium at high pressure from radial X-ray diffraction. J. Appl. Phys. 2014, 116, 243503.
51. Singh, A. K.; Mao, H.; Shu, J.; Hemley, R. J. Estimation of single-crystal elastic moduli from polycrystalline X-ray diffraction at high pressure: application to FeO and iron. Phys. Rev. Lett. 1998, 80, 2157-60.
52. He, D.; Duffy, T. S. X-ray diffraction study of the static strength of tungsten to 69 GPa. Phys. Rev. B. 2006, 73, 134106.
53. Shieh, S. R.; Duffy, T. S.; Li, B. Strength and elasticity of SiO2 across the stishovite-CaCl2-type structural phase boundary. Phys. Rev. Lett. 2002, 89, 255507.
54. Chen, H.; Peng, F.; Mao, H.; et al. Strength and elastic moduli of TiN from radial X-ray diffraction under nonhydrostatic compression up to 45 GPa. J. Appl. Phys. 2010, 107, 113503.
55. Vogler, T. J.; Reinhart, W. D.; Chhabildas, L. C. Dynamic behavior of boron carbide. J. Appl. Phys. 2004, 95, 4173-83.
56. Kiefer, B.; Shieh, S. R.; Duffy, T. S.; Sekine, T. Strength, elasticity, and equation of state of the nanocrystalline cubic silicon nitride γ-Si3N4 to 68 GPa. Phys. Rev. B. 2005, 72, 014102.
57. He, D.; Shieh, S. R.; Duffy, T. S. Strength and equation of state of boron suboxide from radial X-ray diffraction in a diamond cell under nonhydrostatic compression. Phys. Rev. B. 2004, 70, 184121.
58. Higashi, M.; Momono, S.; Kishida, K.; Okamoto, N. L.; Inui, H. Anisotropic plastic deformation of single crystals of the MAX phase compound Ti3SiC2 investigated by micropillar compression. Acta. Materialia. 2018, 161, 161-70.
59. Gruber, J.; Lang, A. C.; Griggs, J.; Taheri, M. L.; Tucker, G. J.; Barsoum, M. W. Evidence for bulk ripplocations in layered solids. Sci. Rep. 2016, 6, 33451.
Cite This Article
How to Cite
Download Citation
Export Citation File:
Type of Import
Tips on Downloading Citation
Citation Manager File Format
Type of Import
Direct Import: When the Direct Import option is selected (the default state), a dialogue box will give you the option to Save or Open the downloaded citation data. Choosing Open will either launch your citation manager or give you a choice of applications with which to use the metadata. The Save option saves the file locally for later use.
Indirect Import: When the Indirect Import option is selected, the metadata is displayed and may be copied and pasted as needed.
About This Article
Special Topic
Copyright

Data & Comments
Data
0


Comments
Comments must be written in English. Spam, offensive content, impersonation, and private information will not be permitted. If any comment is reported and identified as inappropriate content by OAE staff, the comment will be removed without notice. If you have any queries or need any help, please contact us at support@oaepublish.com.