


fig9
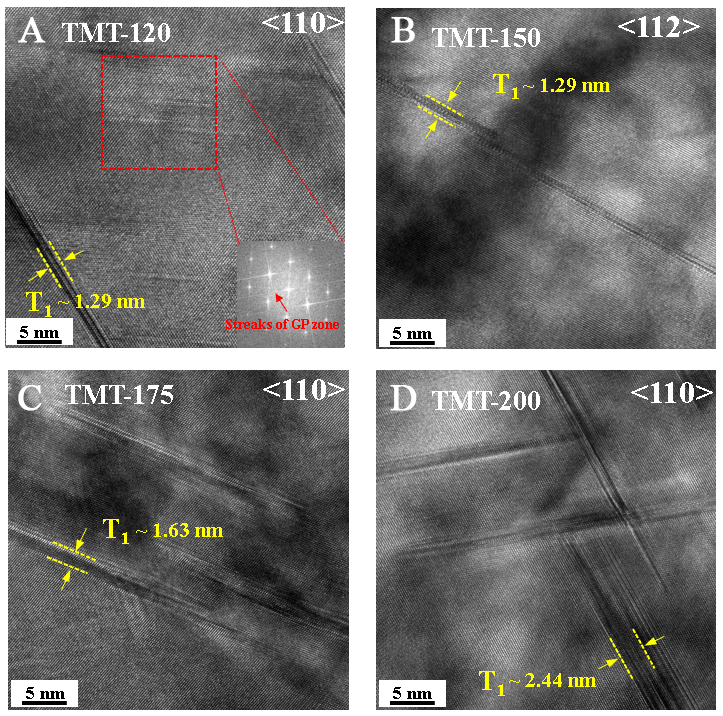
Figure 9. HRTEM images showing the thickness evolution of T1 precipitates at peak aging: (A) TMT-120; (B) TMT-150; (C) TMT-175; (D) TMT-200. TMT: Thermo-mechanical treatment; HRTEM: high-resolution transmission electron microscopy.
Figure 9. HRTEM images showing the thickness evolution of T1 precipitates at peak aging: (A) TMT-120; (B) TMT-150; (C) TMT-175; (D) TMT-200. TMT: Thermo-mechanical treatment; HRTEM: high-resolution transmission electron microscopy.


All published articles are preserved here permanently:
https://www.portico.org/publishers/oae/


