


fig14
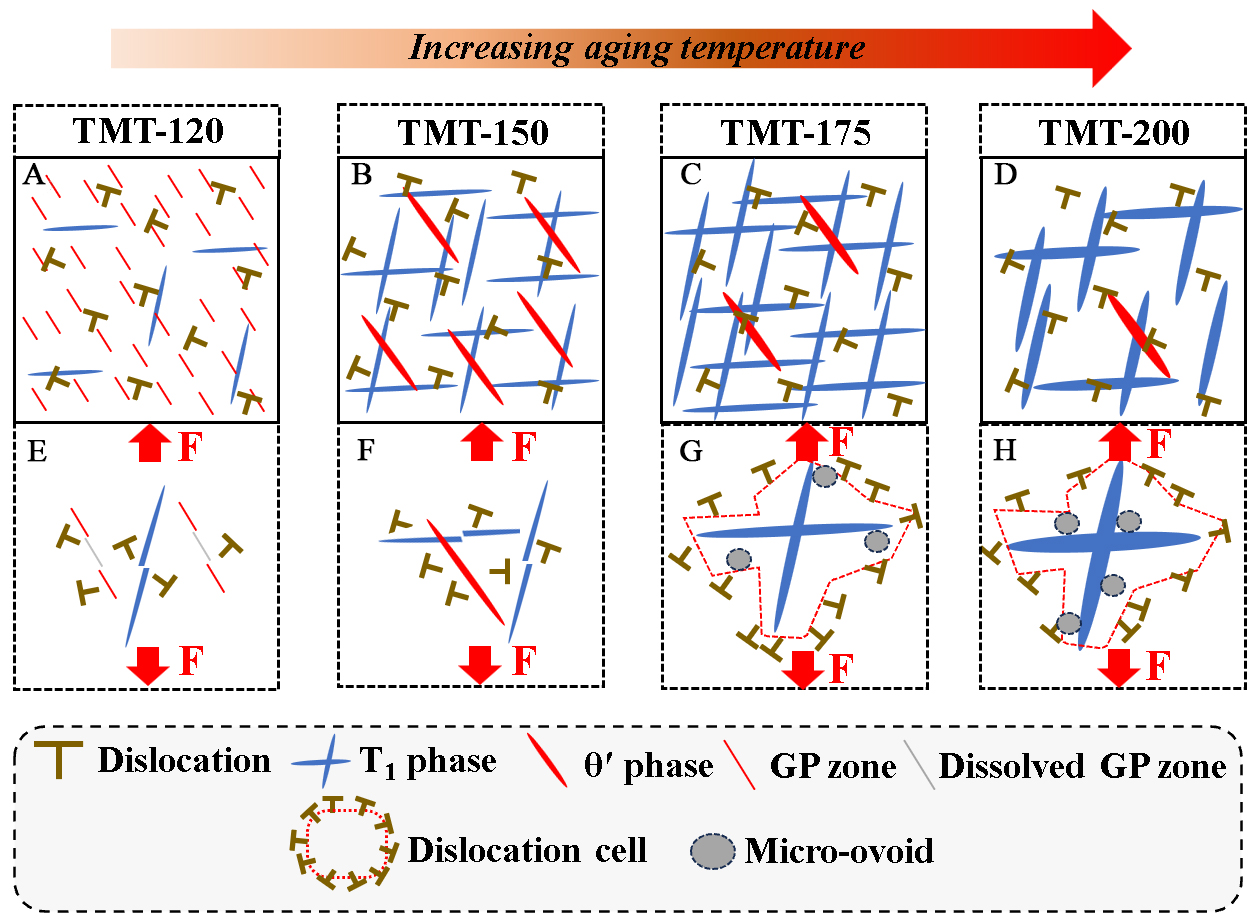
Figure 14. Schematic diagram showing the microstructure evolution with increasing aging temperature (A-D), and precipitate-dislocation interaction in the different TMT samples during deformation (E-H): TMT-120 sample (A and E); TMT-150 sample (B and F); TMT-175 sample (C and G); TMT-200 sample (D and H). TMT: Thermo-mechanical treatment.


