


fig13
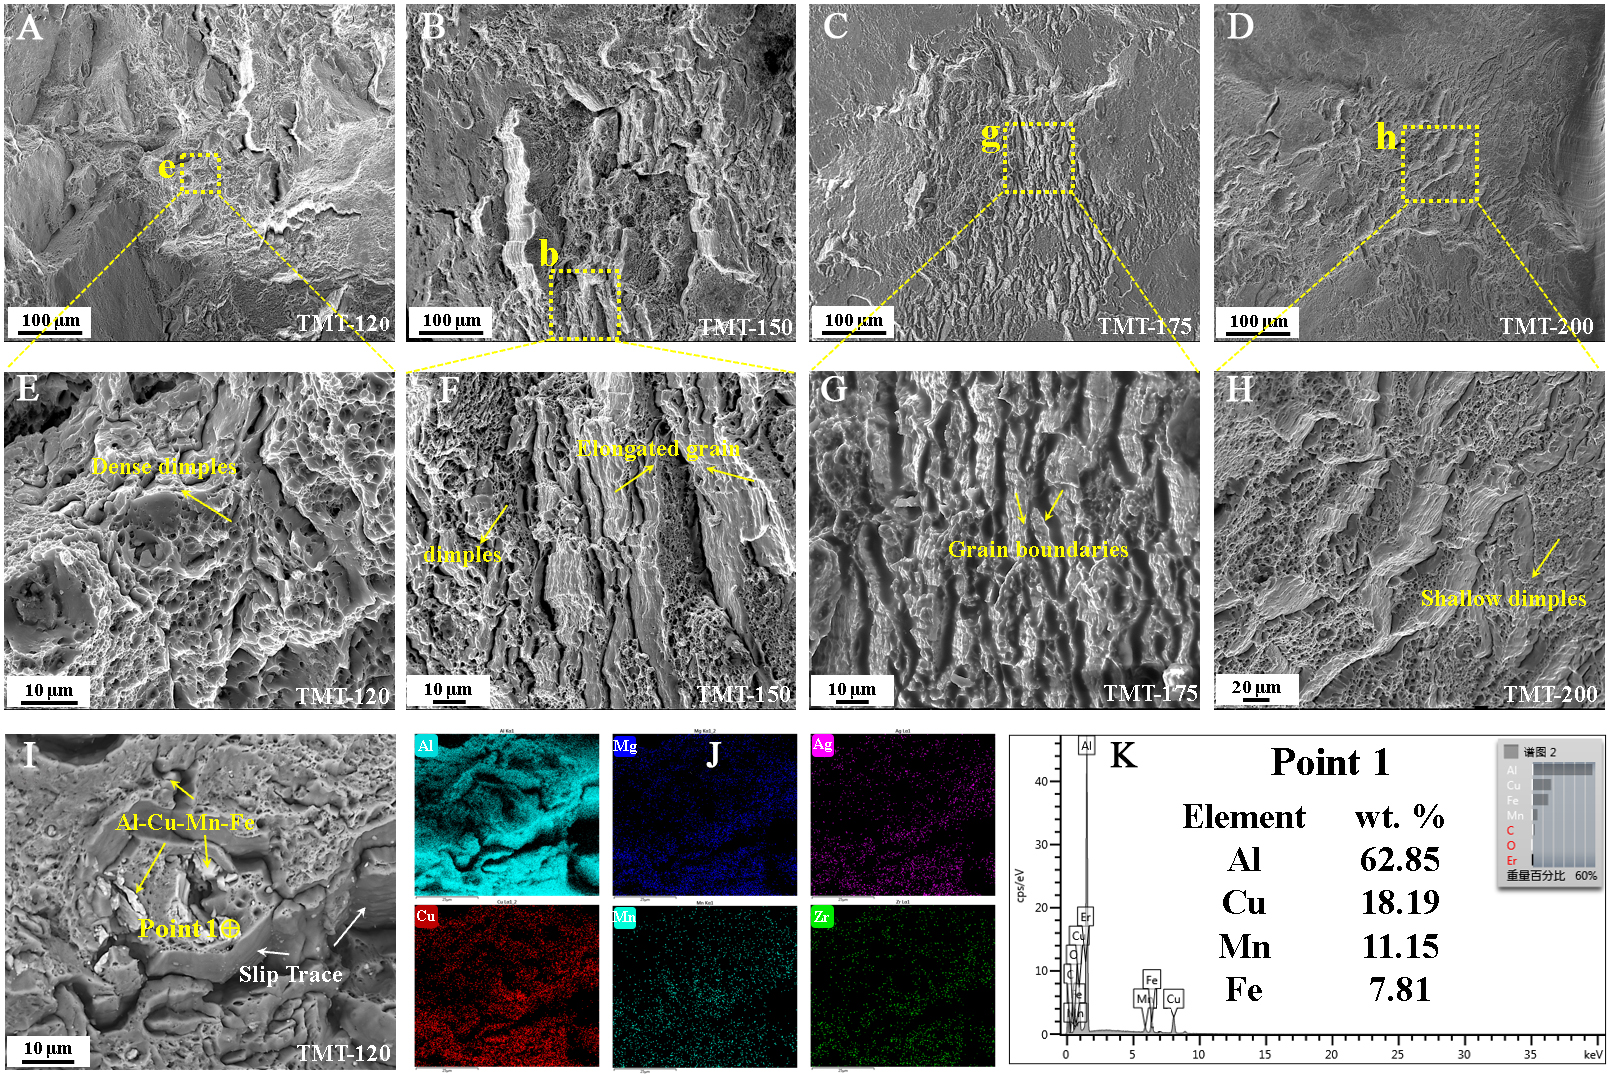
Figure 13. The fracture morphology of the different TMT samples: (A, E and I) TMT-120; (B and F) TMT-150; (C and G) TMT-175; (D and H) TMT-200; (E-H) are high-magnification images of the yellow dashed boxes in (A-D), respectively; (I) is the BSE image and the corresponding EDS analysis of theTMT-120 sample. TMT: thermo-mechanical treatment; BSE: backscattered electron detector; EDS: X-ray spectroscopy.


