


fig11
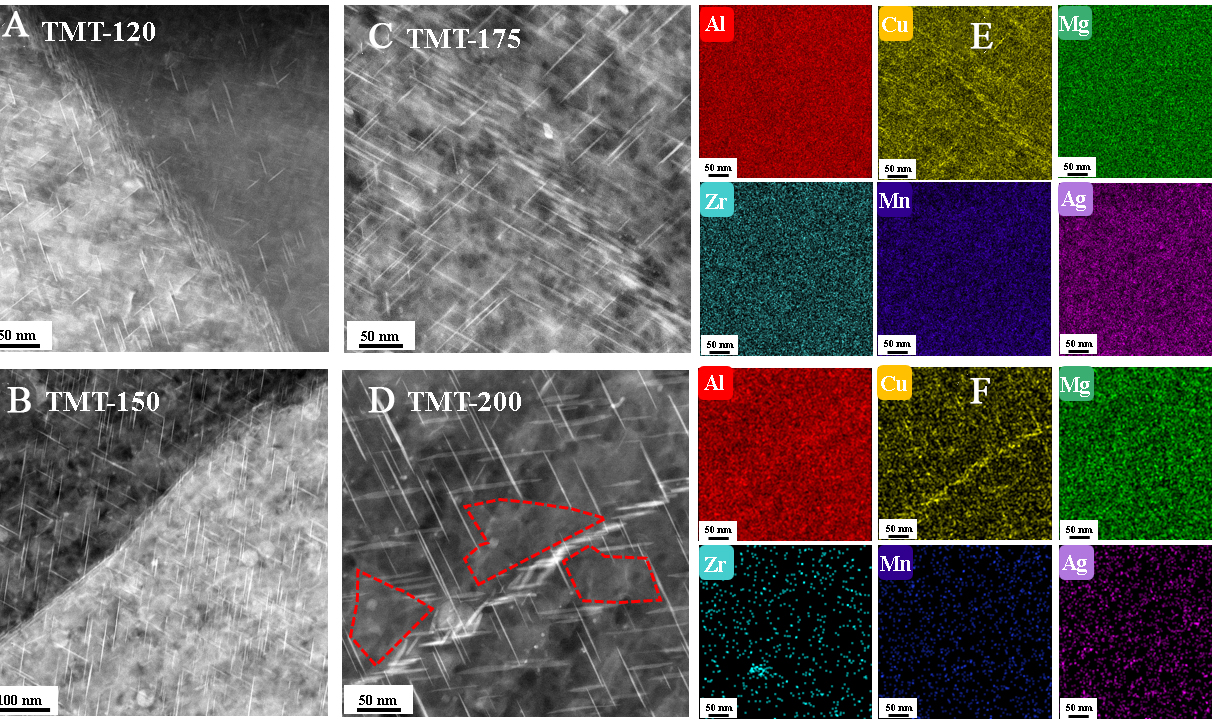
Figure 11. HAADF-STEM images along the [110]Al zone axis and corresponding EDS mappings of four TMT samples at sub-grain boundaries (A-D): (A) TMT-120; (B) TMT-150; (C) TMT-175; (D) TMT-200; (E) and (F) show the EDS analysis for (C) and (D), respectively. TMT: Thermo-mechanical treatment; HAADF-STEM: high-angle annular dark-field scanning transmission electron microscopy; EDS: X-ray spectroscopy.


