

fig6
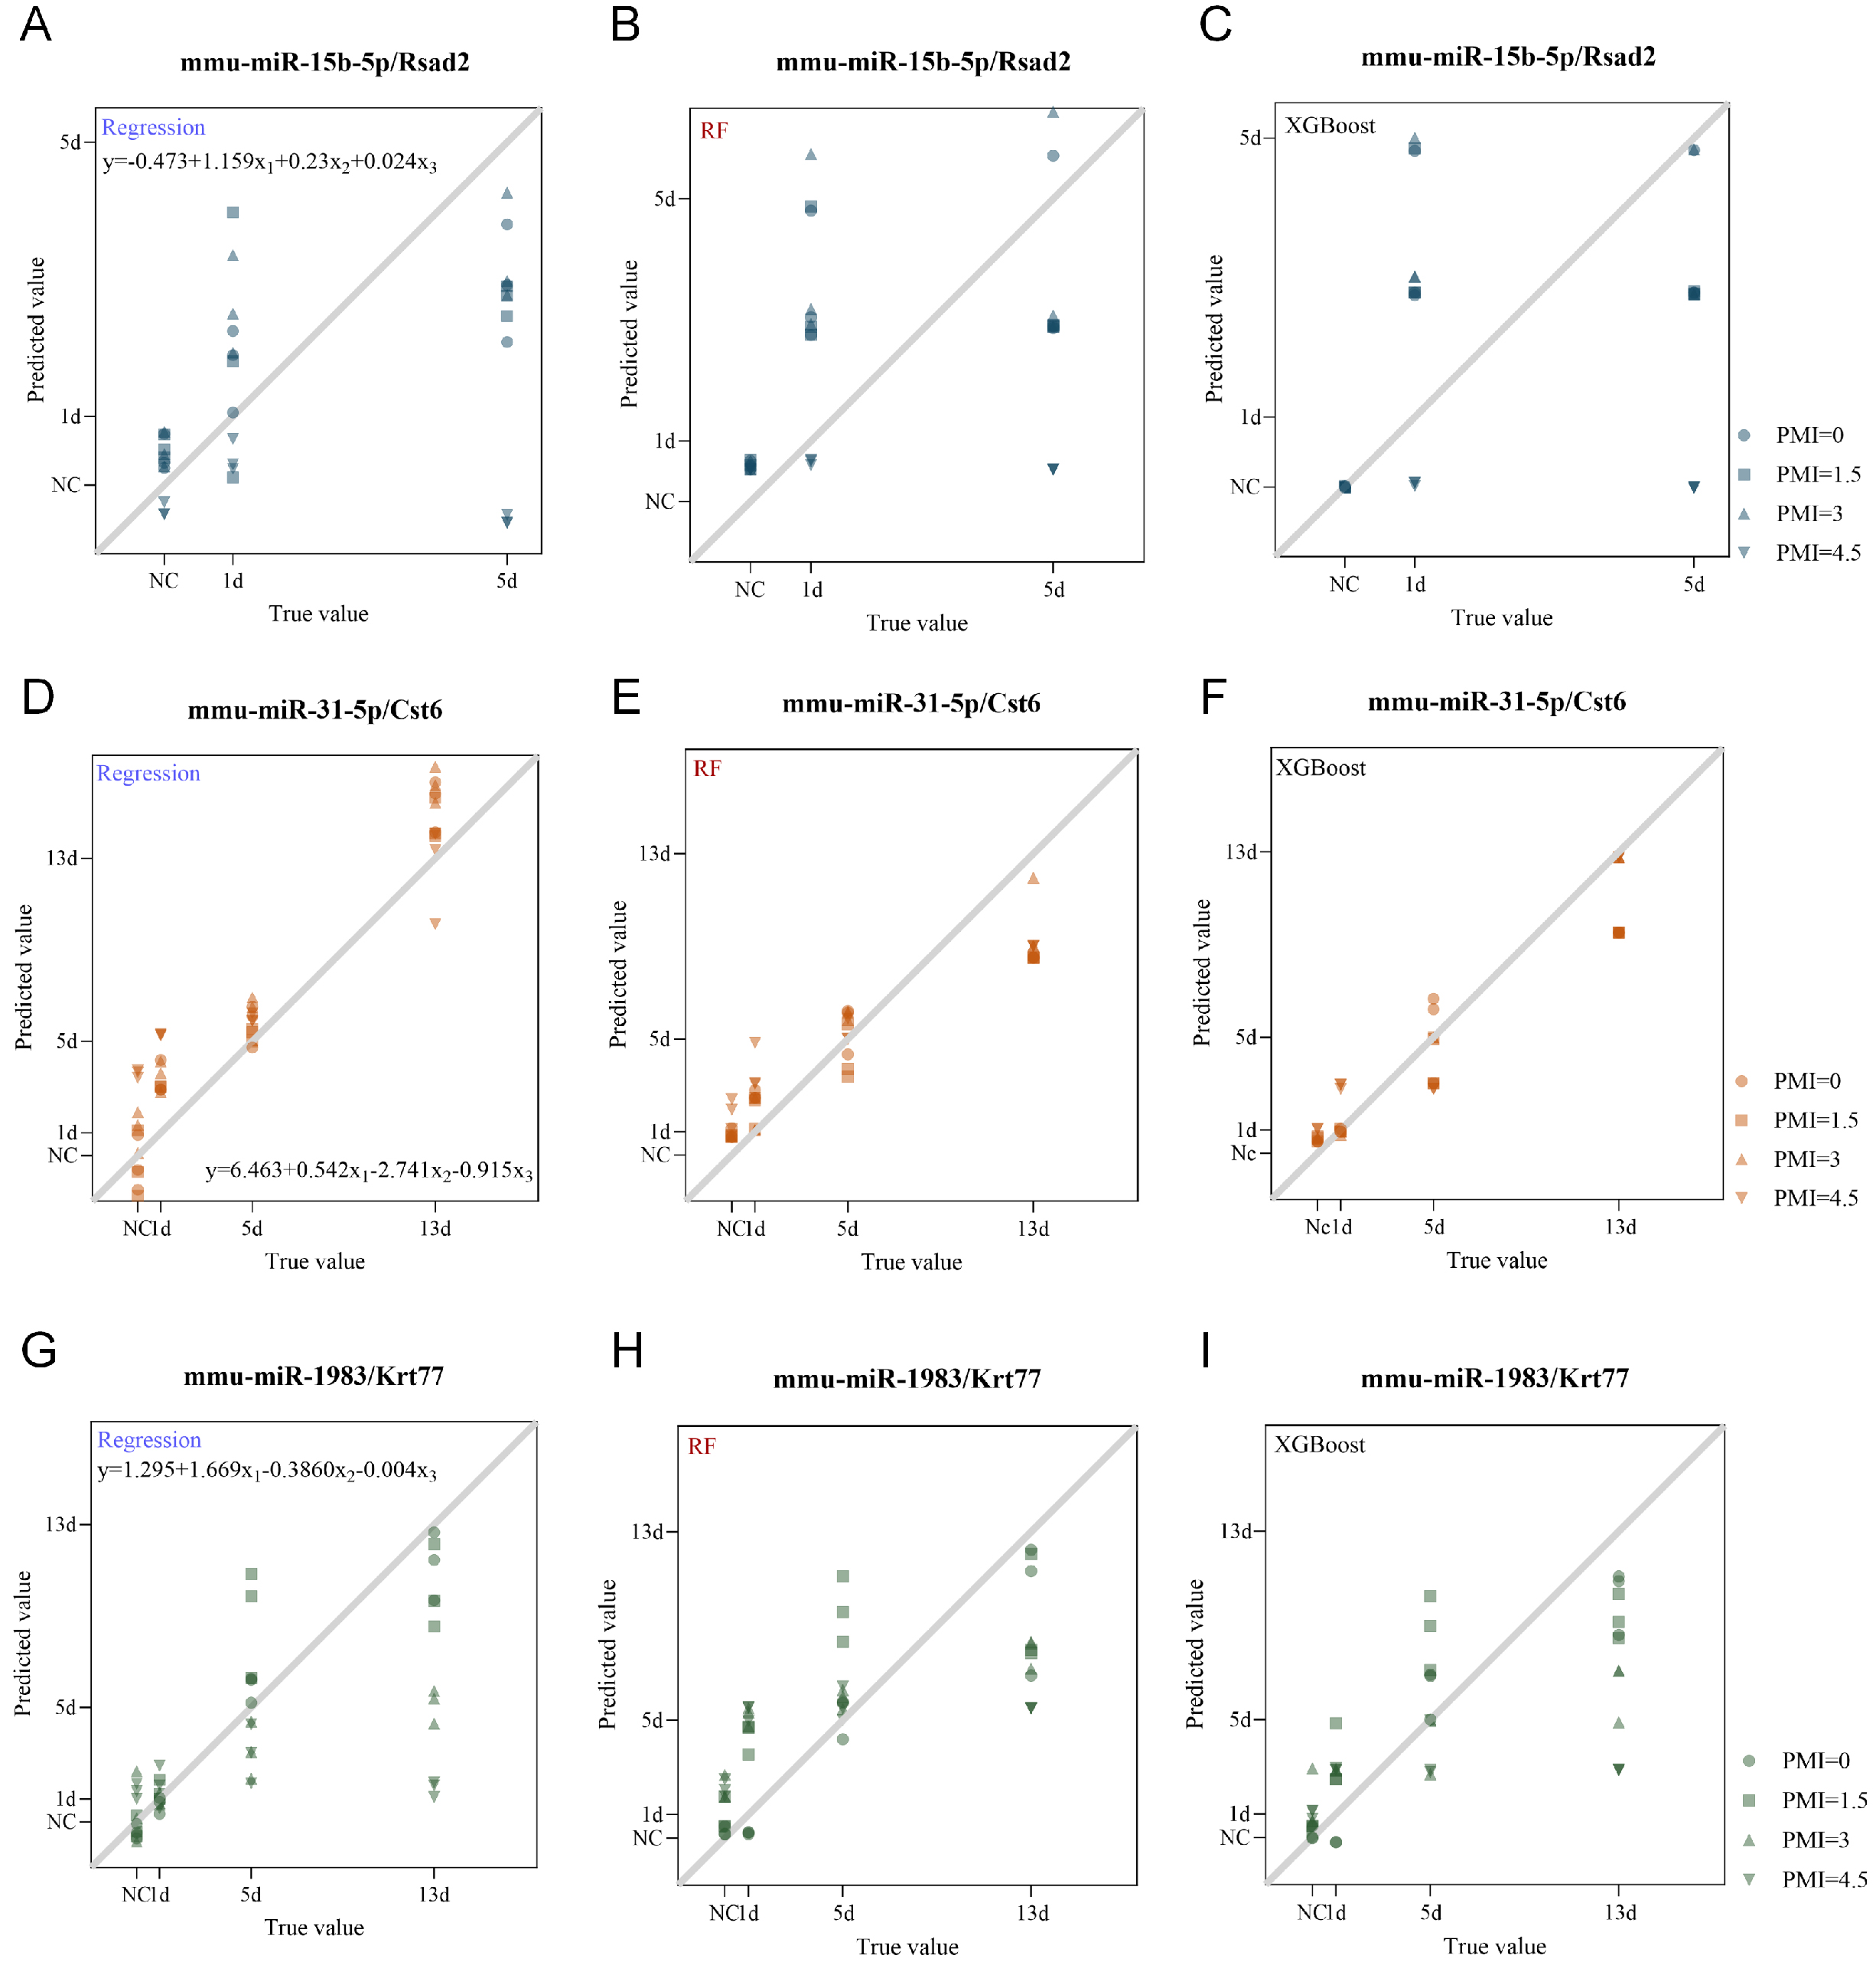
Figure 6. Figure 6 . Evaluation of the triad system robustness against postmortem changes; (A-C) Scatter plots showing predicted versus actual wound age for test set samples of the mmu-miR-15b-5p/Rsad2/RSAD2 triad across different postmortem intervals (PMI = 0, 1.5, 3, and 4.5 d) at indicated post-injury time points (NC, 1 d, 5 d), using multivariate linear regression (A), Random Forest (B), and XGBoost (C); (D-F) Scatter plots showing predicted versus actual wound age for test set samples of the mmu-miR-31-5p/Cst6/CST6 triad across different PMI (0, 1.5, 3, and 4.5 d) at indicated post-injury time points (NC, 1 d, 5 d, and 13 d), using multivariate linear regression (D), Random Forest (E), and XGBoost (F); (G-I) Scatter plots showing predicted versus actual wound age for test set samples of the mmu-miR-1983/Krt77/KRT77 triad across different PMI (0, 1.5, 3, and 4.5 d) at indicated post-injury time points (NC, 1 d, 5 d, and 13 d), using multivariate linear regression (G), Random Forest (H), and XGBoost (I). The black line represents the y = x diagonal, and dots are represented by different shapes according to PMI. NC: PMI: postmortem intervals.

