
fig2
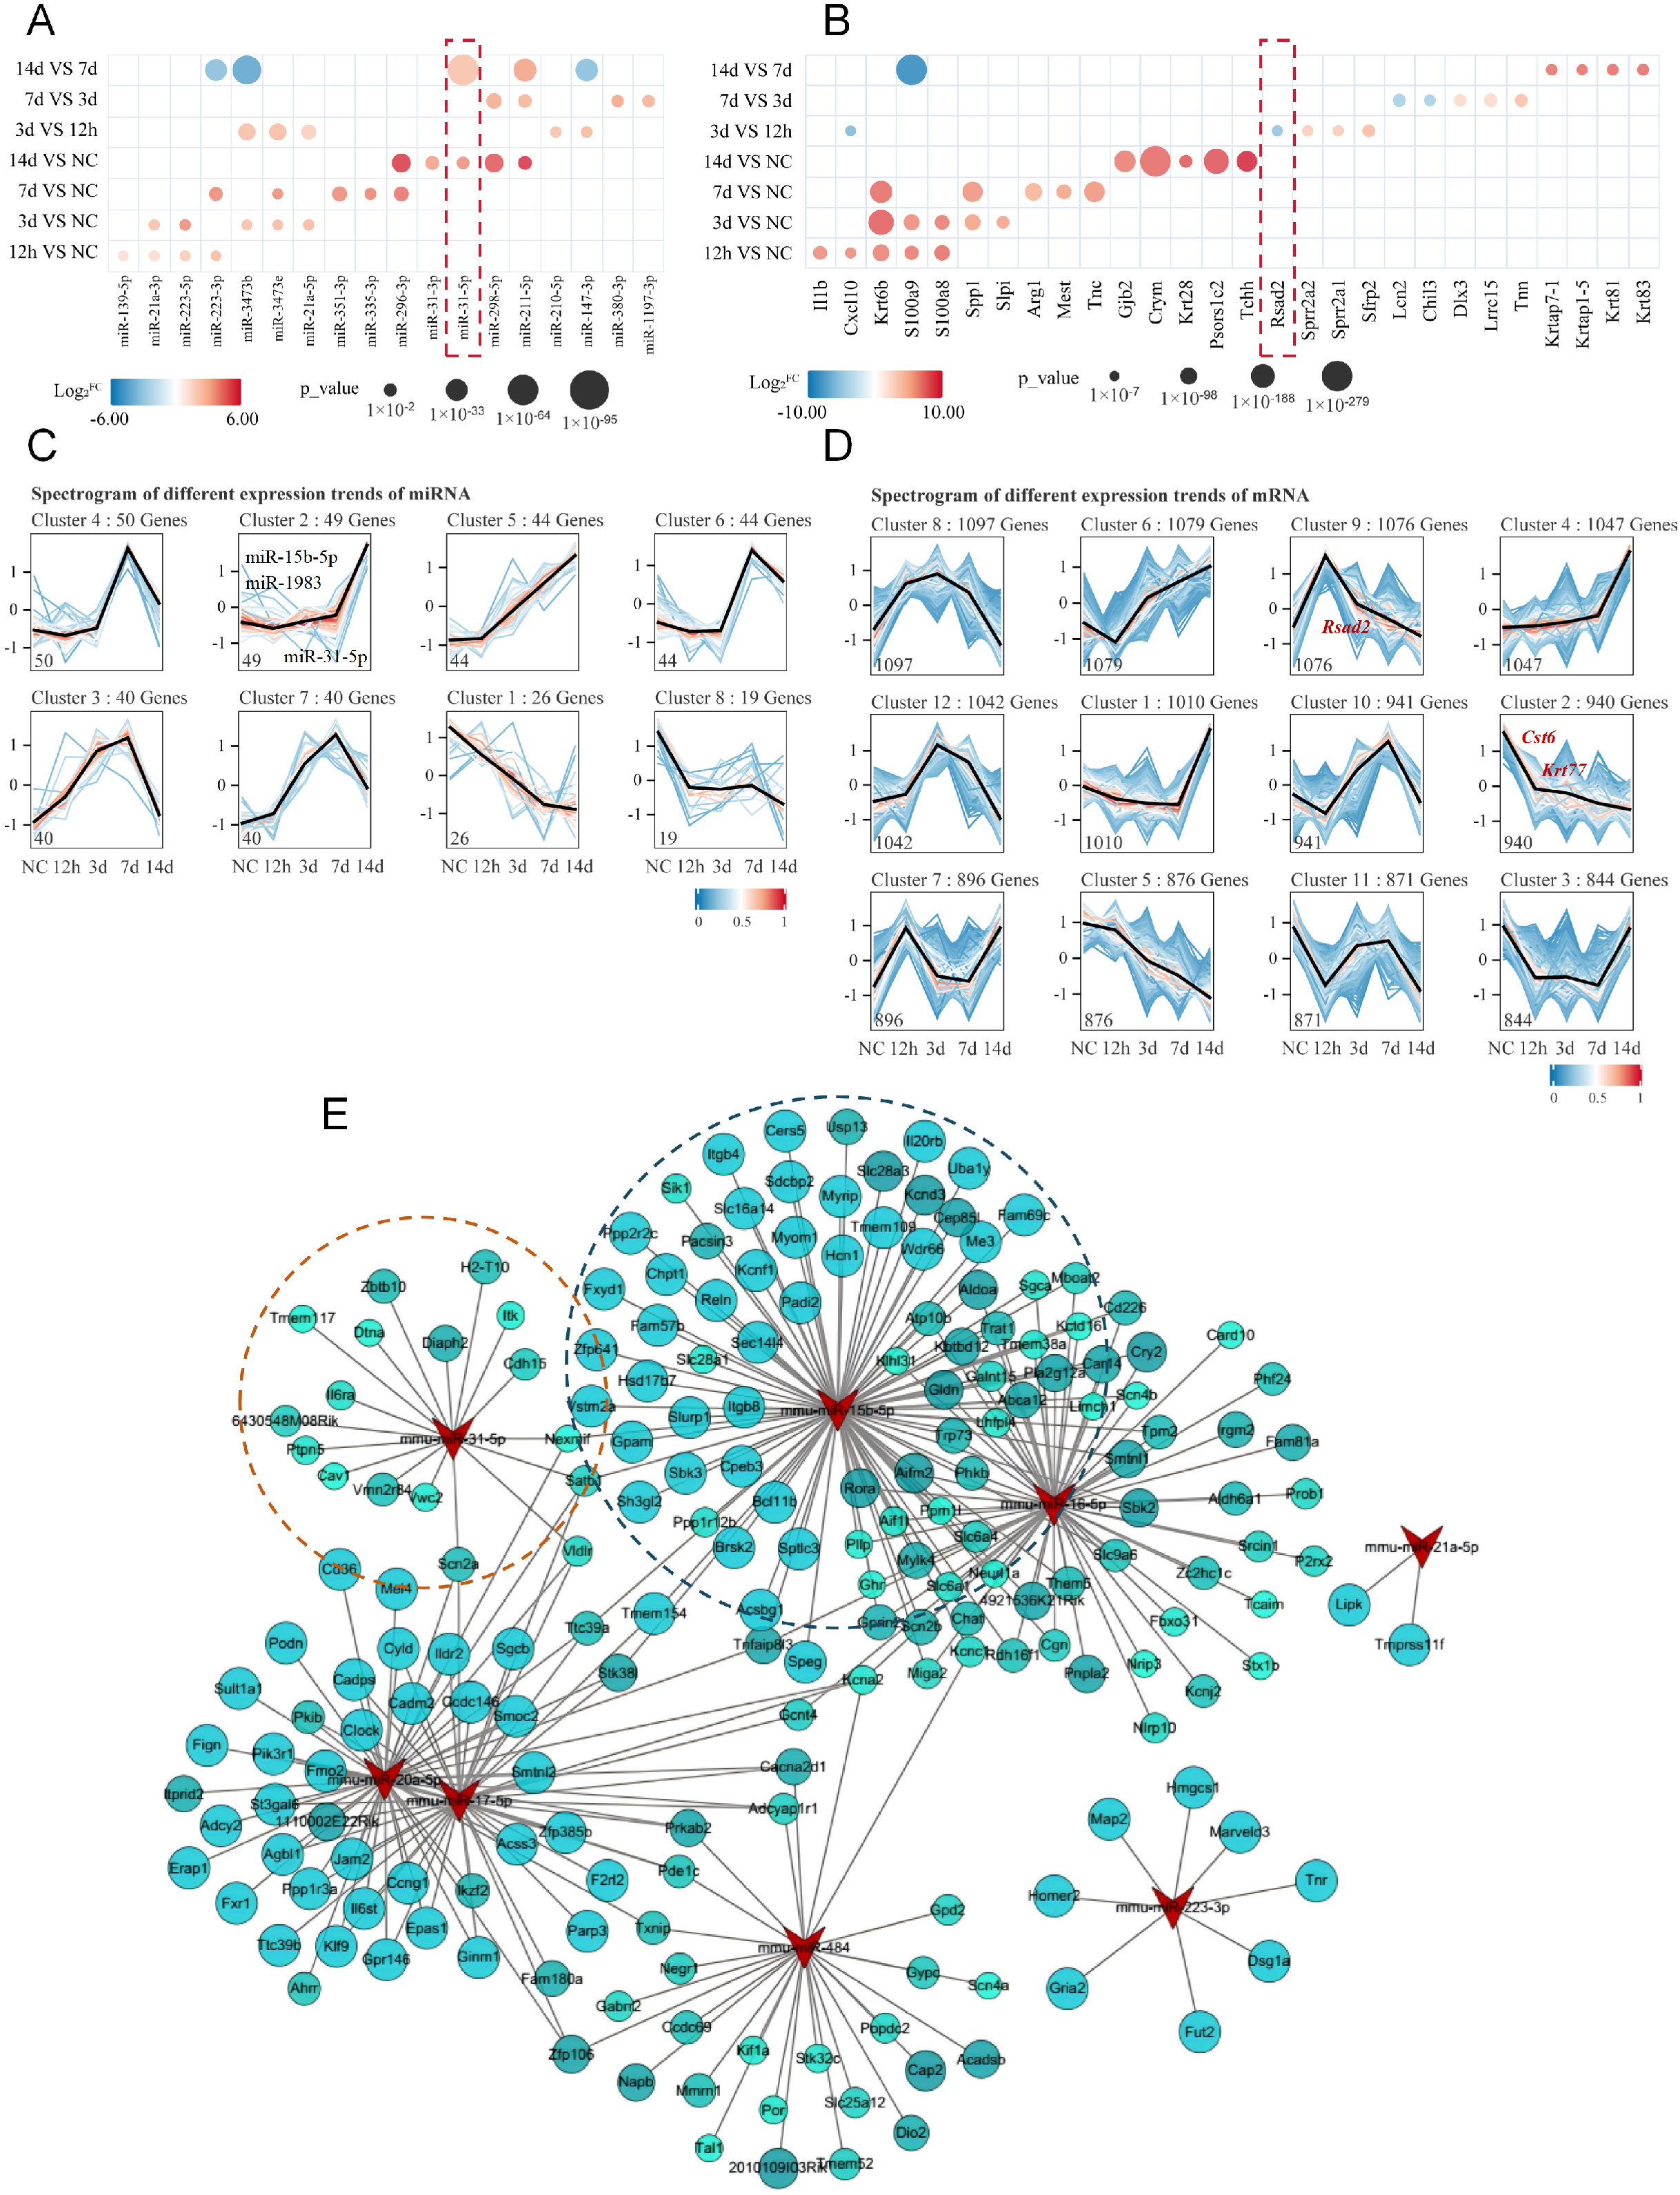
Figure 2. Identification of key differentially expressed miRNAs and mRNAs and construction of the miRNA-mRNA regulatory network. (A and B) Heatmaps showing the top five differentially expressed miRNAs (A) and mRNAs (B) in normal skin and at indicated post-injury time points. Circle size represents statistical significance, and color intensity indicates the magnitude of differential expression; (C and D) STEM analysis of temporal expression patterns of differentially expressed miRNAs (C) and mRNAs (D). Color intensity represents log2FC values, with each profile depicting a distinct expression trajectory; (E) miRNA-mRNA regulatory network during skin wound healing. Triangles represent miRNAs, and circles represent mRNAs. Circle color intensity reflects the PCC, and circle size indicates statistical significance. Only negatively correlated pairs are shown. PCC < -0.7, P < 0.05. STEM: Short Time-series Expression Miner; FC: fold change; PCC: Pearson correlation coefficient.

