


fig3
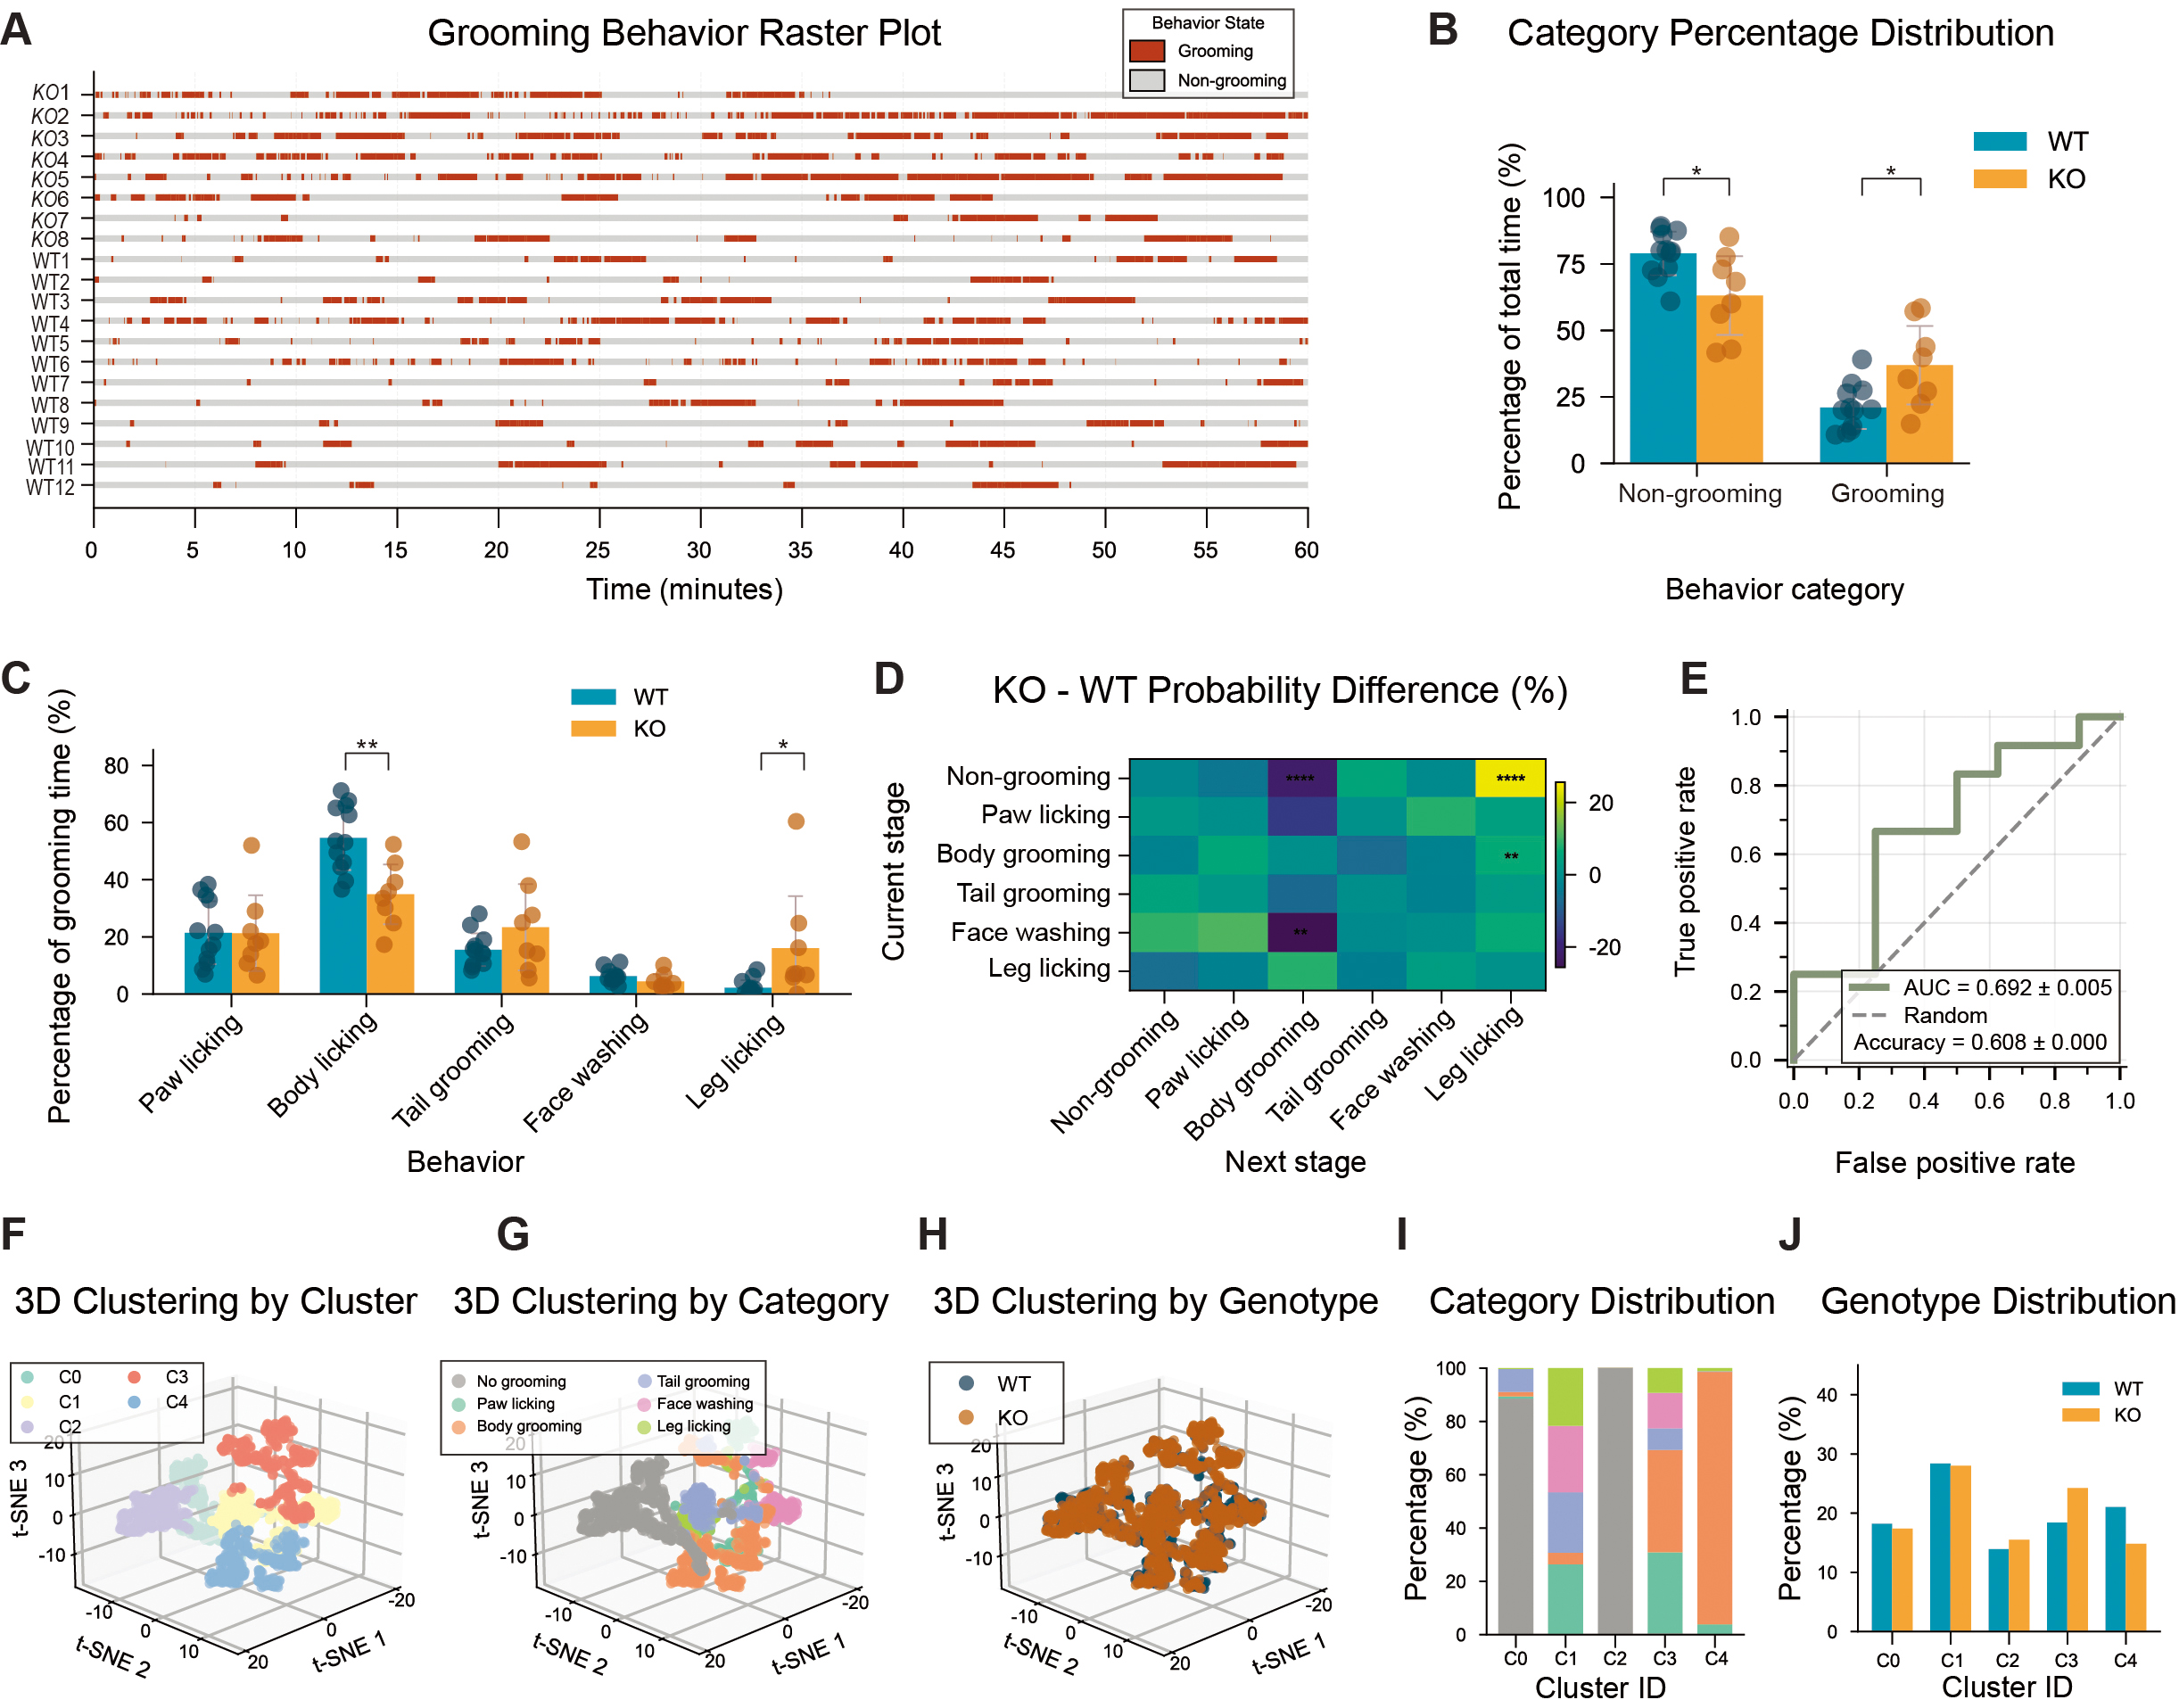
Figure 3. Increased grooming stereotypy and simplified behavioral structure in Shank3B KO mice. (A) Behavior raster plot depicting grooming and non-grooming states over time for each mouse. (B) Behavior category percentage distribution. (C) Detailed grooming behavior percentage distribution. (D) Difference matrix of behavioral transition probabilities between KO and WT mice. (E) ROC curve of SVM classifier based on behavioral events. (accuracy = 0.608 ± 0.000, AUC = 0.695 ± 0.005). (F) 3D t-SNE clustering plot colored by cluster. (G) 3D t-SNE clustering plot colored by six specific grooming behaviors. (H) 3D t-SNE clustering plot colored by genotype. (I) Stacked bar chart showing the percentage of behavioral categories in each cluster. (J) Standardized comparison of WT and KO event distribution across clusters. n = 12 mice for WT and n = 8 mice for KO. Data presented as means ± SEM. *P < 0.05, **P < 0.01, ****P < 0.0001. Comparisons between two groups were performed using two-tailed Student's t-test or Mann-Whitney U test as appropriate. For analyses involving multiple comparisons (behavioral subtype proportions, transition probabilities, cluster composition, and genotype distribution across clusters), p values are nominal; significance was determined using the Benjamini - Hochberg FDR procedure with q < 0.05.


