


fig8
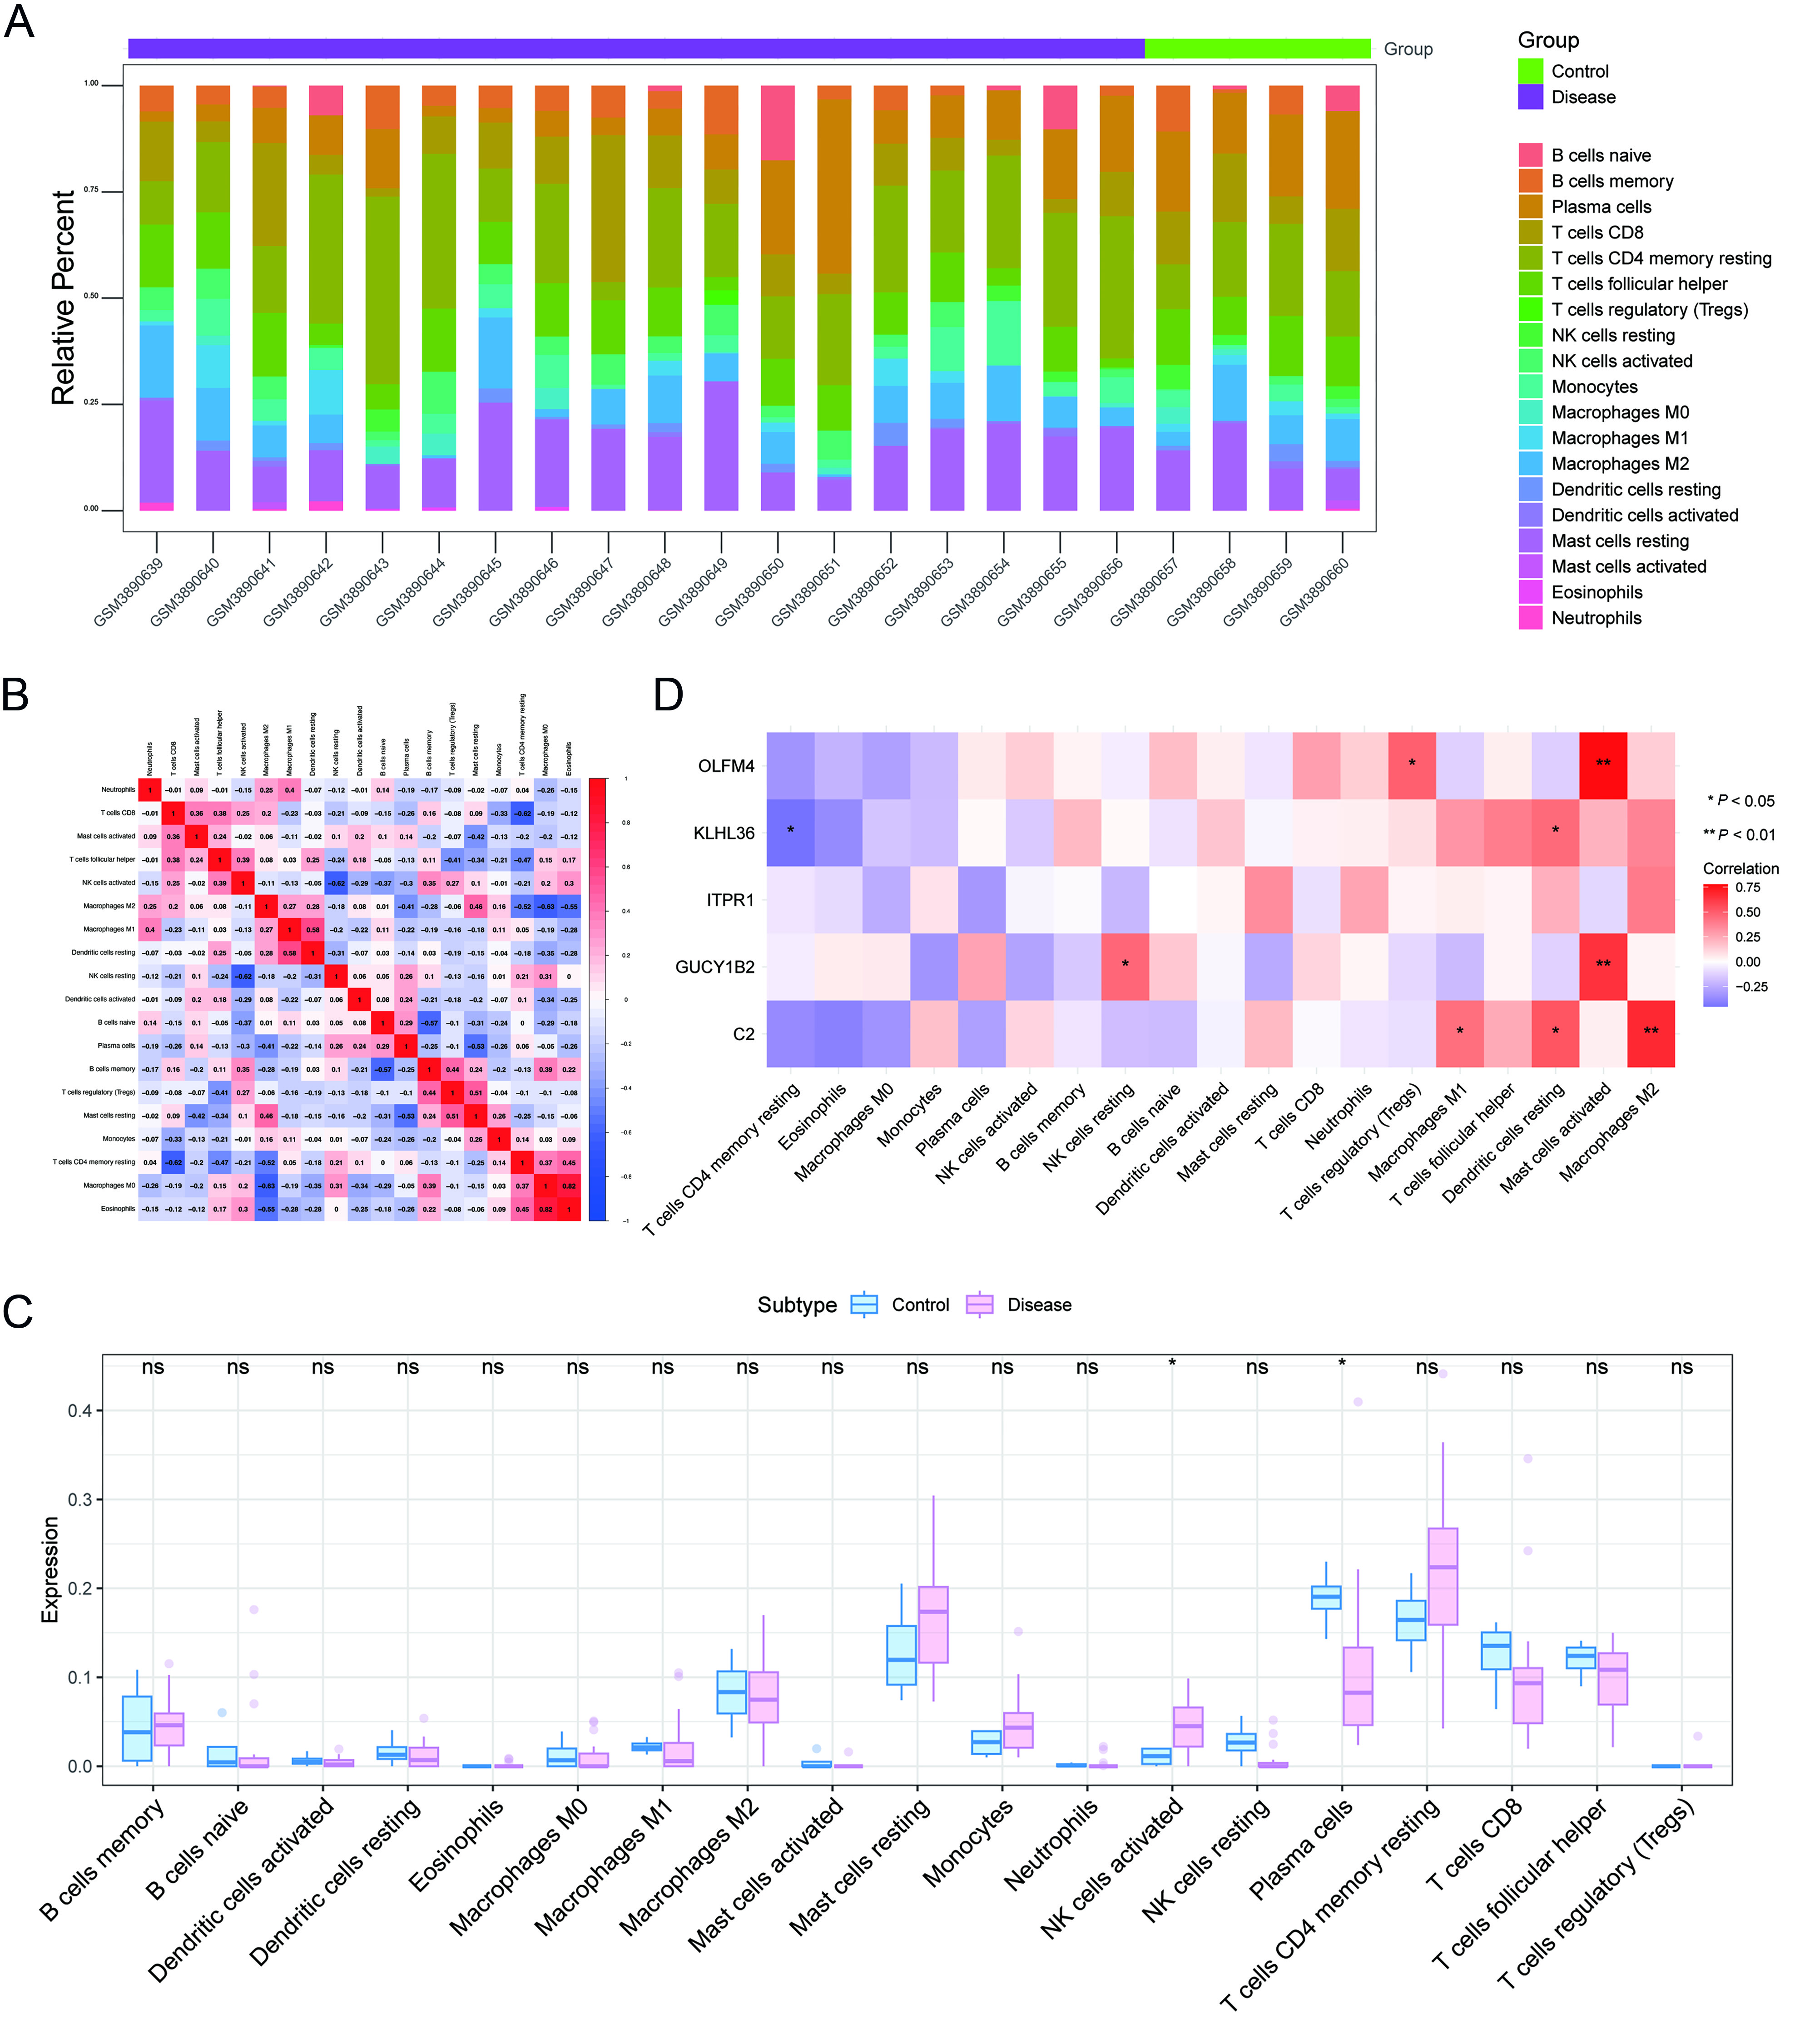
Figure 8. Immune infiltration analysis. (A) Relative proportions of immune cell subpopulations; (B) Pearson correlations among immune cell types (blue: negative correlation; red: positive correlation); (C) Differences in immune cell composition between control and BPH groups, assessed using the Wilcoxon rank-sum test; (D) Correlations between prioritized genes and immune cell infiltration, evaluated using Pearson correlation analysis. *P < 0.05; **P < 0.01; ***P < 0.001. BPH: Benign prostatic hyperplasia.


