


fig7
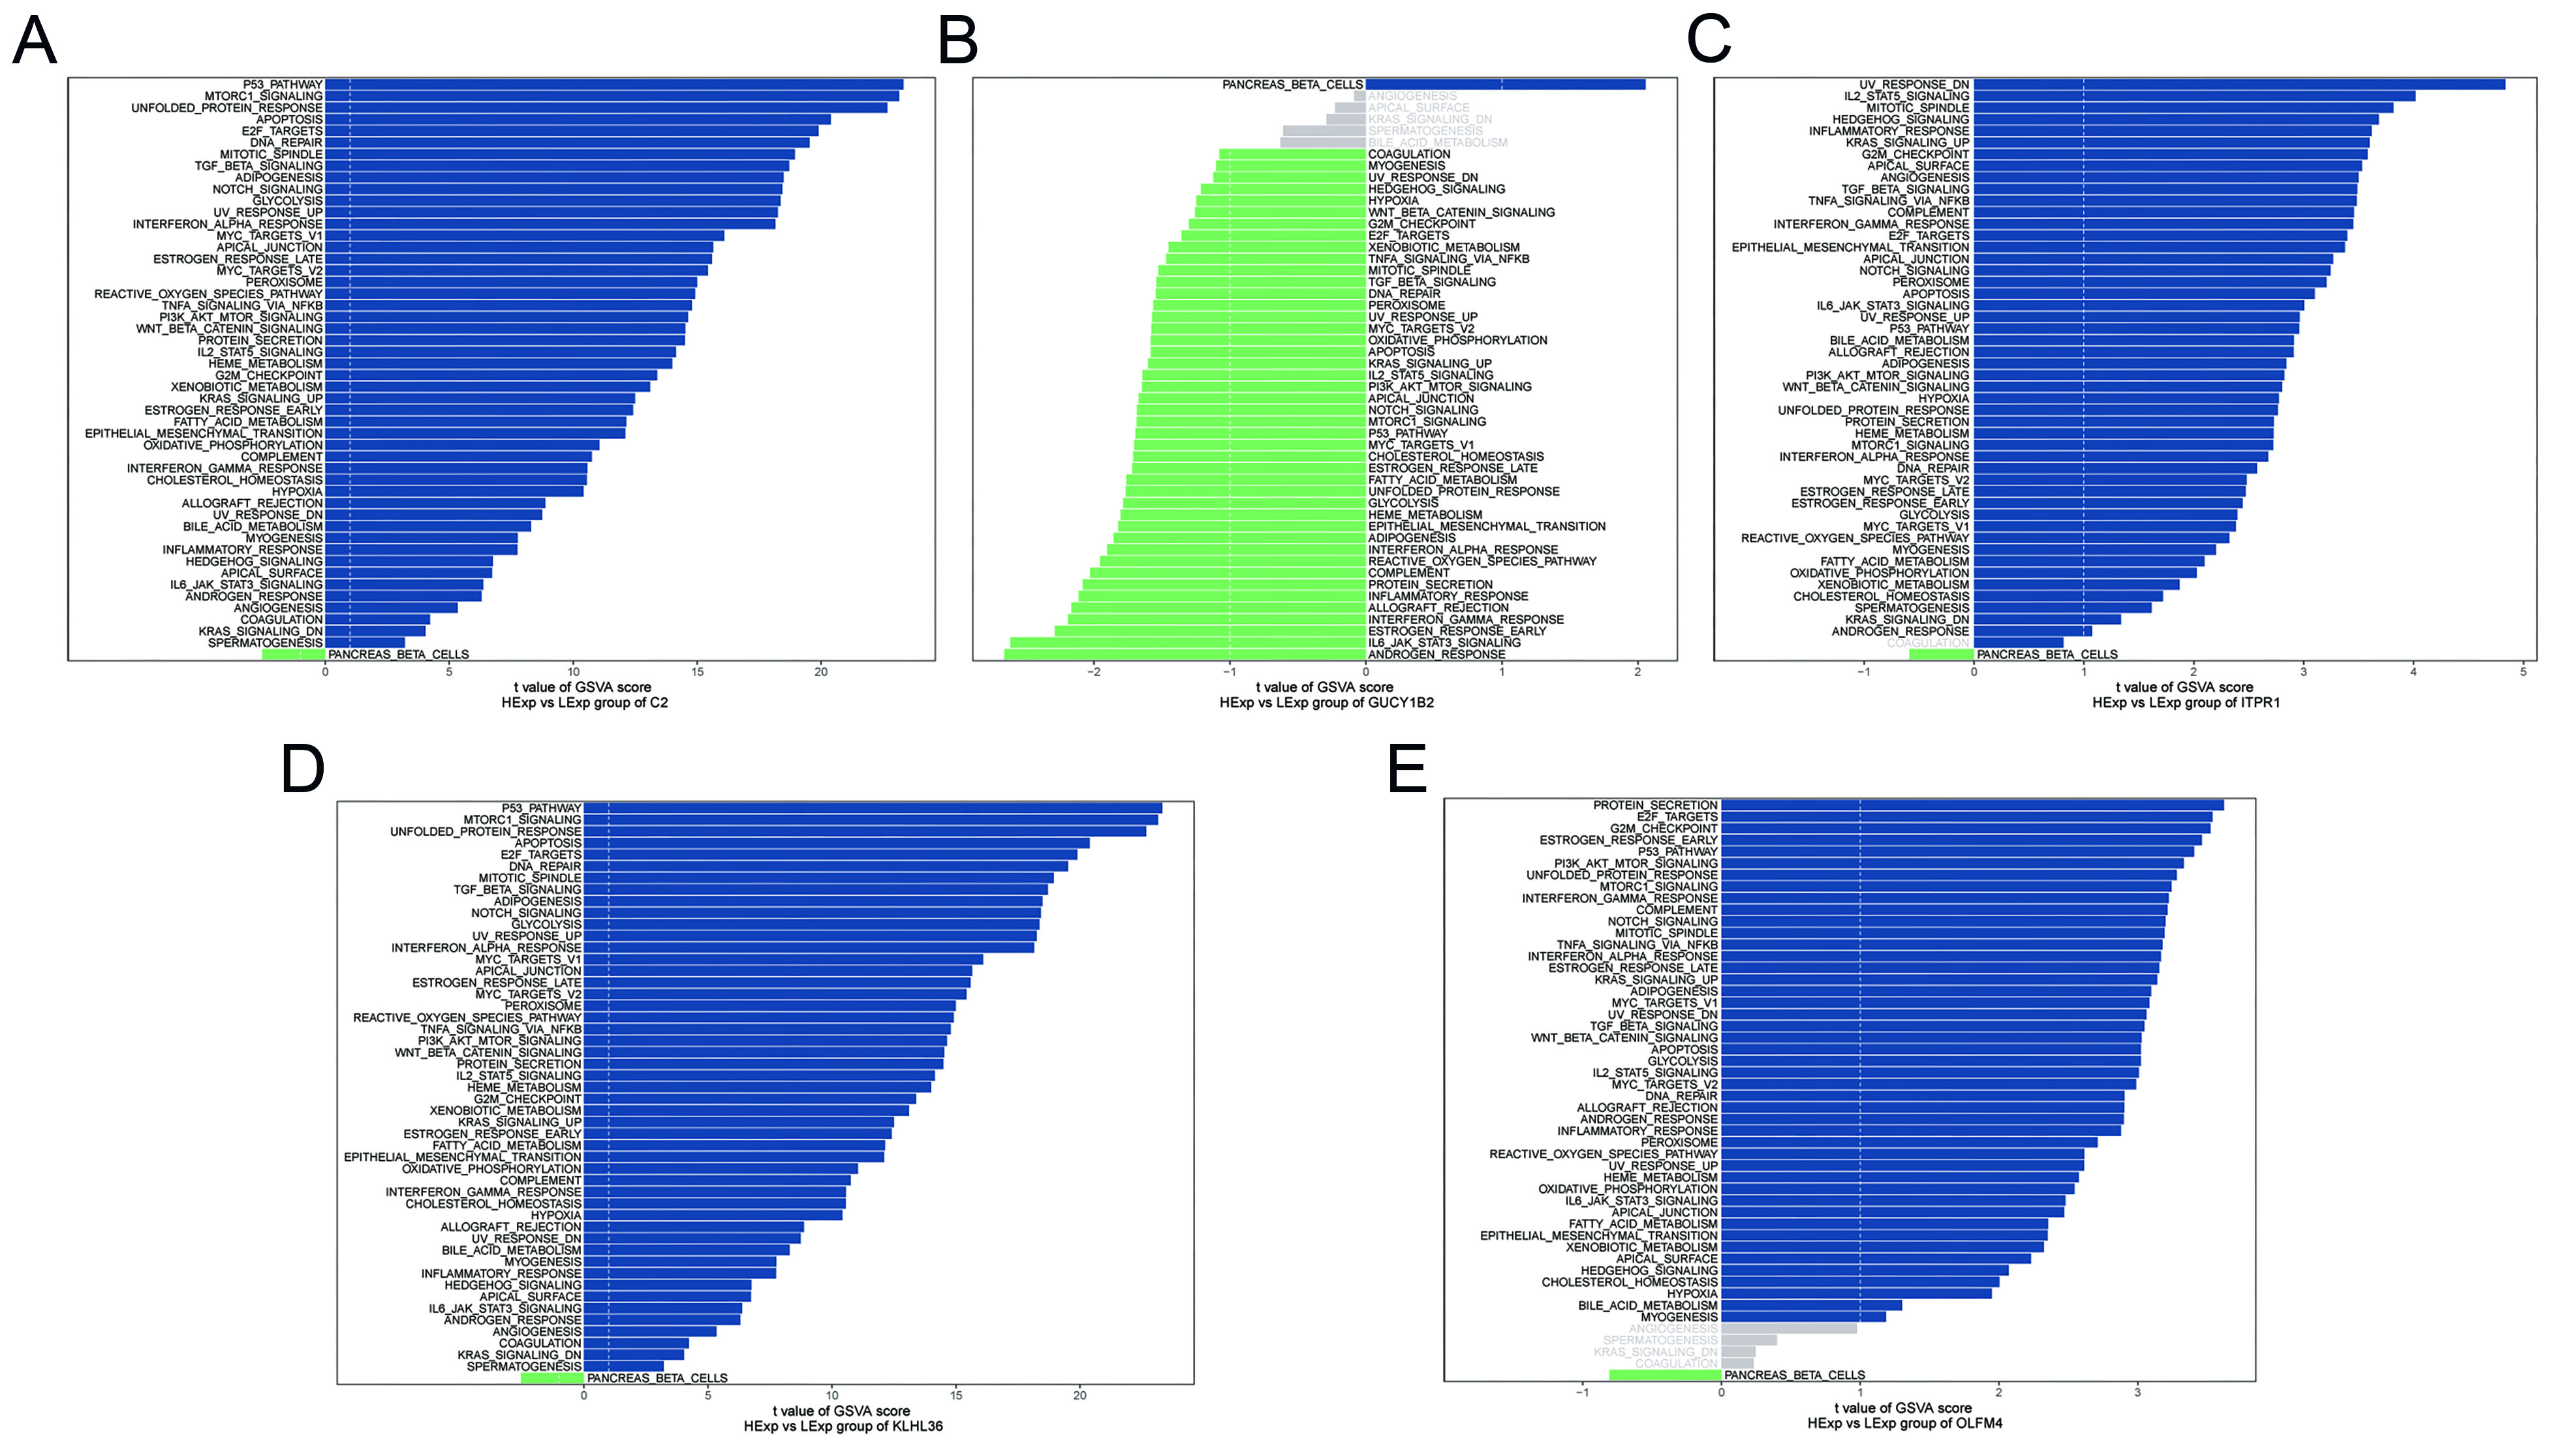
Figure 7. GSVA of key genes. (A-E) GSVA results for key genes. Blue indicates pathways enriched in the high-expression group, whereas green indicates pathways enriched in the low-expression group. Hallmark gene sets were used as the reference. C2: complement component 2; GUCY1B2: guanylate cyclase 1 soluble subunit beta 2; OLFM4: olfactomedin 4; ITPR1: inositol 1,4,5-trisphosphate receptor type 1; KLHL36: kelch like family member 36; GSVA: gene set variation analysis.


