


fig11
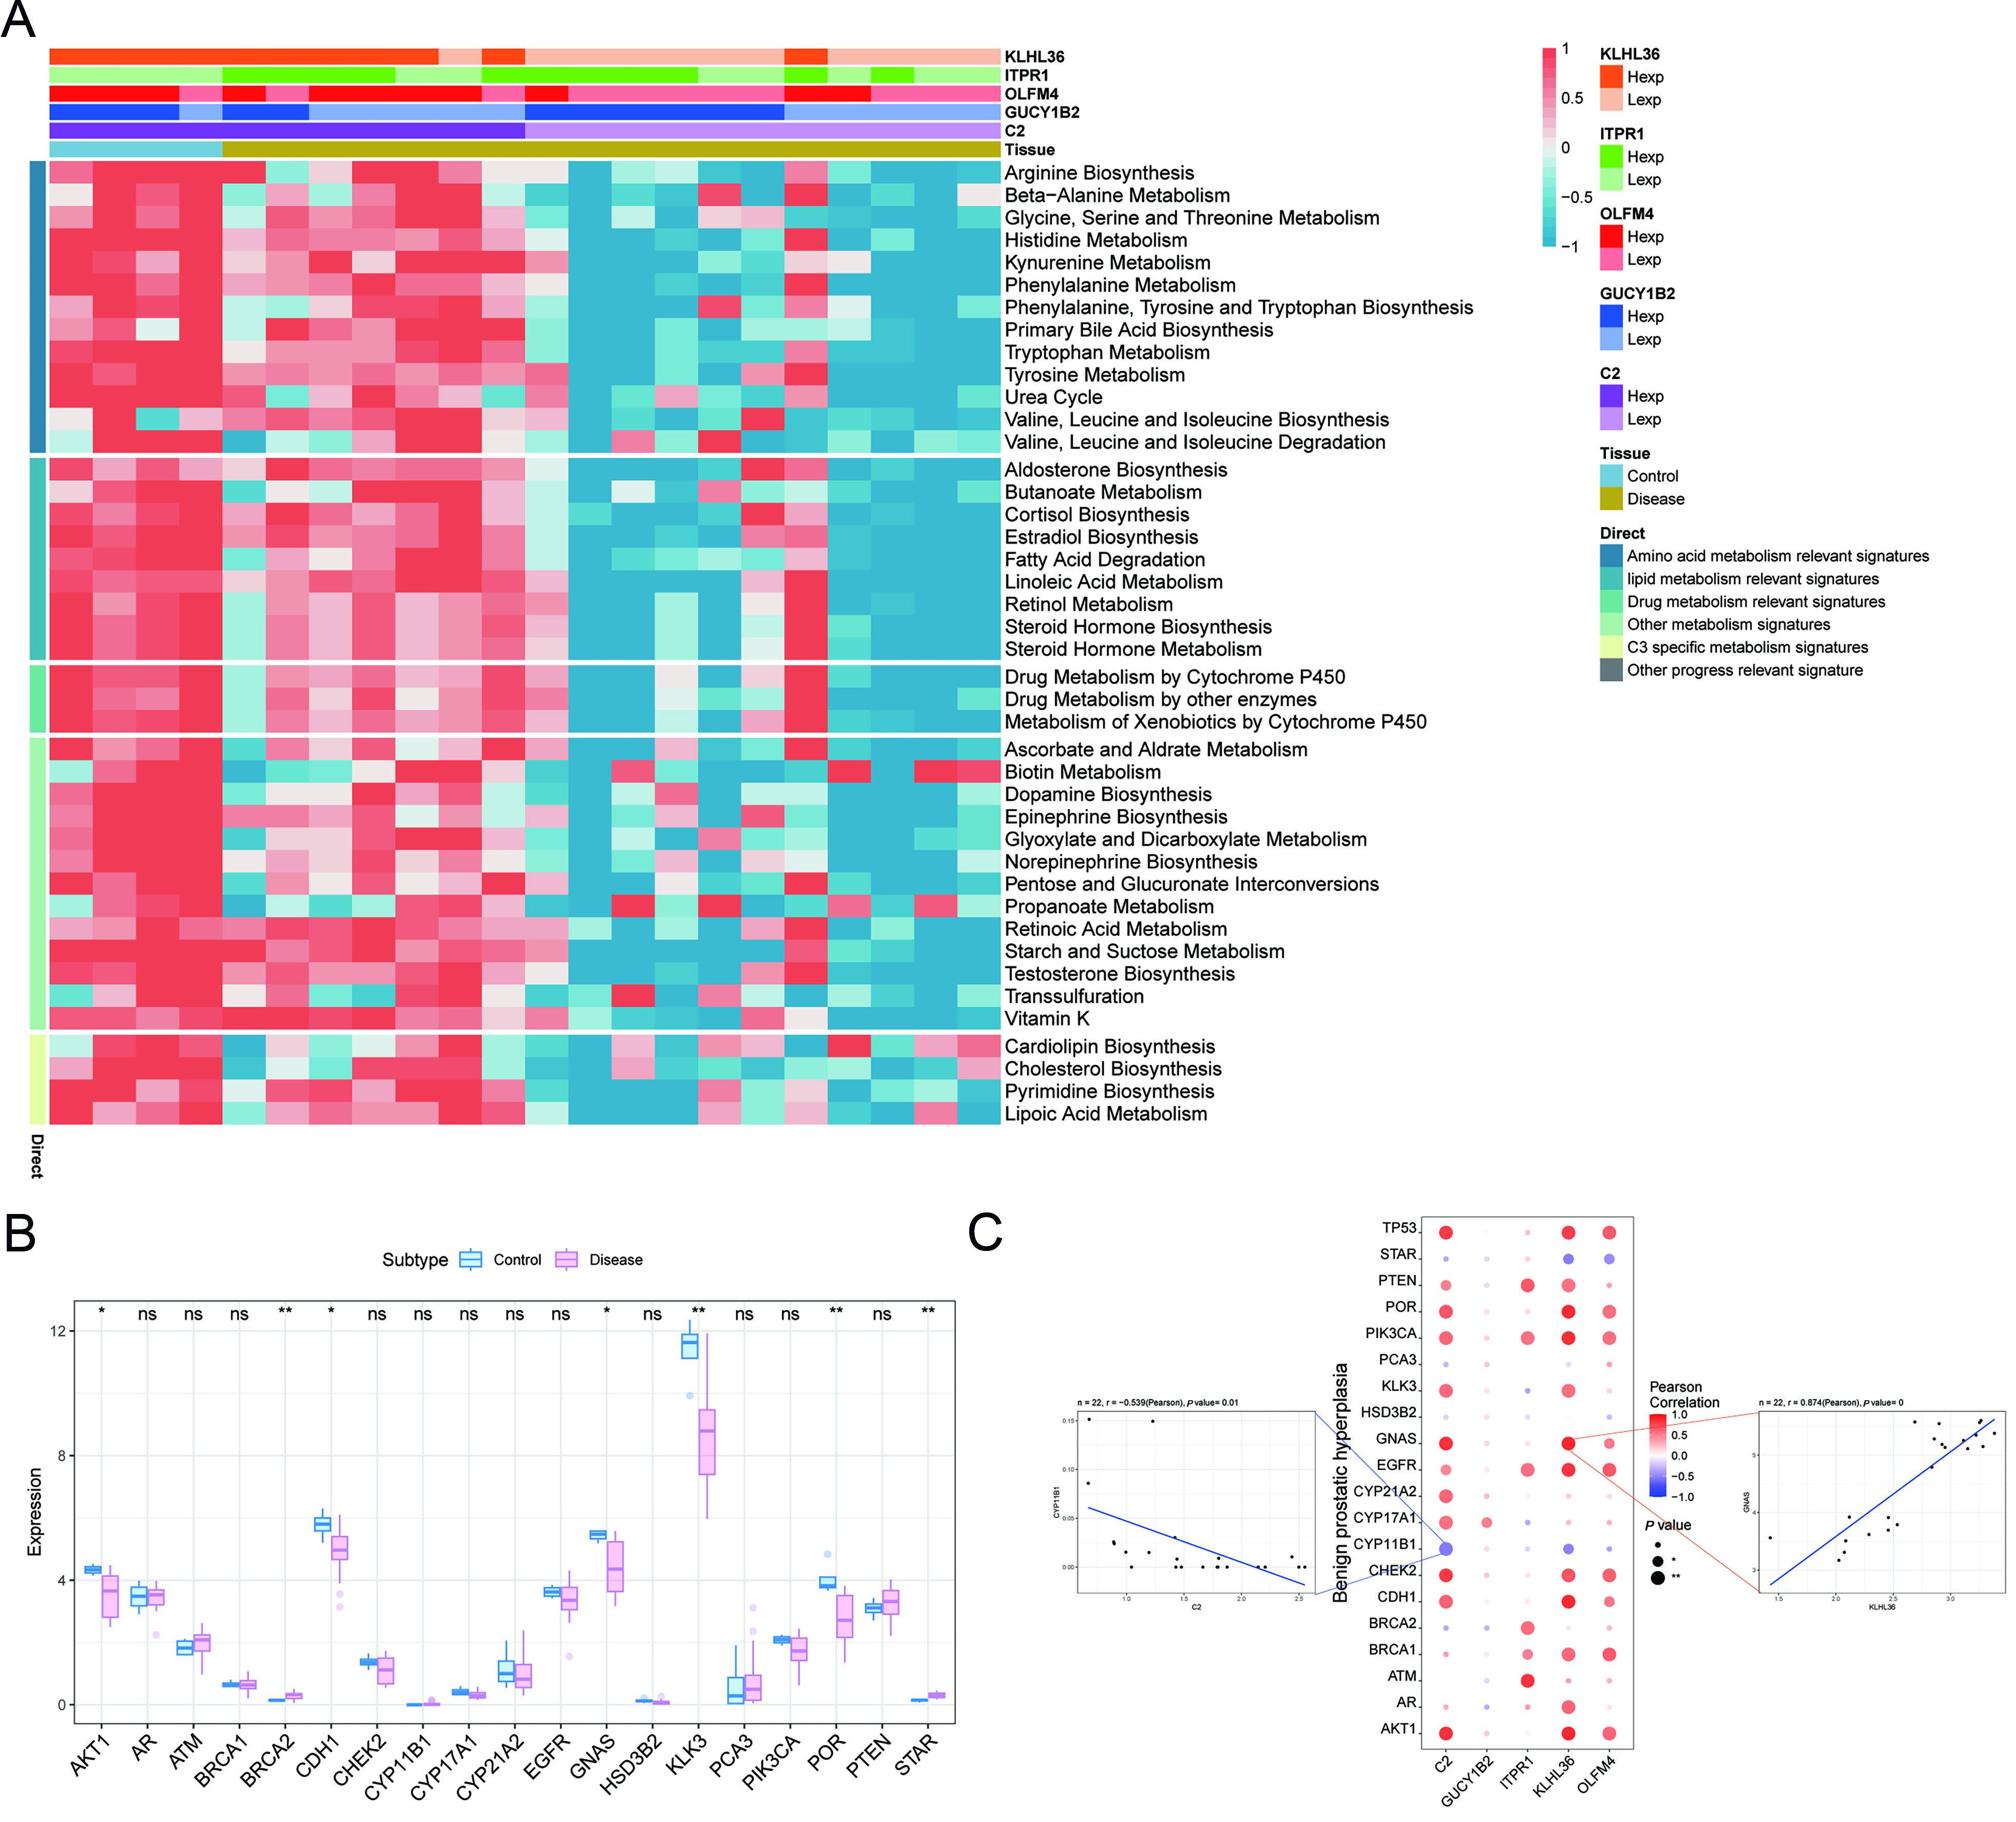
Figure 11. Correlations between key genes, representative pathways, and disease-related genes. (A) Heatmap of correlations between prioritized genes and representative metabolic pathways; blue indicates lower values and red indicates higher values; (B) Differential expression of representative BPH-related genes between control and BPH samples; blue represents controls and pink represents patients; (C) Correlation analysis between prioritized genes and representative BPH-related genes. The central bubble plot shows Pearson correlation coefficients, with color indicating direction and magnitude and dot size reflecting statistical significance. The left and right scatter plots illustrate representative correlations for C2 versus CYP11B1 and KLHL36 versus GNAS, respectively. BPH: Benign prostatic hyperplasia; C2: Complement component 2; GUCY1B2: guanylate cyclase 1 soluble subunit beta 2; OLFM4: olfactomedin 4; ITPR1: inositol 1,4,5-trisphosphate receptor type 1; KLHL36: kelch like family member 36; GNAS: GNAS complex locus.


