


fig4
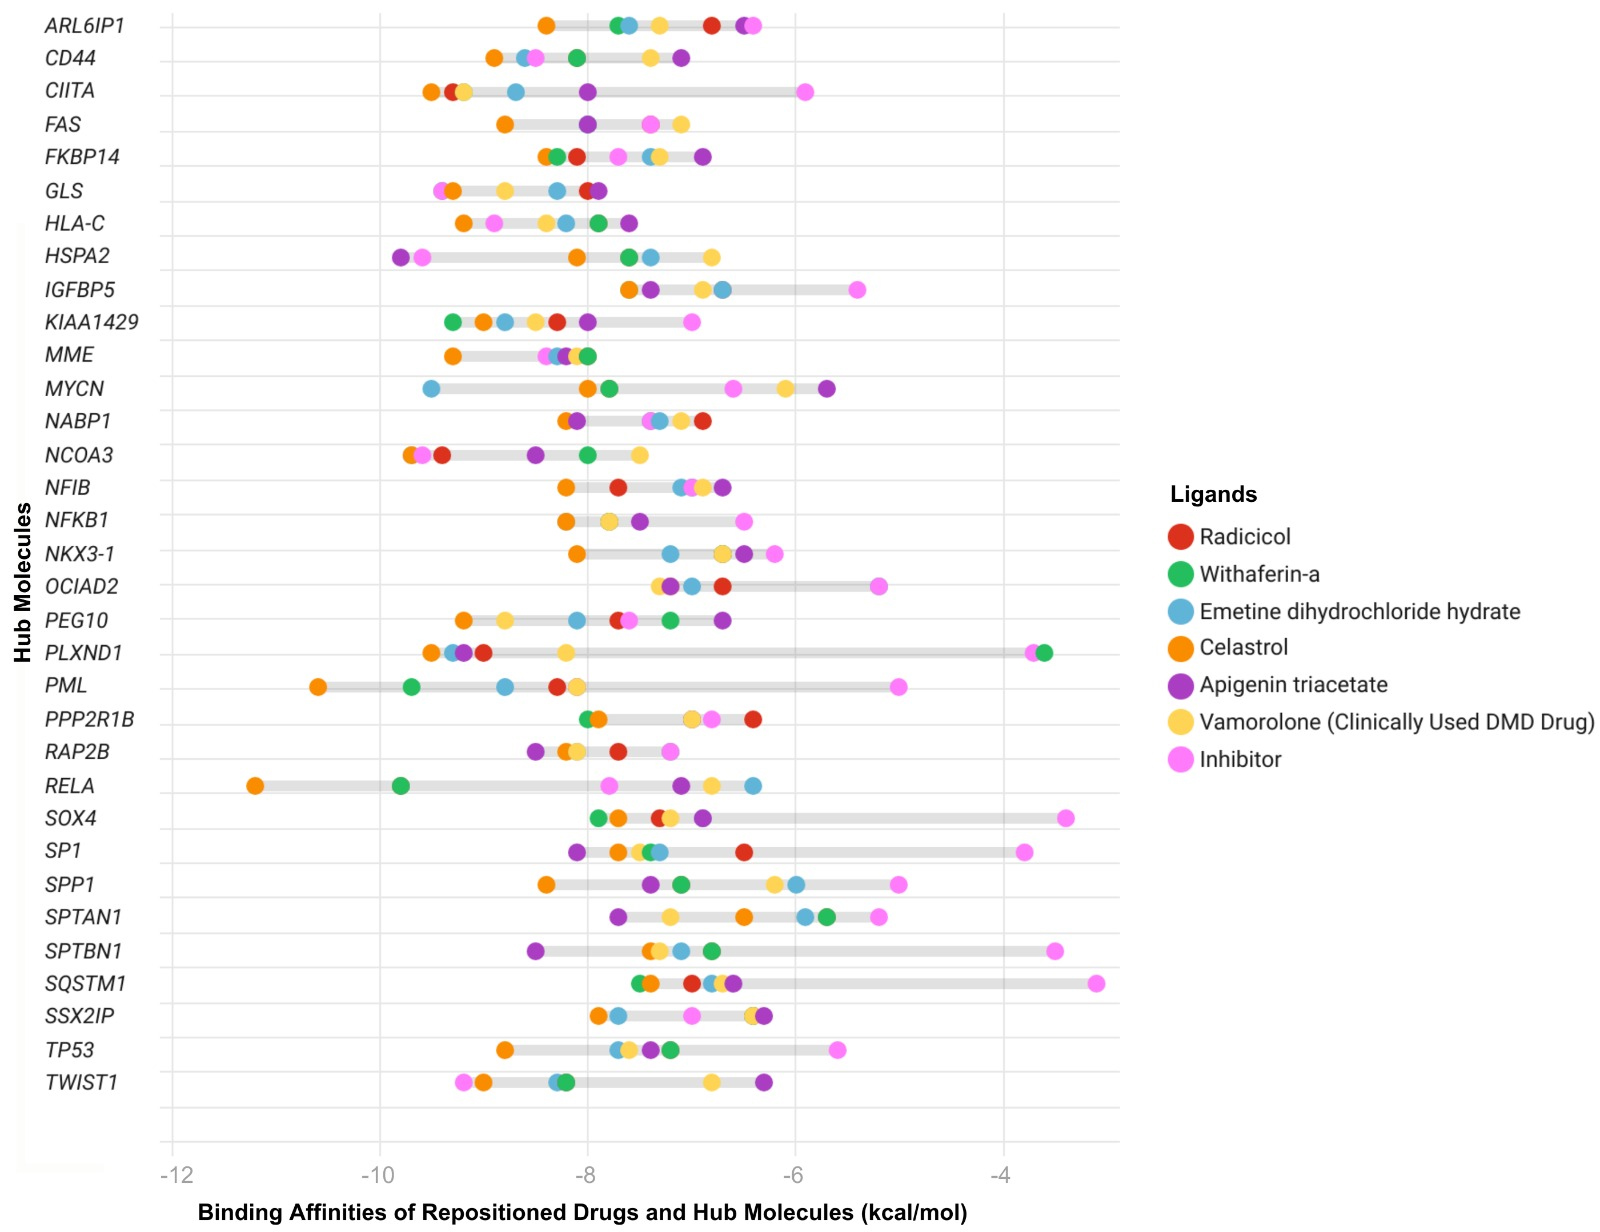
Figure 4. Predicted binding affinities of ligands - including hub inhibitors, the clinically used DMD-specific drug vamolorone, and repositioned drugs - were assessed by molecular docking analysis. Each drug is represented by a different color. Binding energies were calculated using CB-Dock, with more negative values indicating stronger predicted ligand-protein interactions. Each point represents the docking score for a specific hub protein - ligand pair. The Y-axis shows the most central network biomarkers identified through integrated PPI, TF, and miRNA network analyses, representing key regulatory molecules implicated in DMD pathogenesis. The X-axis lists the same hub proteins. DMD: Duchenne muscular dystrophy; PPI: protein-protein interaction; CB-Dock: cavity-detecting blind docking.


