


fig1
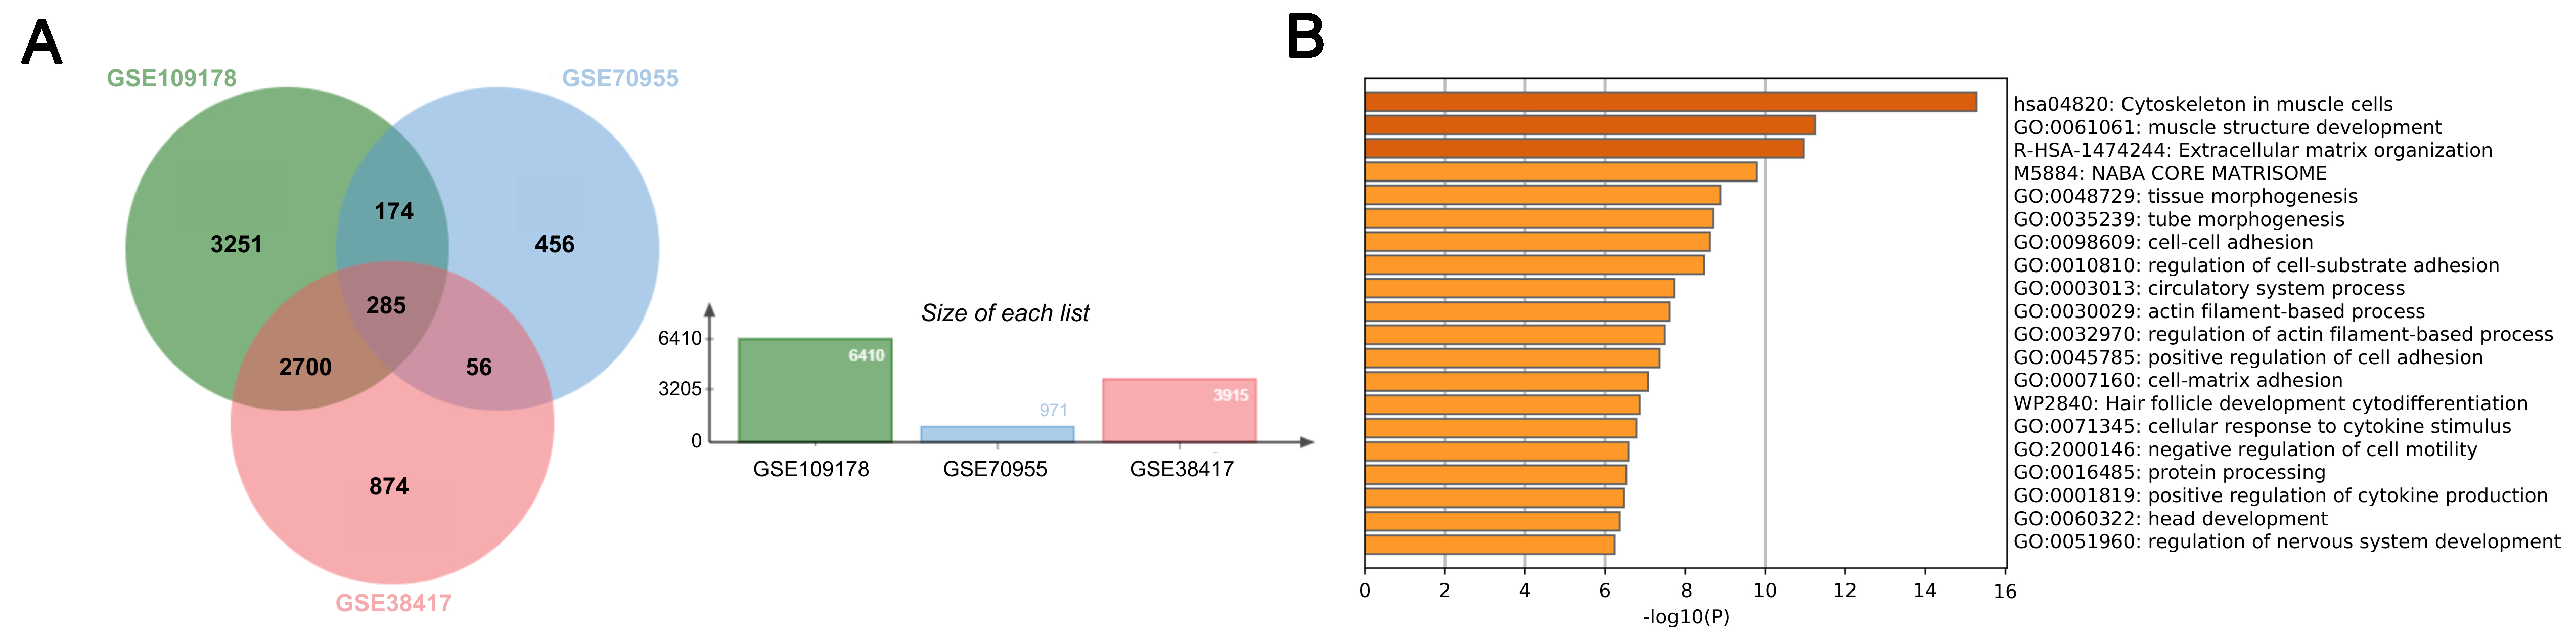
Figure 1. (A) A Venn diagram representing intersections of DEGs for three datasets; (B) Functional enrichment analyses of common DEGs. DEGs: Differentially expressed genes.
Figure 1. (A) A Venn diagram representing intersections of DEGs for three datasets; (B) Functional enrichment analyses of common DEGs. DEGs: Differentially expressed genes.


All published articles are preserved here permanently:
https://www.portico.org/publishers/oae/


