


fig7
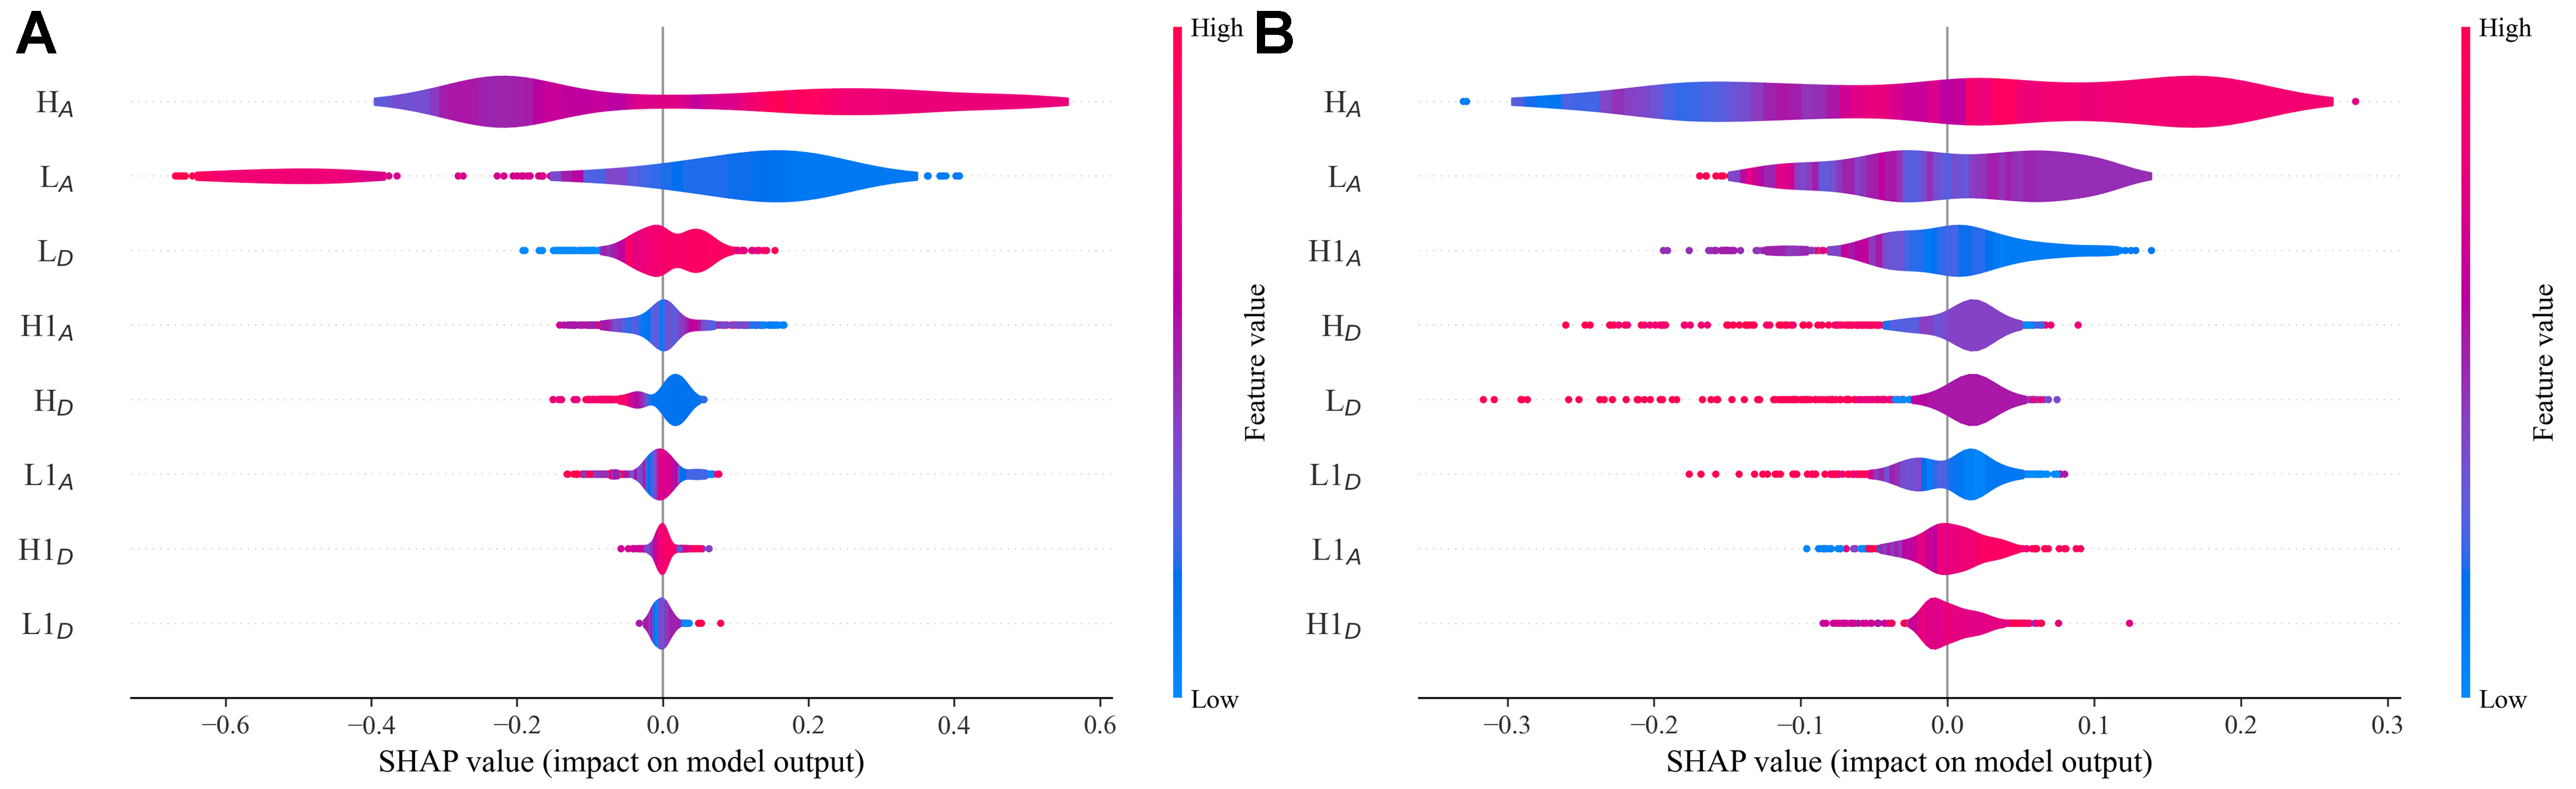
Figure 7. SHAP analysis results for (A) ΔETT and (B) ΔEST predictions using the XGBoost model. The horizontal axes represent SHAP values quantifying each descriptor’s contribution, with positive/negative values indicating enhancing/reducing effects on the target energy gaps. Vertical descriptor ordering reflects their relative importance, while the color gradient (blue to red) encodes the actual values of each FOD, with blue and red corresponding to low and high values, respectively. SHAP: SHapley Additive exPlanations; XGBoost: eXtreme gradient boosting; FODs: fragment orbital descriptors.


