


fig4
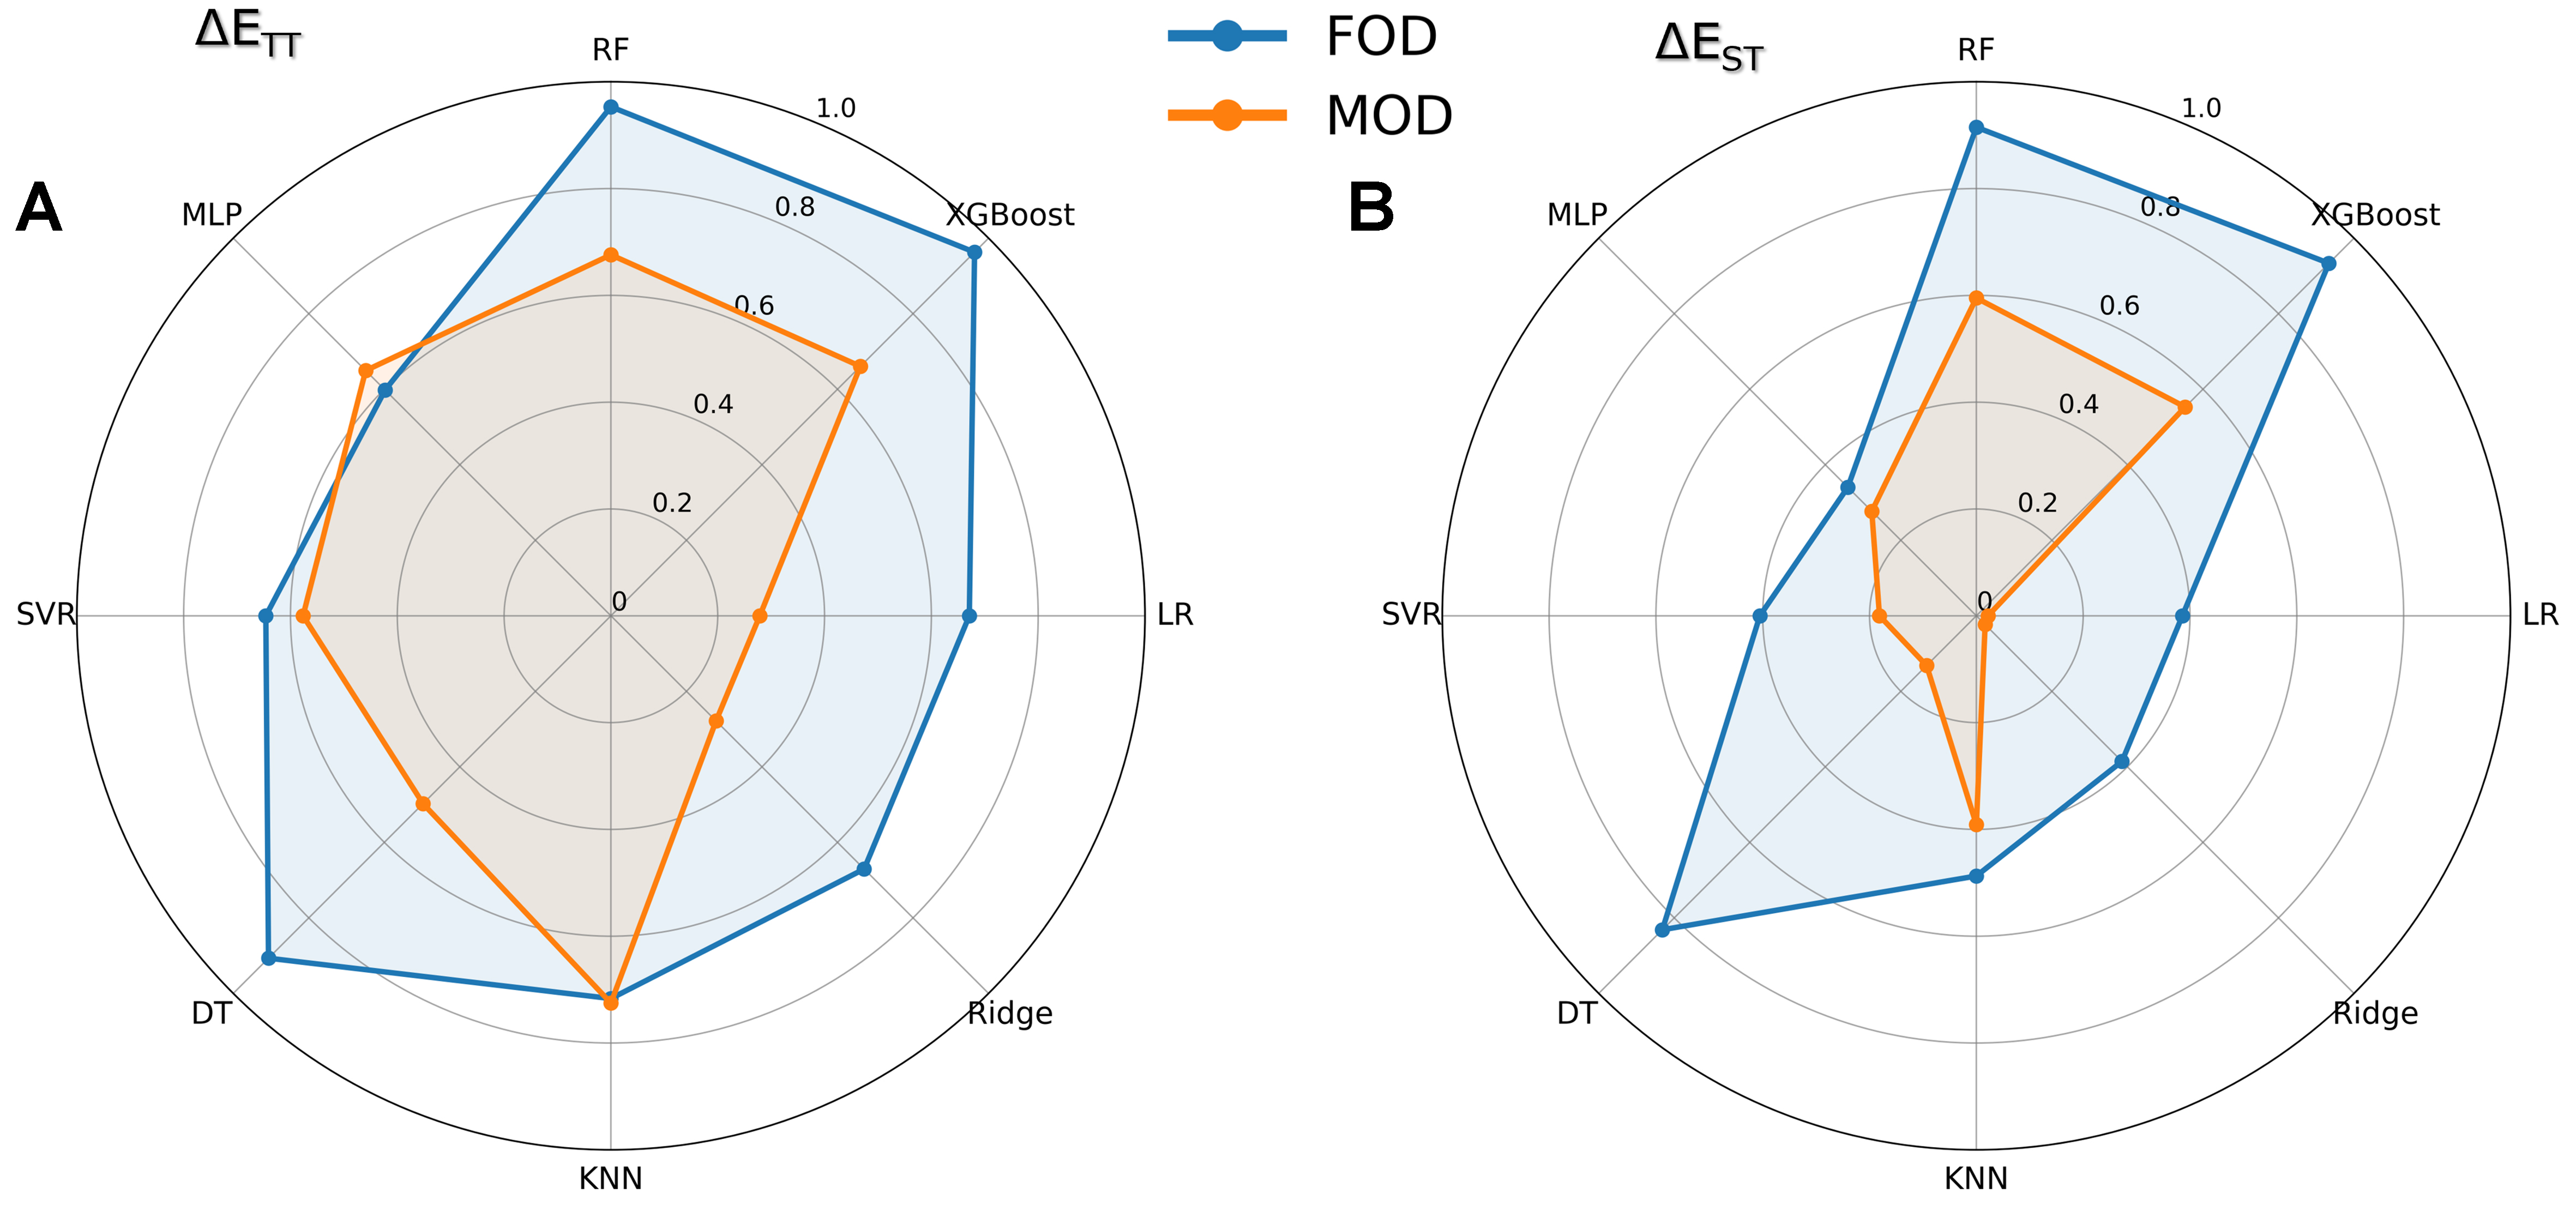
Figure 4. Comparative performance of FODs vs. MODs across eight ML models. Radar plots display R2 values for predictions of (A) ΔETT and (B) ΔEST, where radial distance from the center corresponds to prediction accuracy (greater R2 values extend further toward the outer edge). Each axis represents one ML algorithm, enabling direct visual comparison of descriptor effectiveness. FODs: Fragment orbital descriptors; MODs: molecule orbital descriptors of complete DAD molecules; ML: machine learning; R2: the coefficient of determination; RF: random forest; MLP: multilayer perceptron; SVR: support vector regression; DT: decision tree; KNN: K-nearest neighbors; LR: linear regression; XGBoost: eXtreme gradient boosting.


