
fig9
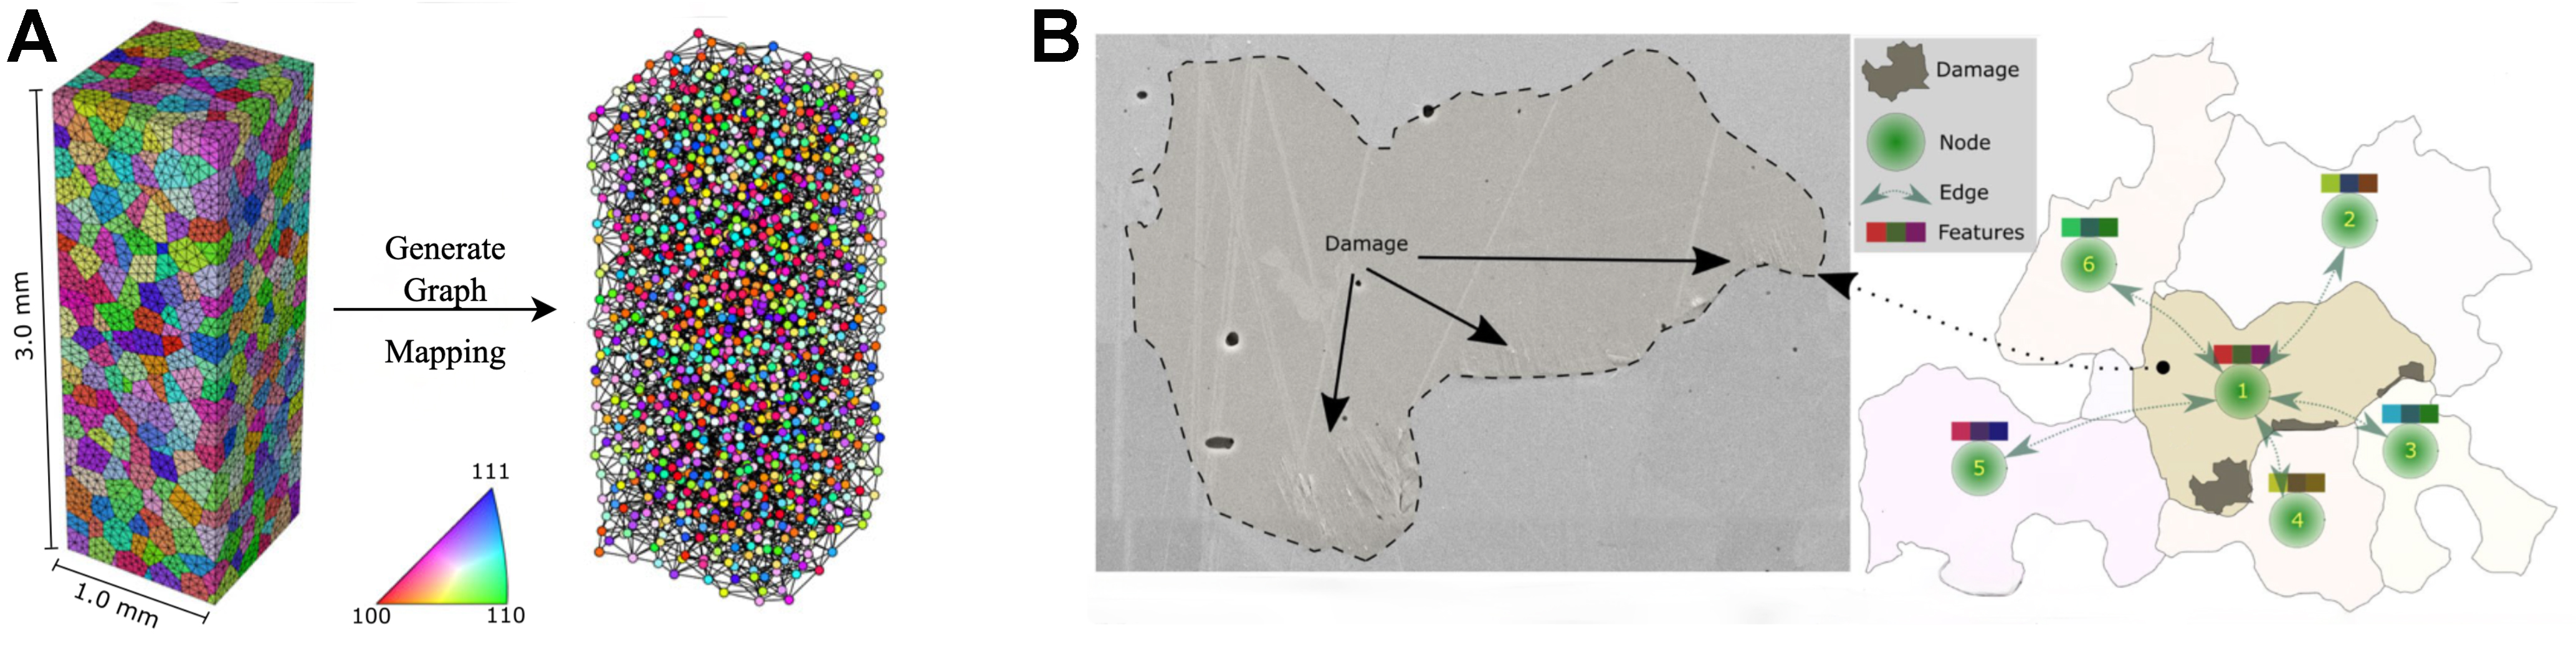
Figure 9. (A) Pipeline for mapping crystallographic graphs to direction-dependent elastic constants; grains are treated as nodes and grain-boundary misorientations as weighted edges, enabling anisotropic elastic behavior to be learned directly from the topology; (B) Graph-transformation scheme for ferritic steel, in which microstructural snapshots are converted into time-evolving graphs whose updated edge weights capture damage accumulation and allow high-cycle fatigue life to be predicted. These examples illustrate how bespoke graph representations can be tailored to very different mechanical-property targets. Reproduced with permission from Refs.[56,63]. © 2022 and © 2023 The Authors.