
fig11
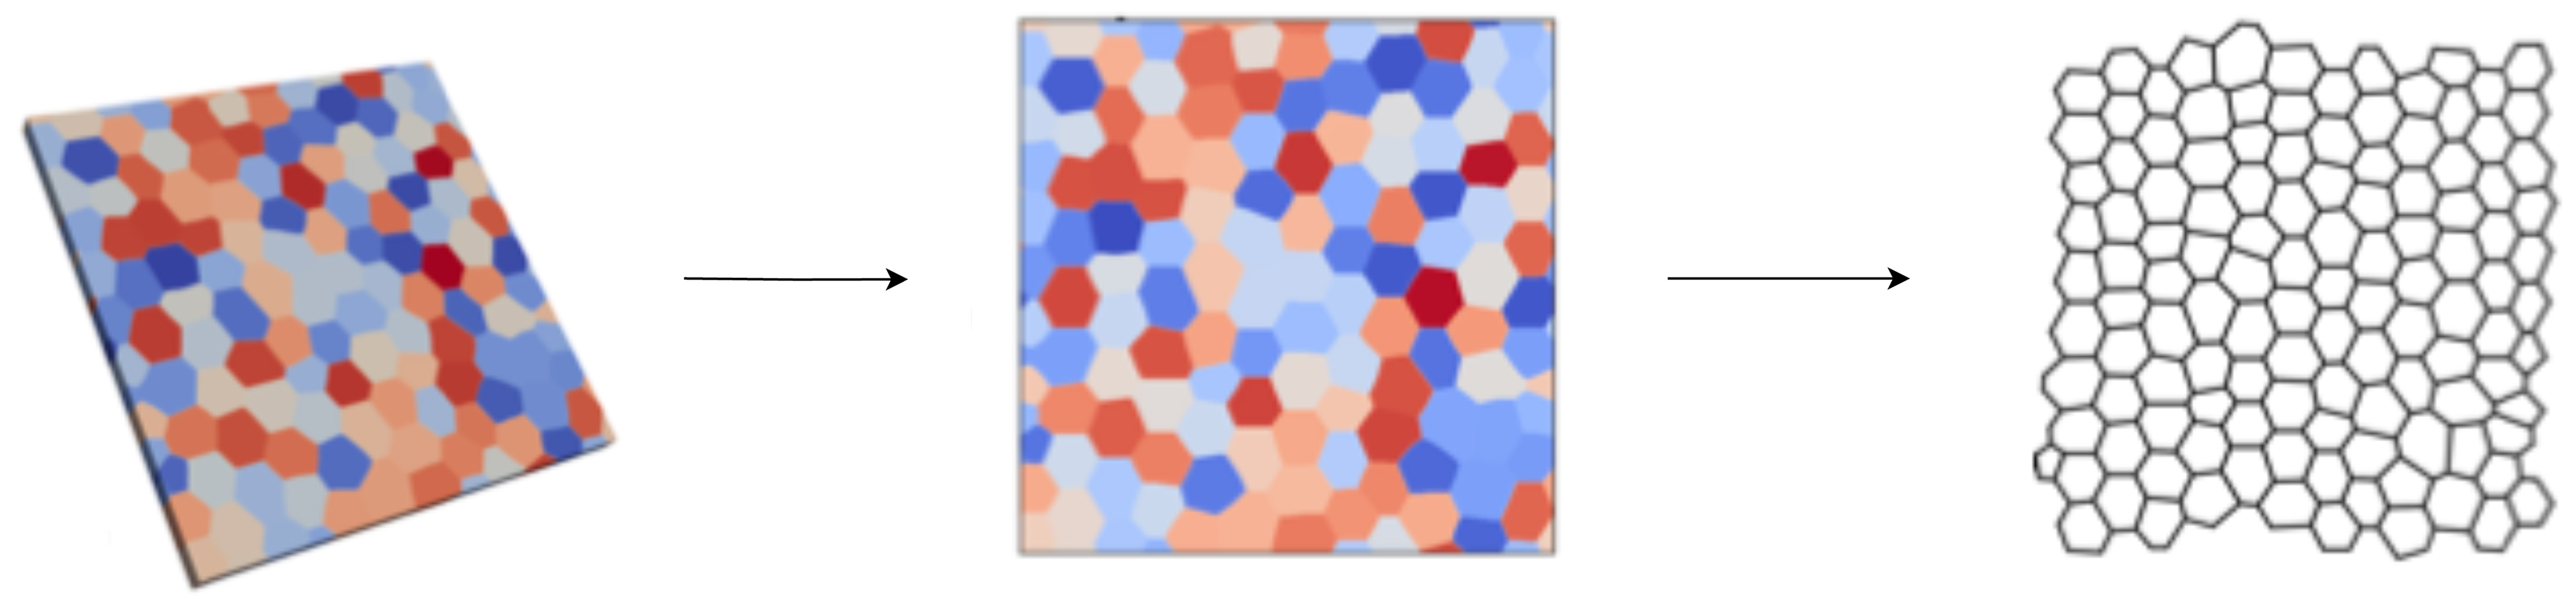
Figure 11. Compression of grain-evolution data during solidification into a two-dimensional graph representation. Successive 3D microstructure snapshots are projected onto a plane; each grain becomes a node whose color encodes crystallographic orientation, while shared grain boundaries are converted to edges weighted by boundary length. This 2D graph retains the essential topological information needed to track grain coalescence and growth kinetics with greatly reduced storage and computational cost. Adapted from Ref.[72], copyright © 2024 Elsevier Inc.